


Download PDF
Abstract
Despite national and international commitments to food systems transformation and an increasing adoption of common indicators, no comprehensive targets have been established against which progress can be measured. Here, building on the Food Systems Countdown Initiative framework, we identify existing targets—based on internationally agreed commitments and normative goals—and establish benchmarks—based on empirically derived peer performance reference values at the global, regional and income group levels—for 44 Food Systems Countdown Initiative indicators. We also assess countries’ historical progress and the rate of change required to achieve targets and benchmarks over two different timescales. We show that current progress is insufficient to meet 2030 targets and benchmarks at global level. Comparing countries’ status to regional and income benchmarks, which are generally less ambitious, yields better performance across indicators and regions, although gaps remain. Achieving most targets and benchmarks by 2050 is possible if countries correct course and accelerate progress, but certain indicators will require considerable investment and intervention.
Despite the ambitious scope of the indicator targets for tracking the Sustainable Development Goals (SDGs) and the importance of transforming food systems for achieving global health, sustainability and development goals being increasingly recognized by national governments, international institutions and local to global civil society1,2, including under the auspices of the 2021 United Nations Food Systems Summit (UNFSS)3, there remains large gaps with regards to monitoring food systems towards an agreed set of desired outcomes. To fill this gap, the Food Systems Countdown Initiative to 2030 (FSCI) established a global food systems monitoring framework consisting of 50 indicators across 5 thematic areas: (1) Diets, Nutrition and Health; (2) Environment, Natural Resources and Production; (3) Livelihoods, Poverty and Equity; (4) Governance; and (5) Resilience4,5. Previous analyses presented a baseline assessment3, examination of historic time trends6 and qualitative assessment of interactions between indicators to identify promising entry points for action6. While useful in understanding which indicators had historically been moving in a desirable or undesirable direction, the simple trend analysis highlighted the need for defining a set of achievable and aspirational targets or other benchmarks against which to assess country progress—and to consider the future trajectories needed to achieve them7.
Transforming systems demands ongoing measurement and evaluation of every element, providing decision-makers with the evidence needed to drive informed policymaking, priority setting and ensuring accountability for meaningful change. However, what constitutes success varies by context. Therefore, the chosen methods to define reference points and measure progress are scientifically and politically consequential. Methodological options to define a desired reference point or ‘target setting’ commonly include: an analysis of historical trends, aligning with normative guidance or expert judgements, using specific empirical evidence that quantifies levels at which there is state change (thresholds or boundaries) or desirable outcomes are achieved or using simulation modelling tools to explore alternative future pathways in relation to historical trends and future targets. Setting uniform global targets, while egalitarian, fails to acknowledge meaningful differences in the underlying nature of various indicators (that is, economically or biophysically driven), as well as contextual differences such as varying starting points and competing priorities8. This conundrum is inherent in the SDGs, containing 169 targets and 232 indicators, with varying relevance across regions and countries9,10. Recent efforts to address this criticism formulated target ranges (for example, The World in 205011 Initiative and Systems Change Lab12) that account for varying degrees of trade-offs required to make the systems shifts needed to protect both people and the planet. However, these efforts lacked inclusive or consensus-based approaches and did not consider existing agreed-upon targets. Moreover, so far, no such effort has been applied to the holistic nature of food systems.
This study makes three contributions filling both methodological and empirical gaps regarding how countries are performing on food systems transformation. First, we identify existing targets—internationally agreed commitments and normative goals—and establish benchmarks—empirically-derived peer performance reference values at the global, regional and income-group levels—for 44 FSCI indicators. Second, we develop a methodological approach to assess current state, evaluate historical progress and identify future rates of progress required to achieve targets and benchmarks over two different timescales. Third, we quantify and compare the magnitude of progress required to meet each target or benchmark, offering a clearer picture of the gaps that must be closed to achieve a sustainable food system transformation. Jointly, these analyses provide a comprehensive assessment of how food systems are (and are not) performing.
Results
To measure global, regional and national food systems progress, this study leveraged existing target-setting methods and developed a benchmarking approach. This resulted in two types of reference points: targets (static) and benchmarks (relative and dynamic) (Extended Data Table 1). Global targets were drawn from literature, on the basis of pre-existing international commitments, rights conventions or theoretical minimums or maximums. In total, we identified 30 global targets (Diets, Nutrition and Health (n = 11); Environment, Natural Resources and Production (n = 5); Livelihoods, Poverty and Equity (n = 3); Governance (n = 5); and Resilience (n = 6)), presented in Supplementary Table 1. Global, regional and income benchmarks were derived through expert consultation and on the basis of a positive deviance, or exemplars, approach13, where countries that perform better are used as the reference group. For each indicator, we used an un<a href="https://healthylife7.com/new-weight-loss-pill-approved-for-use-in-uk/” title=”New weight loss pill approved for use in UK”>weighted ranking to calculate the mean of latest values (available between 2015 and 2024) for countries within the 80th percentile (for indicators where higher is better) or 20th percentile (for indicators where lower is better). We established these benchmarks at a global level (considering all countries, one benchmark per indicator), at a regional level (one benchmark per region or five benchmarks per indicator) and at an income level (one benchmark per income group or four benchmarks per indicator). The countries contributing to each indicator’s global, regional and income benchmark are presented in Supplementary Tables 2–4. We omitted 15 FSCI indicators from this analysis, as measuring progress towards a static or relative reference point did not make conceptual sense or there were insufficient data for meaningful results.
When comparing global benchmarks to global targets, in most cases, the global benchmark value was equivalent or exceeded the global target value (for example, access to safe water, fruit availability, cropland change, female landholdings and mobile phones per 100 people). However, there are exceptions, where the global benchmark value was at least 30% lower than the global target (for example, minimum dietary diversity for children, fisheries health index, civil society participation, government accountability index and government effectiveness index). Comparably, most regional and income benchmarks were below (if desirable direction is higher) or above (if desirable direction is lower) the global targets and global benchmarks.
Methodological approach to assess performance
Three metrics were used to assess food systems performance: current state, historical progress and required future progress. First, we estimate the current state by calculating the distance between the current value and each reference point value (global targets, global, regional and income benchmarks), using the latest data point per country, per indicator. We present these distances through global, regional and income averages. Second, using the SDG methodology, we estimate historical progress by calculating the compound annual growth rate of each country, for each indicator, using two data points between 2015 and 2024. We then assessed the likelihood of countries meeting the global target by 2030 and 2050, assuming that this rate would be maintained. Where the global target was not available, we use the global benchmark. Third, we estimate required future progress by calculating the compound annual growth rate required to meet 2030 and 2050 global targets and global, regional and income benchmarks, considering current state and historical progress. For both historical and required future progress, we present the global or regional average compound annual growth rates as average percentage change per year (percentage per year), considering each indicator’s desirable direction.
In summary, we assessed food systems performance in three ways: where countries stand now compared with targets and benchmarks (current state), how fast they have improved since 2015 (historical progress) and how quickly they need to improve going forward to meet the 2030 and 2050 goals (required future progress). These metrics show whether countries are on track—and how much faster they need to go. All country-specific assessments can be found in Supplementary Data 3
Global analysis
Current state
There are large gaps between current state and global targets and benchmarks but much smaller gaps when compared with regional and income-based benchmarks. This difference occurs because regional and income benchmarks are set at lower, more achievable levels than the ambitious global targets and benchmarks (Supplementary Table 5). Globally, the mean absolute distance from global targets (using the latest data point available for all countries and considering the desirable direction), reveals that only one target has been fully met (mobile phone subscriptions) and for two indicators, the global mean is greater than 75% away from their target (fisheries health index and food systems emissions change) (Extended Data Table 2 and Supplementary Fig. 1). A similar pattern emerges when observing global benchmarks, although a few indicators perform better by this metric, including minimum dietary diversity for children, consuming all five food groups, fisheries health index and civil society participation (Extended Data Table 2 and Supplementary Fig. 2). When disaggregated by regions, key nuances are observed in current regional mean absolute distances to global targets and global benchmarks (Supplementary Tables 6 and 7). Across all indicators, Europe, followed by Asia, has the most indicators, with a regional mean distance less than 25% away from any global target or global benchmark—suggesting that these regions are closer to achieving targets. Africa and the Americas display the fewest indicators close to global targets.
At the country level, distinct regional leaders emerge on the basis of their distance to multiple global targets and global benchmarks. New Zealand leads in the Oceania region, demonstrating the smallest distance to global targets or global benchmarks for 14 indicators across 4 themes. In other regions, there are varying patterns of performance. Tunisia leads Africa, ranking closest to or meeting global targets and global benchmarks for 16 indicators, while Iceland, Canada and Japan lead their respective regions, with 21, 17 and 16 indicators across multiple themes.
Historical progress
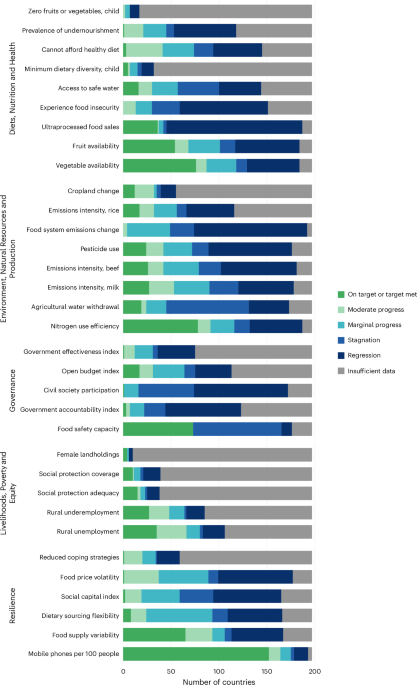
Results show that current rates of progress are insufficient to meet any global target or global benchmark (in cases where indicators lack a target) across most countries by 2030 (Fig. 1 and Supplementary Tables 8 and 9). For nearly all indicators, Fig. 1 shows that only a small proportion of countries with data have already met the target or benchmark. Most countries show marginal, stagnating or regressing progress in meeting the global target or global benchmark. Moreover, if countries do not improve their rates of change, most are unlikely to meet these targets and global benchmarks even by 2050 (Supplementary Fig. 3). There are five exceptions: for cropland change, rural unemployment and underemployment, food supply variability and mobile phone subscriptions, half of countries with available data have already met or are moderately progressing to meet targets or global benchmarks by 2030.
Distribution of countries across different progress categories for each indicator, organized by theme and sorted by performance. All bars represent 197 countries. Analysis is limited to those with at least two non-missing data points between 2015 and 2024 to enable trend projection to 2030. Progress categories are defined by progress ratios in Extended Data Table 3. Countries with insufficient data for trend analysis are categorized as ‘no or insufficient data’
To complement this assessment, an update of the trend analysis of Schneider and colleagues4 is provided in Supplementary Fig. 4. Compared with the previous year, which covered 2000–2022, the present analysis covering 2000–2023 shows that two additional indicators are moving in a desirable direction (food systems pathway and dietary sourcing flexibility) and all 20 indicators moving in a desirable direction have maintained it. Five indicators continue trending undesirably (civil society participation, cost of a healthy diet, experiencing food insecurity, government accountability and pesticide use), now joined by ultraprocessed food sales and food systems change. Food price volatility and rural underemployment were previously trending undesirably but the addition of one more year has moved the trend line to no change, along with 13 other indicators.
Required progress to reach global targets and benchmarks
Prioritizing development policies, innovations and investments requires understanding the annual percentage change needed to reach global targets and global benchmarks by 2030 and 2050. Figures 2 and 3 show which indicators will require substantial changes. Indicators in red suggest annual changes exceeding 15% (that is, practically unattainable rates of change), with many indicators being in this category for the 2030 targets. For example, achieving the target of 100% of people having access to safe water by 2030 (set by the UN General Assembly) in Africa would require a 31.5% annual increase in access every year until 2030. Further, there are stark differences between the ideal state (global targets) and the achievable state (global benchmarks) by 2030. This pattern is particularly evident for indicators under the Diets, Nutrition and Health theme, such as the prevalence of undernourishment, where the annual change to meet the target ranges between −35.5% and −62.5% across regions but decreases to between −0.7% and −17.0% to meet global benchmarks.
Analysis based on the EMA method (α = 0.5) to assess required regional mean compound annual percentage change to meet global targets by 2030 and 2050. Regional averages are unweighted. Negative values indicate a need to decrease (as the desirable direction of the indicator is lower) and positive values indicate a need to increase (as the desirable direction of the indicator is higher). The number of countries used in each regional average is presented in Supplementary Table 12. Colour thresholds reflect the magnitude of required annual change rates (green <5%, red >15%) and do not represent assessments of feasibility or relative difficulty. Achievement of these rates depends on context-specific factors including political capacity, resource availability and biophysical constraints that vary across countries and indicators. Dark green, 0% (meeting target); light green, <~5%; yellow, ~5–10%; orange, ~10–15%; red, >~15%.
Analysis based on the EMA method (α = 0.5) to assess required regional mean compound annual percentage change to meet global benchmarks by 2030 and 2050. Regional averages are unweighted. Negative values indicate a need to decrease (as the desirable direction of the indicator is lower) and positive values indicate a need to increase (as the desirable direction of the indicator is higher). The number of countries used in each regional average is presented in Supplementary Table 13. Colour thresholds reflect the magnitude of required annual change rates (green <5%, red >15%) and do not represent assessments of feasibility or relative difficulty. Achievement of these rates depends on context-specific factors including political capacity, resource availability and biophysical constraints that vary across countries and indicators. Dark green, 0% (meeting benchmark); light green, <~5%; yellow, ~5–10%; orange, ~10–15%; red, >~15%.
Among regions, Africa consistently faces the steepest hurdles, requiring dramatic changes exceeding 15–20% per year to meet global benchmarks for 16 indicators, such as the percentage of the population experiencing moderate or severe food insecurity, agricultural water withdrawal, government effectiveness index and child labour, while Europe generally needs the smallest adjustments. Certain indicators demand transformative actions across all regions, including food system emissions change (requiring >70% annual reductions for 2030 targets), child labour, government effectiveness, affordability of a healthy diet, food insecurity and zero fruit or vegetable consumption. For most indicators, the required changes for 2050 are less dramatic compared with 2030, but still demand considerable progress to reach the goal.
It is important to acknowledge that a single country’s performance may influence the regional average, particularly in regions with few countries (Oceania) or when a populous nation drives the aggregate. For example, for minimum species diversity (an indicator that reflects the percentage of agricultural land (crop and pasture) with 24 or more species), Kuwait must increase by 70% per year, to meet the global target (set at 100%) and global benchmark (set at 95%) by 2030, compared with the regional average of ~20% per year. In other cases, regional aggregates for food system emissions are influenced by countries with large agricultural sectors (for example, China and India in Asia, the USA and Brazil in the Americas and the Democratic Republic of the Congo in Africa); these values are proportional to agricultural scale and population but can obscure patterns among smaller countries within the region.
Despite the large changes required, there are some promising findings. For example, to meet the global target for women’s minimum dietary diversity (100% of women, an SDG target) annual changes of less than 5% are required in three of four world regions with data. Functional integrity, food safety capacity and dietary sourcing flexibility index (DSFI, measures the diversity of pathways through which food reaches consumers) will also require only modest (<10%) and comparable efforts across regions. As global benchmarks tend to be less ambitious, there are more indicators for which achievement requires only modest changes across regions. For example, to meet the global benchmark for social capital index (assesses social cohesion and engagement, community and family networks, and political participation and institutional trust), annual changes of less than 5% are required in Asia, Europe and Oceania, and less than 10% in Africa and the Americas. Food supply variability will also require only modest changes (<10%), relatively comparable across regions. However, for some of these indicators, particularly women’s minimum dietary diversity and food safety capacity, this modest assessment is partly an artefact of limited historical data rather than a definitive indication of progress. As more comprehensive data become available, these targets and benchmarks may prove more challenging to achieve than current estimates suggest.
Allowing 20 more years to meet the target shows many more indicators with potentially achievable required growth rates (that is, <5% per year), although there remain indicators where targets are out of reach except at very high sustained growth rates (for example, food insecurity and food systems emissions change). Indicator-specific trajectories to global targets and global benchmarks by region are shown in Supplementary Figs. 5–49
Regional and income-level analysis
Current state
Countries’ performance compared with others in their region or of similar income level presents a more realistic picture, largely owing to their more homogeneous levels of development (Supplementary Tables 10 and 11). In particular, differences between regional averages and regional benchmarks were smaller than differences between global averages and global benchmarks across various indicators in Africa and the Americas. For example, on average, African countries are 58.7 percentage points away from the global benchmark of only 2% of the population being unable to afford a healthy diet (Supplementary Table 7); when compared with the African benchmark of 28.5% of the population; however, the difference is somewhat more manageable at 32.2 percentage points (Supplementary Table 10). In contrast to Africa and the Americas, the Asian, European and Oceania regions generally had similar distances whether comparing to global or regional benchmarks, with a few exceptions. Despite lower regional thresholds, all regions were still far from meeting the regional benchmarks for agricultural water withdrawal and pesticide use.
A different pattern emerges when comparing the performance of countries against others in their income group. For some indicators, the mean either rose or fell relatively consistently across income groups—but the benchmark also rose or fell in tandem, resulting in a similar difference between mean and benchmark across groups. For example, for the open budget index (an assessment of the public’s access to information on how the central government raises and spends public resources), the benchmark ranged from 52.7 in low-income countries to 81.2 in high-income countries (Extended Data Table 1), but owing to differences in mean values, the distance to the benchmark was fairly uniform across income groups (ranging from 19.6 to 28.2 points below the benchmark) (Supplementary Table 11). However, some indicators (particularly in Environment, Natural Resources and Production; Diets, Nutrition and Health; and Livelihoods, Poverty and Equity) were even more strongly linked to income in that, even with the benchmark systematically increasing or decreasing with income, the distance to that benchmark also systematically increased or decreased with income. For example, for vegetable availability, low-income countries are on average 149.7 g per person per day below their group benchmark (283.2 g per capita per day), while high-income countries are on average 218.9 g above theirs—even though the high-income country benchmark is over 400 g higher than the low-income country benchmark. For others, there were fewer clear patterns. For example, rural underemployment and unemployment had no clear pattern in benchmarks or distances to them across income groups.
Required progress to reach regional and income benchmarks
The indicators requiring considerable improvements (greater than ±10% per year) across three or more regions—whether in terms of growth or reduction towards regional benchmarks—are primarily concentrated in two themes: Environment, Natural Resources and Production and Livelihoods, Poverty and Equity (Supplementary Fig. 50). For many indicators in these themes, achieving the benchmark is essentially unattainable across most regions. For example, to achieve the regional benchmark, agricultural water withdrawal would need to decrease by over 15% per year until 2030, across most world regions. However, many regions can achieve regional benchmarks by 2050 with an annual growth or reduction of less than 10% per year. Similar patterns were found for income-group benchmarks (Supplementary Fig. 51).
Discussion
Accountability for food systems transformation requires defining targets and benchmarks, as well as performance metrics to track progress towards them. Without clearly defined targets and rigorous benchmarks, efforts to transform food systems risk becoming performative rather than transformative—lacking direction, accountability and impact. This study provides an assessment of country performance towards food system transformation indicator targets across 44 indicators for both 2030 and 2050
The methodology presented here addresses a critical gap in existing literature by providing a robust approach to assess performance on development objectives across countries. It is based on: (1) a structured identification of targets, (2) development of global benchmarks to complement those targets (and substitute for them where they do not exist) and (3) development of regional and income-group benchmarks to bring nuance to the performance-assessment process. Importantly, this approach offers a food systems-specific performance analysis grounded in inclusivity and consensus. The absence of such an approach until now has led to inconsistent target setting and potential cherry-picking of indicators to measure progress—undermining the credibility of holistic food system transformation efforts, such as those promoted by the UNFSS. While there have been a few other global assessments evaluating historical and projected progress on food systems14,15,16, this paper goes further in its systematic methodology to review and set reference points. It can thus support future revisions to those efforts, provide complementary analyses on future pathways and potentially inform novel future efforts, such as the successor indicators to the SDGs17,18.
In addition, while previous efforts have focused on compiling global targets to inspire ambition across climate and health domains (for example, for the SDGs, UN Environment Programme (UNEP) Global Environment Outlook (GEO)-7 food system transformation chapter and EAT-Lancet Commission planetary health targets), this paper operationalized these targets and also provides global, regional and income benchmarks. For countries far from achieving global targets and global benchmarks, these offer more realistic milestones, as comparisons are made to more homogeneous groups, with more similar development levels and contextual constraints. The analysis of global targets presented here made clear that many countries and regions are unable to attain them by 2030—and in some cases, by 2050. While bold targets are vital for sparking commitment, investment and action, they can become a source of inertia if they are so far away that they seem unachievable. Establishing attainable benchmarks in parallel helps sustain efforts over time by reinforcing that progress is within reach, leading to more realistic action. Particularly in more homogeneous regions, a regional benchmark may motivate more countries to achieve it. Regional benchmarks may also provide a shared reference point that encourages knowledge exchange and mutual support between higher- and lower-performing countries, potentially identifying exemplars (‘regional champions’) that provide examples for expanding human and planetary health gains across similar contexts. This is particularly critical as food systems transformation is a shared responsibility, for which cross-country collaboration and support will be needed. At the same time, such benchmarks should be interpreted with caution and should not be used to imply that people in different regions or income groups do not have equal rights to high-performing food systems.
In addition to these methodological contributions, the present analysis makes clear the challenges that food systems face: current rates of progress are insufficient to meet almost all global targets or global benchmarks (in cases where indicators lack a target) across all countries by 2030. Across nearly all indicators, most countries are not on track to meet targets and in fact are plateauing or regressing, for example, for civil society participation, agricultural water withdrawal and food systems emissions change. Particularly stark is our analysis of the progress required to meet global targets by 2030: for most indicators, multiple regions require regional average growth rates that are essentially unattainable, every year until 2030, to be able to achieve the target. As benchmarks (whether global, regional or per income group) are generally less ambitious, their analysis provides a more realistic picture of performance. Yet, even here there are many indicators for which multiple regions or income groups are very unlikely to achieve benchmarks by 2030.
The outlook improves considerably for 2050 across most thematic areas and regions: most targets are achievable across at least some regions and some are achievable across all regions. This finding, however, hinges on maintaining steady momentum from this moment forward. Delayed or inconsistent action would leave us approaching 2050 still facing the same unattainable targets as we do today. Moreover, this analysis does not consider the feasibility or difficulty in meeting annual progress rates or the critical synergies and trade-offs between indicators (for example, how a need to reduce food systems emissions might affect other indicators’ progress) or population trends and dynamics (for example, the changing dietary patterns of a large emerging global middle class)19. Even with an additional 20 years of effort, targets for some indicators remain essentially out of reach, such as food systems emissions change, child labour and food insecurity. This is because many countries are either stagnating, moving in the wrong direction or would require rates of change that far exceed any historically observed annual progress, making these 2050 targets challenging to meet even under optimistic assumptions.
Our assessment re-emphasizes the need to accelerate progress on food system transformation, prioritizing and bundling policies, interventions and innovations that will affect those indicators where progress is most off track, such as food affordability, food insecurity, emissions, food price volatility and child labour—although which indicators to target most urgently will vary by context owing to local priorities20. Governance indicators not only show numerous areas for considerable improvement but are also the indicators previously found to have interactions with the largest numbers of other indicators4, underlining the importance of targeting them for improvement. For example, for government effectiveness and accountability in Africa, the Americas and Asia, meeting 2030 targets and benchmarks will be very challenging; addressing this will probably require implementing equitable and inclusive multistakeholder processes, as well as horizontal and vertical coordination across national and subnational governments.
There are some limitations to the analysis. First, for some indicators, the global benchmark is substantially higher or lower than the global target (for example, minimum dietary diversity for children aged 6–23 months, zero fruits or vegetables for both children aged 6–23 months and adults). While we presented the global benchmark for these indicators, it would be prudent to use the global target, given equal rights regardless of regional or income contexts. Second, various FSCI indicators possess an inherent lag; therefore, the impact of policy reforms, regulatory decisions or changes in governance may not translate into observable population-level outcomes or contribute to the progress assessment presented here21. For example, while an important legal advancement, recognizing the Right to Food does not translate into measurable improvements in food security without subsequent programmatic operationalization, which may take years to materialize. Similarly, for environmental indicators, ecological responses to mitigation and adaptation may be slow or stochastic22. This has implications for our findings, which may be relatively stable from year to year owing to these temporal lags between policy implementation and measurable outcomes. Third, important conceptual and data gaps persist in the FSCI framework, potentially affecting the robustness of this analysis (owing to insufficient data across countries and indicators), highlighting the need for continued refinement of indicators and new data collection to measure food systems transformation. The framework is designed to be updated as new indicators and data become available. Forthcoming revisions will concentrate on incorporating advancements that have emerged since the initial indicator selection process, including alternatives for concepts in the framework where performance analysis was not possible owing to the nature of the data or indicator construction.
As an example, the food systems emissions change indicator used in this analysis is an improvement from absolute or ratio-based emissions metrics (for example, per capita emissions and emissions per unit of agricultural output), but the underlying construction of the indicator still relies on production-based emissions accounting, which has several limitations for assessing genuine country progress23. Observed reductions may partly reflect offshoring of production rather than actual decarbonization, as countries can appear to improve by importing emission-intensive commodities, displacing their carbon footprint without reducing emissions23. Conversely, countries with large agricultural export sectors may show high emissions driven by production for foreign consumption rather than domestic23. This creates perverse incentives to shift to less emission-intensive activities domestically while increasing reliance on emission-intensive imports. Furthermore, countries with historically high agri-food system emissions baselines have more room to demonstrate percentage declines, while those with low historical baselines may find progress more difficult to achieve. Countries that reduce agricultural production will also appear to show progress even without efficiency improvements. Therefore, integrating a consumption-based emissions indicator would provide a more complete picture of climate progress by revealing emissions that are embedded in trade and identifying carbon leakage24. Similarly, future iterations should disaggregate total greenhouse gas emissions by individual gases (methane, nitrous oxide and CO2) where data permit, enabling alignment with gas-specific policy commitments and mitigation options25.
This analysis is strengthened by its alignment with international commitments and technical methods used in the SDGs. In addition, the methodology was purposefully developed to ensure clarity, transparency and reproducibility. This approach satisfies competing demands of achievability and ambition and identifies exemplar countries that can provide lessons for regional and economic peers to accelerate human and planetary health outcomes across similar contexts. Such an approach enables prioritizing investments26 and integrated programmatic action across a range of food systems sectors. It complements and builds on country-level efforts to increase ambition in food system pathways27, monitor progress and strengthen mutual accountability for food systems change—and aims to inspire more. The assessment also provides valuable inputs into the post-SDG agenda, particularly in developing targets that balance ambitious global goals with realistic local capabilities across numerous indicators. Such an approach can help balance high-level policies with practical implementation: both are essential for meaningful transformation.
Methods
Data
We compiled an updated dataset harmonized to the country-year unit of analysis and following methods delineated in Schneider et al.6. Global, regional and income group means are calculated as weighted means per year, excluding missing data, weighted by the weighting variables defined in Supplementary Data 1. No further data transformation was applied, and we did not impute any missing data. All data compilation and analyses were carried out in R version 4.4.0. The data were downloaded in March 2025 and reflect all available data points from 2000 to 2024. All data sources are listed in Supplementary Data 1, including the year of the latest data point available per country indicator. The full dataset is provided in Supplementary Data 2.
We made a few modest changes to the indicators since the last publication6, specifically in the Diets, Nutrition and Health and Resilience themes. In addition to NCD-Protect and NCD-Risk indicators (which use nine-point scales), we added related dichotomous indicators, called Protective Food Consumption and Unhealthy Food Consumption, respectively, to align with updated World Health Organization (WHO) guidelines and ease interpretation28. These indicators are included as additional data, while the NCD-Protect and NCD-Risk indicators using the nine-point scale remain the main indicators monitored. For four countries with diet quality observations for multiple years (Afghanistan, Malawi, Sierra Leone and the USA), we calculated the pooled prevalence to consider data from multiple years and assigned the pooled prevalence to the midpoint year (as also done for indicators from the Food and Agriculture Organization Corporate Statistical Database (FAOSTAT) that reflect multi-year averages). We modified the unit to present the retail value of ultraprocessed foods per capita in current US$ per person per year, instead of purchasing power parity international dollars as shown in Schneider et al.6. To calculate food price volatility, we replaced imputed values as missing for all country-years with fewer than ten observed records per year. While the linear imputation created a complete time series, it also led to potentially biased estimates of volatility when true movements in food prices were not observed. Functional integrity was calculated back to 2000, so this indicator now has a time series for 2000–2015 instead of the single 2015 value used in previous papers. The agricultural land mask was redefined. Agricultural land was defined using the UN Land Cover Classification System (22 classes) under the European Space Agency Climate Change Initiative umbrella. This classification is only used in this paper for the purposes of computing the functional integrity indicator. In the updated time series, agricultural land is defined as class 10, 20, 30 and 40. Further, functional integrity was defined from 0 to 1 with agricultural classes as 0, natural classes as 1 and mixed classes as 0.25 and 0.75 (<50% agricultural and >50% agriculture mixed with natural vegetation). Previous publications did not include the mixed classes.
New estimates of the DSFI were obtained by implementing a process of standardization that enhances accuracy and consistency in using FAOSTAT’s Supply Utilization Accounts and Detailed Trade Matrix. Previously, the DSFI was obtained by aggregating commodities at the group level and averaging nutrient content, using production quantities as weights for stocks, imports and exports. The standardization process ensures that both primary and processed commodities (for example, wheat and bread) are properly accounted for, preventing inconsistencies and double counting, resulting in more reliable estimates of the nutritional value from each pathway (production, stocks, imports and exports).
To enable performance analysis of agri-food systems emissions while maintaining interpretability, we developed a complementary indicator that normalizes current emissions relative to each country’s historical baseline. Specifically, we calculated gross agri-food systems emissions as a percentage of each country’s average emissions during the 2000–2010 period. Under this normalization, a value of 100% indicates emissions remain at baseline levels, 50% indicates emissions have halved and 200% indicates emissions have doubled. The target for this indicator is set at 0% (equivalent to zero absolute emissions), representing complete decarbonization of agri-food systems.
This approach to normalization was selected to avoid interpretive challenges associated with ratio-based metrics (for example, per capita emissions and emissions per unit of agricultural output). Ratio-based indicators introduce a second variable in the denominator, which can confound the interpretation of change, for example, declining per capita emissions could reflect either genuine emissions reductions or population growth or both. By normalizing emissions against each country’s own historical baseline, observed changes reflect only emissions trajectories rather than the interaction of multiple changing variables.
We use this baseline-normalized emissions change indicator in place of absolute emissions values for all performance analyses, including calculation of global, regional and income-group benchmarks. Absolute agri-food systems emissions values remain included in the monitoring framework and trend analysis (Supplementary Fig. 4), as they reflect the magnitude of each country’s contribution to planetary impacts29. The absolute emissions indicator tracks production-based emissions following FAOSTAT methodology, not consumption-based emissions29. The FAOSTAT domain emissions totals includes estimates of greenhouse gas emissions from agri-food systems. These cover the emissions generated within farm gate, those associated with the land use change and the emissions from pre- and postproduction food processes30.
There are also a few data limitations encountered in the updating that must be noted. First, the Legatum Prosperity Index social capital pillar was updated in 2023, but only aggregated data were made available. Our social capital indicator relies on the disaggregated data for the underlying variables in the pillar, as we use a subset that is relevant to food systems, and therefore we could not update the social capital index even though the data provider has released an update. The 2024 prevalence of the population resorting to extreme coping strategies also encountered limitations. First, the number of countries covered was reduced owing to limited funding. Second, machine learning-based prediction for countries and areas without survey operations collecting primary data were halted in mid-September 2024 to update the methodology. Therefore, the 2024 observations in our dataset are based only on data from 1 January to 14 September.
Analysis methods
Trend analysis
We repeated the trend analysis with updated data using the methods delineated in Schneider et al.5,6. We classify the slope, sign and statistical significance to categorize each indicator’s change over time into ‘desirable change’, ‘no change’ and ‘undesirable change’. Change is defined as desirable if the trend line is statistically significantly different from zero with the sign agreeing with the desirable direction of change and as changing in the undesirable direction if statistically significantly different from zero with a sign in opposition to the desirable direction of change. The coefficients that are equal to zero or not statistically significantly different from zero are classified as no change.
Setting reference points
Within this analysis, we used four reference points: global targets, global benchmarks, regional benchmarks and income benchmarks
To identify global targets, we undertook a literature review to locate both peer-reviewed and grey literature articles that described or informed reference points (that is, threshold, benchmark or target) for each indicator. An initial limited search of PubMed, Web of Science and Scopus was undertaken to identify articles. The search strategy included all identified keywords (that is, indicator names) and controlled vocabulary (for example, MeSH and Emtree terms) and was adapted for each included database and/or information source. The reference list of all included sources of evidence was screened for additional studies. Further, a search within grey literature for global reports and other international binding commitments included the following organizations: African Development Bank, Asia-Pacific Association of Agricultural Research Institutions, Asian Development Bank, Bioversity International, Brookings Institute, Chatham House, Consultative Group on International Agricultural Research, Earth Commission, Food and Agriculture Organization, Global Forum on Agricultural Research, Inter-American Development Bank, International Center for Research in Agroforestry, International Food Policy and Research Institute, International Initiative for Impact Evaluation, International Labour Organization, The Organization for Economic Co-operation and Development, United Nations Environment Programme, United Nations Climate Change, World Bank, World Fish, World Policy Center, World Resources Institute and World Trade Organization. Titles and abstracts were screened, reviewed and extracted by one independent co-author using a data extraction tool developed by the lead author. The data extracted included specific details on how each target was set per indicator (that is, alignment with an international commitment or rights convention or theoretical minimum/maximum). Finally, we verified these targets through expert consultation with FSCI collaborators.
To set benchmarks at the global, regional and income levels for each indicator, we used the latest data point (between 2015–2024) of each country to calculate the unweighted mean of the best performing countries. For indicators where the desirable direction is lower values, this equated to the mean values of countries within the 20th percentile, while for indicators where higher is the desirable direction, this equated to the mean values of countries within the 80th percentile. The mean of the top 20% (or bottom 20%) of the distribution provides a more stable and representative measure of the upper and lower tail than a single percentile point, as it smooths extreme values. In addition, the mean of the 80th percentile or 20th percentile is considerably more stable over time than a single percentile point, which is especially relevant for updating benchmarks in the future. We set one global benchmark per indicator and used UN continental regions (Africa, Americas, Asia, Europe and Oceania) to set five regional benchmarks per indicator and World Bank country income groups (low, lower-middle, upper-middle and high) to set four income benchmarks per indicator. UN continental regions were used to ensure the regional benchmark calculations included a sufficient number of countries for meaningful comparison. For all benchmark calculations, the years of the latest data point ranged between 2015 and 2024. There is one exception to note. We excluded a global benchmark for share of agricultural value in Gross Domestic Product (GDP), as this share normally becomes smaller as income grows and economies become more diversified, but there is no specific desirable value for it.
Through consultation with the authors in each working group, we omitted 15 indicators from the global FSCI framework in this analysis, as measuring progress towards a static or relative reference point did not make conceptual sense (for example, all binary and categorical variables (guarantees for public access to information, presence of health-related food environment policies, degree of legal recognition to the right to food and presence of a national food system transformation pathway), cereals emissions intensity, cost of a healthy diet and the ratio of total damages of all disasters to GDP) or there were insufficient data for meaningful results (for example, percentage of the urban population living in cities signed onto the Milan Urban Food Policy Pact and the number of plant and animal genetic resources for food and agriculture secured in either medium- or long-term conservation facilities). In addition, yield indicators were excluded for two main reasons. First, yield targets are not meaningful at the global or even national level, as theoretical maximum yields vary on the basis of more local environmental conditions, or for broad food product groups, as changes in the composition of products within the group can artificially change yields. Second, although higher yields are better ceteris paribus, yield represents only one pathway for improving environmental performance. To understand progress towards environmental goals, yield would need to be considered in combination with other measures such as resource inputs and total production.
Performance metrics
To ensure the effectiveness of transforming food systems, a comprehensive assessment of progress towards achieving global targets and global, regional and income benchmarks was conducted using three metrics
First, for each indicator, we calculated directional distances from a country’s most recent value to each reference point in the indicator’s units, where positive values indicate performance above the target or benchmark and negative values indicate performance below. For indicators where lower is better, the signs are reversed such that positive still indicates better performance. We retained the actual distance values for countries that exceeded targets or benchmarks, to preserve the full distribution of country performance and provide an accurate representation of average progress towards goals. The distance to each reference point from all countries available was then averaged at a global, regional and income level.
Second, for each indicator, we calculated the performance of countries in either (1) meeting the global target by 2030 and 2050 or (2) in cases where no global target is available, we imputed meeting the global benchmark by 2030 and 2050, using adapted methodology from the 2024 SDGs Technical Note for Progress Assessment31. The two timescales were selected on the basis of their alignment with SDGs and mid-century climate targets (net-zero emissions). For indicators with a global target (n = 32) or global benchmark (n = 18), we computed a historical trend using two available global data points for each country between 2015 and 2024 (one for the baseline (vb) and one for the latest year (vt)). The trend is calculated on the basis of the actual compound annual growth rate (CAGRa) between the baseline year (b) and the latest year (t) for which data are available
$${mathrm{CAGR}}_{{rm{a}}}={left(frac{{v}_{t}}{{v}_{b}}right)}^{frac{1}{t-b}}.$$
(1)
Using the CAGRa from the previous step, we extrapolated the expected value (v2030e and v2050e) for the series in 2030 and 2050, assuming that the current rate of progress is maintained
$$,{v}_{2030{rm{e}}}={v}_{t}times {(1+{mathrm{CAGR}}_{{rm{a}}})}^{2030-t},$$
(2)
$$,{v}_{20350{rm{e}}}={v}_{t}times {(1+{mathrm{CAGR}}_{{rm{a}}})}^{2050-t}.$$
(3)
Finally, we assigned a progress assessment for each country on the basis of the progress ratio (Extended Data Table 3), using the country’s latest data point value and expected value derived in equations (2) and (3). Each country is categorized as being on target or target met (>0.95), moderate progress (0.50–0.95), marginal progress (0.10–0.50), stagnating progress (0–0.10) or regressing progress (<0). We excluded countries with insufficient temporal data, such as those that may have met global targets or benchmarks before 2015 or currently have one data point between 2015 and 2024 and therefore lack the minimum data points needed to calculate a trend. While this approach ensures robust trend-based classifications, it may underestimate the true number of countries currently achieving targets, particularly for indicators where some countries have successfully met targets and subsequently reduced data collection frequency. Importantly, the historical assessment is only conducted at a global level to 2030 and 2050, as per guidance from the SDG technical note. We did not conduct these assessments at regional or income levels.
Third, for each indicator, we calculated the required compound annual percentage change for each country to meet each reference point by 2030 and 2050, on the basis of a projected trajectory, using two distinct methods. The simplistic method used equation (1), whereby the beginning value (vb) was the latest data point for each country and the end value (vt) was the reference point value. The comprehensive method used equation (1), whereby the beginning value (vb) was an exponential moving average (EMA) for each country and the end value (vt) was the reference point value. We used the following formula for the EMA:
$${mathrm{EMA}}_{t}=alpha times {x}_{t}+left(1-alpha right)times {mathrm{EMA}}_{t-1},$$
(4)
where xt is the observed value at time t, EMAt−1 is the previous smoothed value and α is the smoothing parameter, which we set at 0.5, giving equal weight to the current and previous values. Importantly, for indicators with target values of 0, we substituted 0.005 to ensure a nonzero numerator. For both the simplistic and comprehensive method, we used the latest data year as the baseline year and the end year of 2030 or 2050
We present the comprehensive method as the main results because it gives more weight to recent data points and smooths out short-term fluctuations while retaining longer-term trends. In addition, it is more robust than using the simplistic method that only considers the latest data point. For all regional and income averages, we did not limit our analysis to a specific timeframe. Therefore, all countries were considered, even if the latest data year varied by country. The number of countries used in each regional average are presented in Supplementary Tables 12 and 13. A sensitivity analysis between the two methods is presented in Supplementary Table 14.
For indicators that already consider a rolling average in their underlying data (that is, prevalence of undernourishment, food insecurity, food supply variability, social protection coverage, social protection adequacy, All-5, minimum dietary diversity for women, minimum dietary diversity for children, NCD-Protect, NCD-Risk, soft drink consumption, zero fruits and vegetables adult, zero fruits and vegetables child, child labour, female landholding and reduced coping strategies), we selected the midpoint year to use as the published year. For one indicator, cropland change, a required progress assessment to the global, regional and income benchmarks could not be produced, as the benchmark value was negative. Finally, for countries already meeting or exceeding targets or benchmarks, we set the required compound annual growth rate to zero, indicating no further progress was needed to maintain their current achievement.
Reporting summary
Further information on research design is available in the Nature Portfolio Reporting Summary linked to this article
Data availability
Use of any materials in the GitHub repository are subject to a CC-BY-NC-SA 4.0 (non-commercial, share alike) license. Data are availablerd.org/ and in research dataset formatPerformance_Replication
Code availability
Replication code for this paper is availablePerformance_Replication
References
Making Food Systems Work for People and Planet UN Food Systems Summit +2 (United Nations Secretary-General, 2023); https://www.unfoodsystemshub.org/docs/unfoodsystemslibraries/stocktaking-moment/un-secretary-general/sgreport_en_rgb_updated_compressed.pdf?sfvrsn=560b6fa6_33
National Pathways Analysis Dashboard (United Nations Food Systems Hub, 2024); https://www.unfoodsystemshub.org/en
Neufeld, L. M. et al. Food systems interventions for nutrition: lessons from 6 program evaluations in Africa and South Asia. J. Nutr.154, 1727–1738 (2024)
Fanzo, J. et al. Viewpoint: rigorous monitoring is necessary to guide food system transformation in the countdown to the 2030 global goals. Food Policy104, 102163 (2021)
Schneider, K. R. et al. The state of food systems worldwide in the countdown to 2030. Nat. Food4, 1090–1110 (2023)
Schneider, K. R. et al. Governance and resilience as entry points for transforming food systems in the countdown to 2030. Nat. Food6, 105–116 (2025)
Herforth, A. et al. Diagnosing the performance of food systems to increase accountability toward healthy diets and environmental sustainability. PLoS ONE17, e0270712 (2022)
Liu, Y. et al. Overlooked uneven progress across sustainable development goals at the global scale: challenges and opportunities. Innovation5, 100573 (2024)
van Vuuren, D. P. et al. Defining a sustainable development target space for 2030 and 2050. One Earth5, 142–156 (2022)
Zhao, W. et al. Achieving the Sustainable Development Goals in the post-pandemic era. Humanit. Soc. Sci. Commun.9, 258 (2022)
The World in 2050. Transformations to Achieve the Sustainable Development Goals (International Institute for Applied Systems Analysis, 2018)
Jaeger, J. et al. Methodology Underpinning the Systems Change Lab Platform (Systems Change Lab, 2024)
Austin, C. et al. A framework for identifying and learning from countries that demonstrated exemplary performance in improving health outcomes and systems. BMJ Glob. Health5, e002938 (2020)
Increase Agricultural Productivity Sustainably, Resiliently and Without Expanding into High-Carbon, Biodiverse Ecosystems (Systems Change Lab, 2025); https://systemschangelab.org/food-and-agriculture/increase-productivity-sustainably
Pathways to Sustainable Land-Use and Food Systems. 2020 Report of the FABLE Consortium (IIASA and SDSN, 2020)
Sustainable Development Goals Data Indicator Portal: Indicator 2.4.1 Proxy – Progress Towards Productive and Sustainable Agriculture (FAO, 2025); https://www.fao.org/sustainable-development-goals-data-portal/data/indicators/indicator-241-proxy-progress-towards-productive-and-sustainable-agriculture/en
Blesh, J., Hoey, L., Jones, A. D., Friedmann, H. & Perfecto, I. Development pathways toward ‘zero hunger’. World Dev.118, 1–14 (2019)
The Future of Food and Agriculture—Alternative Pathways to 2050 (FAO, 2018)
Renaud, F. G., Zhou, X., Bosher, L., Barrett, B. & Huang, S. Synergies and trade-offs between sustainable development goals and targets: innovative approaches and new perspectives. Sustain. Sci.17, 1317–1322 (2022)
Burgaz, C. et al. Which government policies to create sustainable food systems have the potential to simultaneously address under nutrition, obesity and environmental sustainability? Global. Health20, 56 (2024)
Macdiarmid, J. I. et al. Developing a timeline for evaluating public health nutrition policy interventions. What are the outcomes and when should we expect to see them? Public Health Nutr.14, 729–739 (2011)
Pearce-Higgins, J. W. et al. A framework for climate change adaptation indicators for the natural environment. Ecol. Indic.136, 108690 (2022)
Jakob, M. Why carbon leakage matters and what can be done against it. One Earth4, 609–614 (2021)
Steininger, K. W., Lininger, C., Meyer, L. H., Muñoz, P. & Schinko, T. Multiple carbon accounting to support just and effective climate policies. Nat. Clim. Change6, 35–41 (2016)
Frank, S. et al. Structural change as a key component for agricultural non-CO2 mitigation efforts. Nat. Commun.9, 1060 (2018)
Ruggeri Laderchi, C., et al. The Economics of the Food System Transformation (FSEC, 2024)
Candel, J., Sietsma, A. J. & Biesbroek, R. National pathways for food systems transformation are limited in scope and degree of ambition. Nat. Food6, 809–816 (2025)
Indicator definitions. Global Diet Quality Projecthttps://www.dietquality.org/indicators/definitions (2025)
Domain Emissions Totals. Methodological Note (Food and Agriculture Organization, 2023); https://files-faostat.fao.org/production/GT/GT_en.pdf
Greenhouse Gas Emissions from Agrifood Systems. Global, Regional and Country Trends, 2001–2023 (Food and Agriculture Organization, 2025); https://openknowledge.fao.org/handle/20.500.14283/cd7300en
Sustainable Development Goal Report. Technical Note for Progress Assessment (United Nations, 2024); https://unstats.un.org/sdgs/files/report/2024/Technical_Note_for_Progress_Assessment_2024.pdf
Acknowledgements
We thank G. Yenokyan and E. Westlund for their statistical support provided in the initial analyses. We thank M. Schuster, C. Hawkes, M. Sanchez, H. Gerits, H. Muñoz and N. Wanner for inputs provided during the Food Systems Countdown Initiative to 2030 (FSCI) Rome meeting held 29–30 October 2024 as well as A. Rub, J. Feng and O. Lavagne d’Ortigue who reviewed code and final outputs. We also thank all the data providers who facilitated access to data including D. Piovani at the World Food Programme, the collaborators of the Global Diet Quality Project and the Secretariat of the Milan Urban Food Policy Pact.
Funding
This study was supported by GAIN Nourishing Food Pathways programme, jointly funded by the German Federal Ministry for Economic Cooperation and Development, the Ministry of Foreign Affairs of the Netherlands, the European Union, the government of Canada through Global Affairs Canada, Irish Aid through the Development Cooperation and Africa Division and the Swiss Agency for Development and Cooperation of the Federal Department of Foreign Affairs to B.C., K.S.L., S.N., T.B. and R.M. B.C. was supported by Columbia Climate School. All other authors did not receive funding for this work and were supported by their home institutions.
Author information
Authors and Affiliations
Columbia Climate School, New York, NY, USA
Bianca Carducci & Krishna Arunkumar
School of Sustainability, Arizona State University, Tempe, AZ, USA
Kate Schneider Lecy
The Global Alliance for Improved Nutrition, Geneva, Switzerland
Stella Nordhagen & Lawrence Haddad
The Global Alliance for Improved Nutrition, Washington, DC, USA
Ty Beal & Rebecca McLaren
The Alliance of Bioversity International and the International Center for Tropical Agriculture (CIAT), Cali, Colombia
Christophe Béné, Ramya Ambikapathi, Fabrice DeClerck, Gina Kennedy & Roseline Remans
Wageningen Economic Research Group, Wageningen University, Wageningen, the Netherlands
Christophe Béné
College of Agriculture and Life Sciences, Cornell University, Ithaca, NY, USA
Carlos Gonzalez Fischer & Mario Herrero
Cornell Atkinson Center for Sustainability, Cornell University, New York, NY, USA
Carlos Gonzalez Fischer & Mario Herrero
Division of Human Nutrition and Health, Wageningen University, Wageningen, the Netherlands
Anna Herforth
Food and Agriculture Organization of United Nations, Rome, Italy
Francesco N. Tubiello, Inmaculada del Pino Álvarez, Nancy Aburto, Carlo Cafiero, Piero Conforti, Andrea Cattaneo, Carola Fabi, Preetmoninder Lidder, Maximo Torero Cullen & José Rosero Moncayo
CARE, Geneva, Switzerland
Christine Campeau
Centro Euro-Mediterraneo sui Cambiamenti Climatici, Venice, Italy
Shouro Dasgupta
Grantham Research Institute on Climate Change and the Environment, London School of Economics and Political Science, London, UK
Shouro Dasgupta
EAT Forum, Oslo, Norway
Fabrice DeClerck
World Benchmarking Alliance, Amsterdam, the Netherlands
Alejandro Guarín
Cameroon Country Office, World Food Programme, Yaoundé, Cameroon
Jose Luis Vivero-Pol
Nutrition and Health Research Center, National Institute of Public Health, Cuernavaca, Mexico
Simón Barquera
University of Cape Town, Rondebosch, South Africa
Jane Battersby
University of Montpellier, Montpellier, France
Patrick Caron
Cirad, Montpellier, France
Patrick Caron
Actors, Rentpellier, France
Patrick Caron
International Livestock Research Institute, Addis Ababa, Ethiopia
Namukolo Covic
CGIAR, Montpellier, France
Ismahane Elouafi
School of Aquatic and Fishery Sciences, University of Washington, Seattle, WA, USA
Jessica A. Gephart
Washington State University, Pullman, WA, USA
Alexander Fremier
Regional Bureau for Latin America and the Caribbean, World Food Programme, Panama, Panama
Pat Foley
Harvard T.H. Chan School of Public Health, Boston, MA, USA
Christopher D. Golden
Natural Re
Sheryl L. Hendriks
School of Advanced Agricultural Sciences, Peking University, Beijing, China
Jikun Huang
School of Public Health, University of Ghana, Accra, Ghana
Amos Laar
CFAES Rattan Lal Center for Carbon Management and Sequestration, The Ohio State University, Columbus, OH, USA
Rattan Lal
World Wildlife Fund, Washington, DC, USA
Brent Loken
International Food Policy Research Institute, Washington, DC, USA
Hazel Malapit, Quinn Marshall, Danielle Resnick & Keith Wiebe
Paul G. Allen Family Foundation, Seattle, WA, USA
Yuta J. Masuda
Glocolearning, Brussels, Belgium
Roseline Remans
European Commission, Joint Research Centre, Ispra, Italy
Michaela Saisana
School of Public Policy and Global Affairs, University of British Columbia, Vancouver, British Columbia, Canada
U. Rashid Sumaila
Friedman School of Nutrition Science and Policy, Tufts University, Boston, MA, USA
Patrick Webb
School of Advanced International Studies, Johns Hopkins University, Bologna, Italy
Jessica Fanzo
Authors
- Bianca CarducciView author publications
Search author on:PubMed Google Scholar
- Kate Schneider LecyView author publications
Search author on:PubMed Google Scholar
- Stella NordhagenView author publications
Search author on:PubMed Google Scholar
- Ty BealView author publications
Search author on:PubMed Google Scholar
- Christophe BénéView author publications
Search author on:PubMed Google Scholar
- Carlos Gonzalez FischerView author publications
Search author on:PubMed Google Scholar
- Anna HerforthView author publications
Search author on:PubMed Google Scholar
- Francesco N. TubielloView author publications
Search author on:PubMed Google Scholar
- Ramya AmbikapathiView author publications
Search author on:PubMed Google Scholar
- Krishna ArunkumarView author publications
Search author on:PubMed Google Scholar
- Christine CampeauView author publications
Search author on:PubMed Google Scholar
- Shouro DasguptaView author publications
Search author on:PubMed Google Scholar
- Fabrice DeClerckView author publications
Search author on:PubMed Google Scholar
- Inmaculada del Pino ÁlvarezView author publications
Search author on:PubMed Google Scholar
- Alejandro GuarínView author publications
Search author on:PubMed Google Scholar
- Rebecca McLarenView author publications
Search author on:PubMed Google Scholar
- Jose Luis Vivero-PolView author publications
Search author on:PubMed Google Scholar
- Nancy AburtoView author publications
Search author on:PubMed Google Scholar
- Simón BarqueraView author publications
Search author on:PubMed Google Scholar
- Jane BattersbyView author publications
Search author on:PubMed Google Scholar
- Carlo CafieroView author publications
Search author on:PubMed Google Scholar
- Piero ConfortiView author publications
Search author on:PubMed Google Scholar
- Patrick CaronView author publications
Search author on:PubMed Google Scholar
- Andrea CattaneoView author publications
Search author on:PubMed Google Scholar
- Namukolo CovicView author publications
Search author on:PubMed Google Scholar
- Ismahane ElouafiView author publications
Search author on:PubMed Google Scholar
- Carola FabiView author publications
Search author on:PubMed Google Scholar
- Jessica A. GephartView author publications
Search author on:PubMed Google Scholar
- Alexander FremierView author publications
Search author on:PubMed Google Scholar
- Pat FoleyView author publications
Search author on:PubMed Google Scholar
- Christopher D. GoldenView author publications
Search author on:PubMed Google Scholar
- Sheryl L. HendriksView author publications
Search author on:PubMed Google Scholar
- Jikun HuangView author publications
Search author on:PubMed Google Scholar
- Gina KennedyView author publications
Search author on:PubMed Google Scholar
- Amos LaarView author publications
Search author on:PubMed Google Scholar
- Rattan LalView author publications
Search author on:PubMed Google Scholar
- Preetmoninder LidderView author publications
Search author on:PubMed Google Scholar
- Brent LokenView author publications
Search author on:PubMed Google Scholar
- Hazel MalapitView author publications
Search author on:PubMed Google Scholar
- Quinn MarshallView author publications
Search author on:PubMed Google Scholar
- Yuta J. MasudaView author publications
Search author on:PubMed Google Scholar
- Roseline RemansView author publications
Search author on:PubMed Google Scholar
- Danielle ResnickView author publications
Search author on:PubMed Google Scholar
- Michaela SaisanaView author publications
Search author on:PubMed Google Scholar
- U. Rashid SumailaView author publications
Search author on:PubMed Google Scholar
- Maximo Torero CullenView author publications
Search author on:PubMed Google Scholar
- Patrick WebbView author publications
Search author on:PubMed Google Scholar
- Keith WiebeView author publications
Search author on:PubMed Google Scholar
- José Rosero MoncayoView author publications
Search author on:PubMed Google Scholar
- Jessica FanzoView author publications
Search author on:PubMed Google Scholar
- Mario HerreroView author publications
Search author on:PubMed Google Scholar
Contributions
All authors contributed to multiple aspects of the study, including conceptualization (input from all), methodology (B.C., K.S.L., S.N., T.B., C.B., C.G.F., A.H., F.N.T., R.A., C. Campeau, S.D., F.D., I.d.P.A., A.G., R.M. and J.L.V.-P.), literature review (B.C. and K.A.), project administration (B.C.), formal analysis (B.C.), visualization of the results (B.C.), data updates (K.S.L.), writing of the original draft (B.C.), review and editing of the paper (all authors), and funding acquisition (J.F., L.H., M.H. and J.R.M.). J.F., L.H., M.H. and J.R.M. jointly supervised this work.
Ethics declarations
Competing interests
L.H., M.H., J.R.M. and J.F. are co-chairs of the FSCI, co-led by the Global Alliance for Improved Nutrition (GAIN), the Food and Agriculture Organization of the United Nations, Cornell University and Johns Hopkins University. The findings, ideas and conclusions presented here are those of the authors and do not necessarily reflect the positions or policies of any of GAIN’s funding partners or of United Nations member states. The other authors declare no competing interests
Peer review
Peer review information
Nature Food thanks Peter Alexander, Kevin Karl and Jessica Zionts for their contribution to the peer review of this work. Peer reviewer reports are available
Additional information
Publisher’s note Springer Nature remains neutral with regard to jurisdictional claims in published maps and institutional affiliations
Extended data
Supplementary information
Supplementary Information (download PDF )
Supplementary Tables 1–14 and Figs. 1–51
Reporting Summary (download PDF )
Peer Review File (download PDF )
Supplementary Data 1 (download XLSX )
Supplementary metadata
Supplementary Data 2 (download CSV )
Supplementary dataset
Supplementary Data 3 (download CSV )
Supplementary dataset
Rights and permissions
Open Access This article is licensed under a Creative Commons Attribution-NonCommercial-NoDerivatives 4.0 International License, which permits any non-commercial use, sharing, distribution and reproduction in any medium or format, as long as you give appropriate credit to the original author(s) and the source, provide a link to the Creative Commons licence, and indicate if you modified the licensed material. You do not have permission under this licence to share adapted material derived from this article or parts of it. The images or other third party material in this article are included in the article’s Creative Commons licence, unless indicated otherwise in a credit line to the material. If material is not included in the article’s Creative Commons licence and your intended use is not permitted by statutory regulation or exceeds the permitted use, you will need to obtain permission directly from the copyright holder. To view a copy of this licence, visit http://creativecommons.org/licenses/by-nc-nd/4.0/.
About this article
Cite this article
Carducci, B., Schneider Lecy, K., Nordhagen, S. et al. Food systems performance evaluated against targets and benchmarks reveals urgent gaps and a path to 2050.
Nat Food (2026). https://doi.org/10.1038/s43016-026-01379-0
Received:28 July 2025
Accepted:04 June 2026
Published:10 August 2026
Version of record:10 August 2026
DOI
:https://doi.org/10.1038/s43016-026-01379-0
