


Download PDF
Abstract
Birth-order effects on disease risk have been studied for individual conditions but have not been systematically assessed at phenome-wide scale in large sibling claims cohorts. We apply two complementary designs, a between-family matched cohort (1.6 million pairs) as a high-powered phenome-wide scan, and a within-family sibling comparison (5.1 million families) as an internally controlled sibling contrast, to 569 diseases in Merative MarketScan claims data. Of 418 diseases with adequate case counts, 150 show Bonferroni-significant associations. First-borns carry excess risk for neurodevelopmental conditions (other/unspecified pervasive-developmental-disorder (PDD) code group odds ratio (OR) = 0.57, autism OR = 0.74, attention-deficit/hyperactivity disorder OR = 0.93) and immune-allergic diseases (food allergy OR = 0.80, allergic rhinitis OR = 0.91); second-borns for substance abuse (OR = 1.19) and gastrointestinal conditions (gastritis/duodenitis OR = 1.14). Across diseases analyzed in both designs, between-family and within-family estimates were positively correlated (r = 0.66; 74.2% directionally concordant); 84.7% of Bonferroni-significant between-family hits agreed in direction. Results are robust to state fixed effects (r > 0.99), full-sibling restriction and stricter clinical rematching (r = 0.93). These findings provide a comprehensive map of birth-order effects in the human disease phenome.
Subjects
- Allergy
- Migraine
- Risk factors
The birth order, defined as the ordinal position of a child among siblings, has fascinated researchers for more than a century1,2. Theorists in the early years proposed that first-borns receive greater parental investment and face higher expectations, while later-borns develop in the immunological and social wake of their older siblings3,4. These ideas have generated a rich but fragmented empirical literature, with individual studies examining birth order in relation to specific diseases or developmental outcomes.
The most influential disease-specific finding concerns allergic and atopic conditions. Strachan’s original household-size observation proposed that younger siblings, owing to greater microbial exposure from older siblings during early life, develop stronger immune tolerance and lower allergy risk5. Subsequent studies confirmed the protective effects of subsequent birth order for hay fever, eczema and asthma6,7,8,9. The mechanistic understanding has since evolved: the ‘old-friends’ hypothesis emphasizes that early exposure to diverse commensal and environmental microorganisms, rather than pathogenic infections per se, is critical for immune regulatory development10,11,12.
A separate literature has examined birth order and neurodevelopmental conditions. Large Scandinavian registry studies observed that first-borns show slightly higher educational attainment and IQ, potentially reflecting differential parental investment13,14,15. For autism, the relationship with birth order is complicated by reproductive stoppage or the tendency of parents to reduce the rate of childbearing after a diagnosis. This can create artifactual first-born enrichment16,17. Interpretation is also complicated by parental-age effects, particularly the association between advanced parental age and autism risk18. Birth order has also been associated with psychiatric conditions and childhood mental health outcomes19, as well as metabolic diseases20.
Despite this extensive literature, three limitations have impeded progress. First, nearly all studies examine a single disease or a small cluster, precluding systematic comparison of effect sizes across organ systems. Second, many existing designs have limited ability to separate birth-order associations from factors that covary with birth order, including parental age, family size, socioeconomic status and secular diagnostic trends21,22. Third, sample sizes have often been too small for precise estimation, particularly for rarer conditions.
In this study, we address these limitations using a cohort of over 10 million individuals from 5.1 million two-child families in the Merative MarketScan commercial claims dataset. We use two complementary analytical designs: a between-family matched cohort used as a high-powered phenome-wide scan after adjustment for measured demographic, geographical, parental-age, follow-up and clinical covariates; and a within-family sibling comparison using conditional logistic regression as an internally controlled contrast that mitigates confounding by factors shared within families23,24. We tested 569 diseases, applying sensitivity analyses, including state fixed effects, full-sibling restriction and a stricter clinically enriched rematching analysis, and validate our approach with prespecified positive and negative control diseases.
Results
Study design and cohort
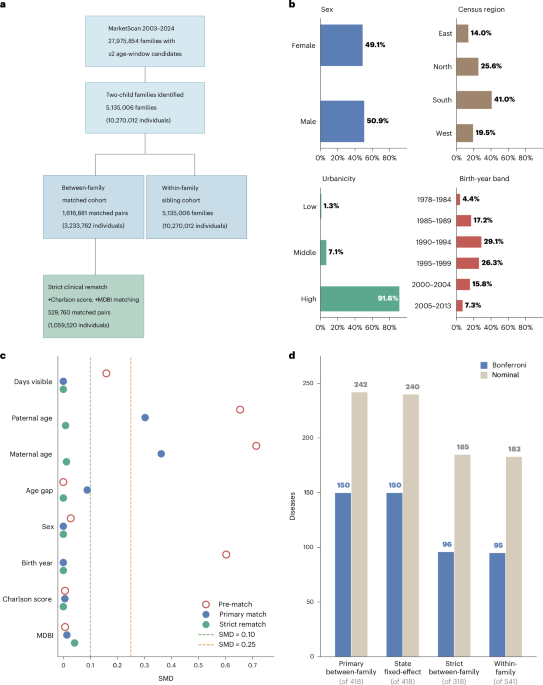
We screened 27,975,854 Merative MarketScan 2003–2024 families with at least two age-window candidate members and identified 5,135,006 two-child families (10,270,012 individuals) meeting our eligibility criteria: at least one inferred parent, exactly two non-parent children, each with 365 or more days of enrollment visibility and age at last observation of 12 years and older (Fig. 1a and Table 1). For family-size context before parent inference and individual eligibility filtering, 66,054,423 family identifiers contained at least one age-window candidate member; 57.6% contained one, 24.7% contained two, 10.8% contained three, 4.6% contained four and 2.2% contained five or more. Among the 27,975,854 family identifiers with at least two valid-sex and birth-year candidate children, 58.3% had two candidate children and 41.7% had three or more.
a, Sample sizes for the three analytical cohorts: the primary between-family matched cohort (n = 3.2 million individuals in 1.6 million matched pairs), the stricter clinically matched between-family cohort (n = 1.1 million individuals in 529,760 pairs) and the within-family sibling comparison cohort (n = 5.1 million families, one sibling pair per family). b, Demographic composition of the underlying two-child family cohort (n = 10,270,012 individuals from 5,135,006 families) according to sex, census region, urbanization level and birth-year band; the bars show the percentage of the cohort in each category. c, Covariate balance assessment showing absolute SMDs for shared matching variables before matching (pre-match), after primary between-family matching and after stricter clinical rematching. Each marker is the SMD point estimate for one covariate at one matching stage (pre-match, primary match or strict rematch), with pre-match values plotted as open circles and the primary-match and strict-rematch values as filled markers; the three stage markers for a covariate are not connected by any line. No error bars are shown because each SMD is a single point estimate computed across all matched pairs. SMDs were derived from n = 1,616,881 primary matched pairs and n = 529,760 strict clinical rematch pairs, with pre-match values computed from the full eligible cohort. The dashed reference line marks an SMD = 0.10, the conventional balance threshold; the secondary reference at SMD = 0.25 indicates the more permissive threshold used in some prior matching literature. d, Number of diseases reaching Bonferroni and nominal significance across the four primary analytical designs; the number of diseases tested is indicated below each bar (n = 418 primary between-family, 418 state fixed-effects, 318 strict clinical rematch and 541 within-family).
Source data
For the between-family analysis, we identified 1,616,881 matched sibling pairs by pairing a first-born from one family with a second-born from a different family, matched exactly on sex, birth year and urbanization tertile, with calipers on follow-up duration (± 50 days), paternal age (± 10 years), maternal age (± 10 years), and sibling age gap (± 2 years). After matching, standardized mean differences (SMDs) improved for all covariates (Fig. 1c). The strict clinical rematch further reduced the imbalance for parental-age and clinical baseline variables, while a separate within-family cohort of 5.1 million families was used for sibling comparisons. The underlying cohort was predominantly from high-urbanicity areas, drawn from across all four census regions, with birth years spanning 1978–2013 (Fig. 1b).
For the within-family analysis, we used all 5,135,006 cohort families directly, comparing the first-born to the second-born within each family using conditional logistic regression stratified on family identifier. This design reduces confounding by factors shared between siblings (for example, parental genetics, household socioeconomic status, geographical exposures, family health attitudes), at the cost of being powered only by disease-discordant sibling pairs25
Signal yields across the four analytical designs are summarized in Fig. 1d: the primary between-family design detected 150 Bonferroni-significant and 242 nominally significant diseases; the state fixed-effects specification, the stricter clinical rematch and the within-family design each produced broadly consistent counts
Throughout, odds ratios (ORs) compare second-borns with first-borns: an OR below 1 denotes lower risk in second-borns (equivalently, increased first-born risk; ‘first-born excess’), whereas an OR above 1 denotes increased risk in second-borns (‘second-born excess’). Birth-order associations run in both directions across the phenome
Phenome-wide birth-order atlas
To display the Bonferroni-significant birth-order associations that were also Bonferroni-significant and directionally concordant in the within-family analysis, we constructed a disease atlas organized according to clinical domain (Fig. 2 and Extended Data Fig. 1). In this atlas, each disease tile is colored according to the direction and magnitude of the birth-order effect, with blue indicating first-born excess and red indicating second-born excess. Tile color intensity is proportional to the absolute effect size ((| {mathrm{log}}_{2}(mathrm{OR})|)); only diseases reaching Bonferroni significance in both the primary between-family and within-family analyses with concordant direction are displayed.
Each tile represents a disease reaching Bonferroni significance in both the primary between-family and within-family analyses with concordant effect direction, organized according to clinical domain (rows) and ordered according to the primary between-family effect size within each domain. Tile color indicates the direction and magnitude of the birth-order effect: blue denotes first-born excess (OR < 1) and red denotes second-born excess (OR > 1), with color intensity proportional to (| {mathrm{log}}_{2}(mathrm{OR})|). The five domains displayed are neuropsychiatric, neurological, infectious, musculoskeletal and circulatory. Each tile is a single disease; the unit of analysis is the individual person, matched into sibling pairs in the between-family cohort (n = 1,616,881 matched pairs) and grouped within families in the within-family cohort (n = 5,135,006 families, one sibling pair per family), with independent persons/families and no biological or technical replicates. Tiles encode OR point estimates; no error bars are shown because each tile is a single point estimate derived over these large cohorts. Per-disease case counts (n) and ORs for both designs are provided in Supplementary Table 8. STI, sexually transmitted infection.
Source data
The atlas across five key domains (Fig. 2) reveals that first-born excess is concentrated in the neuropsychiatric domain, whereas second-born excess is prominent in musculoskeletal, infectious and neurological diseases. Within the neuropsychiatric domain, first-born excess is observed across a broad diagnostic spectrum from the other/unspecified PDD code group and tics/Tourette syndrome (strongest effects, (| {mathrm{log}}_{2}(mathrm{OR})| > 0.5)) through autism, obsessive-compulsive disorder (OCD) and attention-deficit/hyperactivity disorder (ADHD) to milder effects such as anxiety, eating disorders and depression, while substance abuse is a notable exception with second-born excess.
The expanded atlas across all displayed clinical domains (Extended Data Fig. 1) additionally reveals dermatological first-born excess (acne, hirsutism, seborrheic dermatitis), respiratory associations (first-born excess for asthma and allergic rhinitis), endocrine and metabolic associations (first-born excess for lipid metabolism disorders and pubertal dysfunction, second-born excess for electrolyte/acid–base disorders), digestive second-born excess (gastritis and duodenitis, irritable bowel syndrome, appendiceal and esophageal disease) and musculoskeletal second-born excess concentrated in joint connective tissue conditions.
Domain-level summary
The distribution of significant birth-order effects across the 15 noncongenital/non-injury clinical domains displayed in the domain-level visualization is summarized in Extended Data Fig. 2. The atlas in Extended Data Fig. 1 displays 75 concordant Bonferroni-significant diseases across 14 clinical domains. The neuropsychiatric domain contributed the largest number of significant associations, with a striking predominance of first-born excess (Extended Data Fig. 2a). Dermatological and sense organ categories also showed predominantly first-born excess. In contrast, digestive, musculoskeletal, genitourinary, circulatory and infectious disease domains were enriched for second-born excess. Several domains, including respiratory and endocrine and metabolic, showed mixed directionality.
Within-domain effect size distributions (Extended Data Fig. 2b) reveal that the neuropsychiatric domain shows the widest spread of effect sizes, with median effects shifted toward first-born excess. The digestive and musculoskeletal domains show median effects that have shifted toward second-born excess. Most domains have median effects close to null, reflecting a mixture of excess diseases from the first-born and second-born within each category. To quantify domain-level clustering rather than relying only on visual inspection, we fitted an empirical-Bayes partial-pooling model to disease-level log-ORs and standard errors within each design (Extended Data Fig. 3). The strongest domain-level first-born shift was in the neuropsychiatric and behavioral domain, with pooled ORs of 0.902 (95% confidence interval (CI) 0.875–0.930) in the primary between-family scan, 0.914 (0.883–0.945) in the strict rematch and 0.937 (0.919–0.956) in the within-family design. Dermatological associations also showed consistent first-born shifts across between-family and within-family analyses. By contrast, digestive, genitourinary and reproductive, and musculoskeletal domains showed second-born shifts in the between-family analyses that were weaker in the within-family design.
Phenome-wide landscape
We defined 569 diseases using established International Classification of Diseases, Ninth Revision, Clinical Modification (ICD-9-CM) and International Classification of Diseases, Tenth Revision, Clinical Modification (ICD-10-CM) code groupings. Of these, 418 had 500 or more cases in the matched cohort and were included in the between-family analysis. Logistic regression adjusted for sibling age spacing, age at last observation, sex, parental ages, parental psychiatric history, urbanization, county (via clustered standard errors), ICD coding era, enrollment time and a full-sibling consistency flag.
Of these 418 diseases, 150 (35.9%) reached Bonferroni significance (P < 1.20 × 10⁻⁴) and 226 (54.1%) reached significance after Benjamini–Hochberg false discovery rate correction at q < 0.05. The landscape across the phenome (Fig. 3) displays all Bonferroni-significant diseases positioned according to prevalence and effect size, with the point size proportional to the number of cases and the colors denoting the category of the disease. Among the 150 Bonferroni-significant diseases, 79 showed first-born excess (OR < 1 for second-born) and 71 showed second-born excess (OR > 1); this deviation from a 50:50 split was not significant (exact binomial P = 0.568). The high rate of significant associations, together with the near-symmetric split between first-born and second-born excess, argues against a systematic bias inflating associations in one direction.
Each point represents one Bonferroni-significant disease in the primary between-family matched cohort, positioned according to disease prevalence (x axis, log-scale) and birth-order effect size ({log }_{2}({rm{OR}})) (y axis, second-born versus first-born). Point size scales with the number of observed cases and colors denote major disease categories (neuropsychiatric/behavioral, respiratory, dermatological, neurological, infectious, digestive and other). Labels highlight high-information diseases including autism, ADHD, tics/Tourette syndrome, OCD, allergic rhinitis, food allergy, asthma, acne, substance abuse, migraine and herpes zoster. The dashed horizontal line marks the null (({mathrm{log}}_{2}(mathrm{OR})=0)). Each point is a single per-disease OR point estimate (the unit of analysis is the individual person), derived from the primary between-family matched cohort (n = 1,616,881 matched sibling pairs; 3,233,762 individuals); no error bars are shown because each disease contributes one effect estimate computed over the full matched cohort. Per-disease case counts (n) and ORs are provided in Supplementary Table 8.
Source data
The landscape reveals that the largest effect sizes arise among rarer conditions: the other/unspecified PDD code group (prevalence < 1%, ({mathrm{log}}_{2}(mathrm{OR})approx -0.81)), tics/Tourette syndrome (({mathrm{log}}_{2}(mathrm{OR})approx -0.53)), autism (({mathrm{log}}_{2}(mathrm{OR})approx -0.44)) and OCD show pronounced first-born excess, while herpes zoster shows the strongest second-born excess (({mathrm{log}}_{2}(mathrm{OR})approx +0.43)). Among highly prevalent conditions, ADHD, allergic rhinitis, asthma and acne show modest but precisely estimated first-born excess, while substance abuse and migraine show second-born excess (Fig. 3).
Strongest birth-order associations
The strongest and most clinically recognizable associations, together with their stability across alternative models, are summarized in Fig. 4, Table 2 and Supplementary 1
Heatmap summarizing the direction and magnitude of birth-order effects for selected diseases across seven analytical specifications: four between-family (primary, strict match, state fixed effect, full-sibling) and three within-family (primary, period-only, full-sibling). Cell color shows ({mathrm{log}}_{2}(mathrm{OR})) (blue = first-born excess, red = second-born excess); filled circles indicate Bonferroni significance and open circles indicate nominal significance (P < 0.05). Diseases are grouped into two sections: first-born excess (top, from the other/unspecified PDD code group to atopic dermatitis) and second-born excess (bottom, from migraine to herpes zoster). The dashed vertical line separates between-family and within-family designs. Each cell is a single OR estimate (no error bars); the cell value is the point estimate, with uncertainty reported as CIs in the accompanying tables rather than as graphical error bars. The unit of analysis is the individual person (between-family specifications) or the matched sibling pair (within-family specifications), each an independent administrative-claim observation with no technical replicates. Per-disease case counts (n), ORs and CIs are provided in Table 2 and Supplementary Tables 1 and 8.
Source data
First-born disease risk excess was most pronounced for neurodevelopmental conditions: the other/unspecified PDD code group (OR = 0.569, 95% CI 0.552–0.587, P = 2.7 × 10−278), tics/Tourette syndrome (OR = 0.693, 95% CI 0.672–0.715, P = 4.0 × 10−116) and autism (OR = 0.737, 95% CI 0.714–0.760, P = 1.2 × 10−81). First-born excesses were also observed for food allergy (OR = 0.797, P = 9.7 × 10−73), acne (OR = 0.866, P < 10−300), anxiety/phobic disorder (OR = 0.889, P = 1.4 × 10−151) and allergic rhinitis (OR = 0.910, P = 5.4 × 10−97).
Because this leading phenotype carried the historical source label ‘unspecified childhood psychoses,’ we audited its ICD definition before interpreting it biologically. The implemented phenotype consists of ICD-9 299.8x/299.9x and ICD-10 F84.8/F84.9 codes, corresponding to other or unspecified PDD codes rather than schizophrenia-spectrum psychosis codes. It contributed 18,557 cases to the primary matched analysis and 5,002 cases to the strict clinical rematch. Across the broader cohort, this code group included 46,640 cases, of whom 20,603 (44.2%) also had an autism-spectrum-disorder phenotype in the current disease map, indicating substantial but incomplete phenotypic overlap with the autism signal. Therefore, we refer to this association as an other/unspecified PDD code-group signal; this relabeling clarifies phenotype interpretation but does not change the estimated birth-order association.
Second-born excess was strongest for herpes zoster (OR = 1.348, P = 4.7 × 10−100), substance abuse (OR = 1.192, P = 3.8 × 10−227), biliary tract disease (OR = 1.179, P = 6.2 × 10−70), gastritis and duodenitis (OR = 1.142, P = 4.3 × 10−85) and migraine (OR = 1.128, P = 2.3 × 10−107)
Within-family sibling comparison
We used conditional logistic regression (clogit) for the analysis of the within-family cohort. We adjusted for family-specific effects, birth cohort, age at last observation in the data, sex, length of enrollment, ICD coding era and calendar period of observation (5-year bins based on the midpoint of each child’s observation window). Of 569 diseases, 541 had 100 or more disease-discordant sibling pairs and were analyzed further. We fitted four model specifications per disease to assess robustness to age–period–cohort (APC) parametrization including (1) cohort-adjusted, (2) cohort plus calendar period, (3) period-only and (4) cohort with gap × birth-order interaction. The cohort-plus-period specification served as our primary within-family model (Supplementary Table 3).
The within-family results broadly corroborated the between-family findings. Among diseases significant in both designs, the direction and magnitude of birth-order effects were consistent: autism within-family OR = 0.804 (95% CI 0.786–0.823, P = 1.1 × 10−74), ADHD within-family OR = 0.936, food allergy within-family OR = 0.901 and substance abuse within-family OR = 1.141
Robustness across designs
We assessed the robustness of the key birth-order associations across seven analytical specifications spanning both between-family and within-family designs (Fig. 4). The robustness heatmap organizes diseases according to the direction and consistency of their effects, with four between-family columns (primary match, strict clinical rematch, state fixed effects and full-sibling restriction) and three within-family columns (primary, period-only and full-sibling models). The period-only within-family specification, which drops birth cohort and retains only calendar period, showed somewhat attenuated effects for several diseases, probably reflecting residual cohort confounding that is partially absorbed when the birth-year adjustment is omitted.
Among the diseases showing first-born excess, the other/unspecified PDD code group, tics/Tourette syndrome, autism, OCD, food allergy, acne, allergic rhinitis, ADHD and asthma reached Bonferroni significance across all or nearly all specifications, supporting strong robustness. Atopic dermatitis showed directional consistency but reached only nominal significance in most specifications
Among the diseases showing second-born excess, migraine, gastritis and duodenitis, biliary tract disease, substance abuse, kidney infection and herpes zoster were consistently significant. Herpes zoster showed the strongest and most consistent second-born excess effect across all seven designs
Cross-design concordance
Across all diseases informative in both designs, between-family and within-family ORs were positively correlated (Pearson r = 0.66, 74.2% directionally concordant; Extended Data Fig. 4a). Among the 150 Bonferroni-significant diseases in the primary between-family analysis, 127 (84.7%) showed the same direction of effect in the within-family analysis; 79 were also Bonferroni-significant in the within-family analysis. Of these 79 dual-significant diseases, 75 (94.9%) were directionally concordant. Among these 150 between-family hits, 110 (73.3%) were attenuated toward the null hypothesis in the within-family estimate. Therefore, we interpret the between-family design as a high-powered scan that can still contain residual between-family confounding, and the within-family design as the internally controlled complement that anchors interpretation when both designs agree.
The stricter clinical rematch produced highly concordant estimates with the primary between-family analysis (r = 0.93, 91% concordant, 92 Bonferroni-significant diseases overlapping with the primary analysis using the primary between-family Bonferroni threshold; Extended Data Fig. 4b and Supplementary Tables 6, 11 and 12), confirming that the primary results are not driven by residual clinical imbalance between matched first-borns and second-borns
The state fixed-effects specification showed near-perfect agreement with the primary between-family model (r > 0.99, 98% concordant, 143 of 150 Bonferroni-significant diseases also significant; Extended Data Fig. 4c), indicating that geographical confounding has a negligible influence on the birth-order estimates
Restricting the between-family analysis to the ‘full-sibling’ subset (families where parental-age differences are internally consistent with the sibling spacing, a heuristic for biological full siblings) produced highly concordant results (r = 0.998)
A small number of diseases showed directional discordance between designs. The most notable was obesity (between-family OR = 1.052 indicating second-born excess; within-family OR = 0.938 indicating first-born excess). Such discordances may reflect confounders that vary within families (such as differential parental feeding practices for first versus second children) or differential period effects on diagnosis
Validation with positive and negative controls
We prespecified five positive controls and seven negative controls to validate the between-family design (Extended Data Fig. 5a). Positive controls were diseases with established birth-order associations, including allergic rhinitis, food allergy and asthma (predicted first-born excess per the sibling-exposure literature), acne (predicted first-born excess based on prior dermatological studies of sebaceous gland activity and healthcare-seeking patterns in first-borns) and substance abuse (predicted second-born excess per the behavioral literature). All five positive controls showed effects in the expected direction in both between-family and within-family designs: allergic rhinitis, food allergy, asthma and acne showed first-born excess (OR < 1), while substance abuse showed second-born excess (OR > 1). Between-family and within-family estimates were concordant in direction for all positive controls, with within-family estimates generally attenuated relative to between-family estimates (Extended Data Fig. 5a, left).
Negative controls included five diseases with primarily genetic or structural etiologies (type 1 diabetes mellitus, cystic fibrosis, Addison disease, Ehlers–Danlos syndrome, Turner syndrome) and two common acute diagnoses chosen as empirical null comparators (acute sinusitis and acute upper respiratory infection). We interpret these negative controls as specificity checks rather than uniformly powered falsification tests. The rare genetic or structural controls had limited power to exclude small birth-order effects at a Bonferroni threshold, whereas the two common acute controls provided higher-powered empirical null comparators. In the primary between-family design, the control estimates were close to the null hypothesis, with acute sinusitis (OR = 0.999) and acute upper respiratory infection (OR = 1.000) showing no meaningful between-family signal (Extended Data Fig. 5a, right). Acute sinusitis showed a small but Bonferroni-significant within-family deviation (OR = 0.965, P = 2.6 × 10−42), so it is best viewed as a near-null specificity check rather than a globally clean negative control. Corresponding within-family estimates for the same control set are reported in Supplementary Table 5.
Sibling age spacing modulates birth-order effects
We examined whether the magnitude of birth-order effects varied with sibling age gap using a gap × birth-order interaction model, stratified into age gap categories (< 4, 4–6, 7–10, > 10 years) (Extended Data Fig. 5b)
For autism, the first-born excess was strongest at gaps of 4–6 years (stratum OR ≈ 0.60) and attenuated at very short (< 4 years) and very long (> 10 years) gaps, producing a U-shaped pattern. ADHD showed a similar pattern, with first-born excess increasing from short to medium gaps and remaining stable at longer gaps. Allergic rhinitis showed progressive attenuation of the first-born protective effect with increasing gap, which is consistent with the microbial diversity framework (closer spacing provides more microbial sharing from the older sibling). Food allergy showed pronounced first-born excess at short gaps that weakened substantially at wider spacing. Substance abuse showed a decreasing second-born excess with greater spacing, suggesting that peer-influence effects of older siblings weaken when the age difference grows. Anxiety and phobia and depression showed stable first-born excess across gap categories (Extended Data Fig. 5b). Gap × birth-order interactions were tested for all 418 diseases; 127 (30.4%) showed significant interactions at the Bonferroni threshold (P < 1.20 × 10⁻⁴). Stratified ORs for selected diseases are shown in Supplementary Table 7. We also tested targeted effect modification for seven high-priority diseases. Autism showed significant birth-order interactions with sibling gap (omnibus P = 1.9 × 10⁻⁶), paternal age (P = 1.7 × 10⁻⁷), maternal age (P = 6.4 × 10⁻¹²) and calendar period (P = 3.2 × 10⁻⁶), but not sex (P = 0.97). Allergic rhinitis and food allergy also showed gap-dependent effects; substance abuse showed heterogeneity according to gap, sex, parental age and calendar period. In a supplementary full-cohort-adjusted T-learner analysis for these same diseases, models included sibling gap, sibling sex composition, parental age, calendar period and baseline comorbidity, alongside individual age, follow-up, sex, birth-year and ICD-era covariates. The standardized second-born − first-born risk differences were consistent with first-born excess for autism, food allergy, allergic rhinitis, tics/Tourette syndrome and the other/unspecified PDD code group; with second-born excess for substance abuse; and with a near-null average contrast for ADHD, whose predicted contrasts spanned both directions (Supplementary Figs. 1 and 2 and Supplementary Table 15). These analyses are exploratory and descriptive; they identify where the observed association is strongest but do not convert the birth-order contrast into an individualized clinical prediction model.
Healthcare use sensitivity analysis
To assess whether differential healthcare contact according to birth order could inflate diagnosis rates, we computed the total number of distinct claim days per individual in the matched cohort from the diagnostic claims database. First-borns had a mean of 24.0 distinct claim days compared with 22.9 for second-borns (median 11 versus 10), a clinically modest 4.5% difference. We then reestimated all between-family models in the strict clinical cohort with log-transformed visit count as an additional covariate. Visit-adjusted birth-order ORs were highly concordant with the unadjusted strict-cohort estimates (r = 0.99), indicating that the observed birth-order associations are not driven by differential healthcare use. ORs attenuated modestly toward the null hypothesis after adjustment (for example, the autism OR shifted from 0.799 to 0.880), which is consistent with the visit count acting partly as a mediator rather than as a pure confounder (Supplementary Table 13).
Reproductive stoppage
To assess whether reproductive stoppage, or the tendency of parents to curtail childbearing after a child is diagnosed with a serious condition, could explain the first-born enrichment observed for neurodevelopmental conditions, we conducted family-level logistic regression analyses (Supplementary Table 4). The adjusted model used 10,016,101 complete-case families from the full MarketScan database
A first-born autism diagnosis was associated with a modest reduction in the probability of having a second child (OR = 0.870, 95% CI 0.856–0.885, P = 2.6 × 10−62), corresponding to approximately a 13% relative reduction. Tics/Tourette syndrome showed a marginal 4% reduction (OR = 0.960, P = 5.5 × 10⁻⁴). Critically, ADHD showed negligible stoppage (OR = 1.011, P = 1.7 × 10⁻⁴); the other/unspecified PDD code group, the strongest first-born excess finding (primary OR = 0.569), showed a stoppage OR of 1.056 (P = 3.3 × 10⁻⁷), indicating that parents of children with diagnoses in this code group were more likely to have a second child, the opposite direction expected under reproductive stoppage.
Sex-stratified analysis
To examine whether birth-order effects differ by sex, we reestimated all between-family models separately in males and females from the strict clinical cohort, dropping sex from the covariate set within each stratum (Supplementary Table 14). Across 310 diseases analyzable in both sexes, male and female ({mathrm{log}}_{2}(mathrm{OR})) estimates were moderately correlated (r = 0.65, P = 6.6 × 10−39), indicating broadly consistent directionality with some sex-specific modulation. For several neurodevelopmental conditions, the first-born excess was more pronounced in males (for example, ADHD: male OR = 0.880, female OR = 0.984, Pdiff = 3.1 × 10⁻¹²; developmental delay: male OR = 0.799, female OR = 0.961, Pdiff = 6.0 × 10⁻³), which is consistent with the known male predominance in these disorders. A similar male-predominant pattern was observed for immune-allergic and dermatological conditions: allergic rhinitis (male OR = 0.859, female OR = 0.933, Pdiff = 6.8 × 10⁻¹²), asthma (male OR = 0.945, female OR = 0.996, Pdiff = 2.8 × 10⁻⁴), acne (male OR = 0.801, female OR = 0.841, Pdiff = 2.4 × 10⁻⁷) and ear infection (male OR = 0.958, female OR = 0.992, Pdiff = 9.8 × 10⁻⁴). By contrast, second-born excess conditions, such as substance abuse (male OR = 1.158, female OR = 1.256, Pdiff = 9.3 × 10⁻⁵) and migraine (male OR = 1.079, female OR = 1.162, Pdiff = 5.6 × 10⁻⁴) showed stronger effects in females.
Discussion
This study provides a large-scale phenome-wide assessment of birth-order effects on disease risk in US commercial claims data, leveraging two complementary epidemiological designs in over 10 million siblings. We identified 150 diseases with Bonferroni-significant birth-order associations spanning neurodevelopmental, psychiatric, immune-allergic, dermatological, gastrointestinal and cardiovascular domains
The disease atlas view (Fig. 2 and Extended Data Fig. 1) reveals that birth-order effects are not confined to a few well-studied conditions but instead pervade nearly every clinical domain tested, with a striking concentration of first-born excess in neuropsychiatric conditions and second-born excess in digestive and musculoskeletal diseases. The domain-level summary (Extended Data Fig. 2) and partial-pooling analysis (Extended Data Fig. 3) further demonstrate that the directionality of birth-order associations is domain-specific, suggesting that different biological and social mechanisms may contribute across organ systems.
The consistency of results between designs (Extended Data Fig. 4), the performance of validation controls (Extended Data Fig. 5) and the robustness to geographical confounding collectively support the conclusion that birth order is associated with widespread, albeit modest in size, differences in disease risk
The pattern of associations is consistent with at least three broad interpretive pathways. First, the first-born excess for allergic and atopic conditions is consistent with the sibling-exposure pattern first identified in the allergy birth-order literature5 and now more precisely interpreted through the old-friends and microbial diversity framework, in which exposure to diverse commensal and environmental microorganisms promotes immune regulatory development10,11. The attenuation of the allergic rhinitis effect with wider sibling spacing (Extended Data Fig. 5b) further supports this interpretation. Second, the first-born excess for neurodevelopmental conditions, strongest for the other/unspecified PDD code group (OR = 0.57) followed by tics/Tourette syndrome, autism and OCD, is biologically and phenotypically plausible but not mechanistically resolved by claims data. A recent Pregnancy and Childhood Epigenetics meta-analysis reported birth-order-associated differences in neonatal blood DNA methylation across 16 cohorts26, providing independent evidence that birth order can be associated with measurable biology at birth without establishing a mechanism for the disease associations observed in this study. In our data, parental-age confounding remains important, but autism remained first-born-enriched in the strict parental-age rematch (OR = 0.799) and in the within-family design (OR = 0.804), suggesting that parental age alone does not explain the result. The most conservative interpretation is that neurodevelopmental associations probably reflect a mixture of pregnancy-order biology, parental surveillance, diagnostic timing and residual confounding rather than one uniform mechanism. Third, the second-born excess for substance abuse aligns with sociological theories of later-born risk-taking behavior and elder sibling modeling effects3.
Our findings are concordant with, and extend, prior disease-specific studies. The strongest first-born excess was for the other/unspecified PDD code group (OR = 0.57), whose implemented ICD definition points to broader neurodevelopmental diagnostic coding rather than schizophrenia-spectrum psychosis. The autism first-born excess (OR = 0.74) is consistent with prior birth-order studies but larger in magnitude, probably reflecting the combined contribution of biological birth-order effects and residual reproductive stoppage16,27. Importantly, reproductive stoppage cannot explain the first-born excess for most neurodevelopmental conditions. Even for autism, where stoppage is detectable, the effect is substantially smaller than the 26% first-born excess in the primary analysis (OR = 0.737); the within-family analysis, which is robust to second-born reproductive stoppage by construction, confirmed the first-born excess (within-family OR = 0.804). The allergic rhinitis (OR = 0.91) and asthma (OR = 0.97) effects are consistent with the established sibling-exposure literature on allergic disease6,8. The substance abuse second-born excess (OR = 1.19) is consistent with this broader later-born behavioral framework. Our study adds hundreds of previously unexamined diseases, including strong associations for acne (OR = 0.87), adjustment disorder (OR = 0.86), biliary tract disease (OR = 1.18) and herpes zoster (OR = 1.35).
Several limitations merit discussion. First, claims data capture diagnoses that lead to billable healthcare encounters, not true disease incidence. Healthcare-seeking behavior may also vary with birth order. For example, if parents bring first-borns to the doctor more readily, this could inflate first-born diagnosis rates independently of true disease risk. The persistence of effects in the within-family design partially mitigates this concern (within-family comparisons control for family-level healthcare-seeking tendencies), but within-family differences in birth-order-dependent parental attention could remain. Arguing against blanket ascertainment bias, among all 418 tested diseases, 230 (55%) showed point estimates in the direction of second-born excess; among the 150 Bonferroni-significant associations, the split between first-born and second-born excess was near-symmetric (79 versus 71; binomial P = 0.568). If first-born diagnoses were systematically inflated by greater parental attention, one would expect a strong skew toward first-born excess; the observed near-parity is inconsistent with this explanation. Moreover, 71 Bonferroni-significant diseases showed second-born excess, including clinically acute conditions (herpes zoster, kidney infection, acute renal failure, biliary tract disease) whose presentation is driven by objective pathology rather than differential parental surveillance.
Second, the APC problem is inherent in any birth-order study. Within sibling pairs, the older child was born earlier, is observed at different ages during any calendar period and experienced different diagnostic standards. We addressed this through cohort and period adjustment in regression, multiple-model specifications in the within-family analysis, and negative controls; however, residual APC confounding cannot be fully excluded
Third, residual confounding according to parental age persists despite matching and regression adjustment. The structural correlation between birth order and parental age at birth (first-borns have younger parents by definition) means that parental-age effects cannot be fully disentangled from birth-order effects without strong parametric assumptions. For autism, where parental-age effects are strongest, tightening parental-age matching from a ± 10-year caliper to a ± 1-year caliper attenuated the between-family OR from 0.737 to 0.799. The within-family estimate (OR = 0.804) was similar to this tighter between-family estimate; however, within-family comparisons do not fully eliminate parental-age concerns because parental age at birth differs between first-born and second-born siblings. Thus, these analyses reduce but do not fully resolve parental-age confounding.
Fourth, the stricter clinically matched sensitivity analysis should be interpreted as a robustness analysis rather than a primary causal estimate. By matching on early baseline comorbidity and medication burden, it reduces residual clinical imbalance between first-born and second-born children from different families, but it may also partially control for early manifestations that lie on the pathway between birth order and later diagnosis. Reassuringly, this stricter rematch mainly pruned the original between-family signal rather than reversing it (Extended Data Fig. 4b).
Fifth, MarketScan captures employer-insured individuals, who are predominantly working-age, higher-income and disproportionately White. Our findings may not generalize to uninsured, Medicaid-covered or non-European ancestry populations
Finally, the restriction to two-child families introduces selection. This design choice ensures clean identification of first-born versus second-born status and eliminates confounding by completed family size, but families with two children may differ systematically from larger families (for example, in socioeconomic resources or reproductive preferences). Future work should evaluate whether the same phenome-wide patterns replicate in larger sibships and in independent cohorts (for example, Nordic registry data or Medicaid claims). However, we note that internal triangulation in two distinct analytical designs, the concordance of our estimates with published disease-specific studies and the validation of positive and negative controls collectively argue against a purely spurious pattern.
These results have several implications. Although individual effect sizes are modest (median OR = 0.89 for first-born excess, 1.10 for second-born excess), birth order is a universal exposure. Modest relative risks applied to the entire pediatric population can be translated into nontrivial population-level burden; the consistency of these effects between independent designs argues against noise. For clinicians, they highlight birth order as a modestly informative risk marker across multiple disease domains, which may be relevant for family counseling and screening prioritization. For researchers, the phenome-wide catalog of birth-order effects provides a resource for hypothesis generation and for benchmarking future studies. For epidemiologists, the dual-design approach demonstrated in this study offers a template for studying other nonrandomizable familial exposures.
In conclusion, birth order is associated with disease risk more broadly than previously appreciated. The convergence of evidence from between-family and within-family designs, combined with validation controls and robustness analyses, is consistent with a mixture of physiological, immunological and social mechanisms operating throughout the human disease phenome
Methods
Ethics statement
This study used de-identified secondary administrative claims data from the Merative MarketScan research databases, which are statistically de-identified to meet Health Insurance Portability and Accountability Act privacy requirements. The analyses used existing de-identified records, involved no direct contact with human participants and were conducted without access to direct identifiers. The University of Chicago Institutional Review Board determined this study to be exempt from human participant review. Informed consent was not applicable.
Data source
We used Merative MarketScan Commercial Claims and Encounters data from the 2003–2024 annual releases, which capture inpatient, outpatient and pharmacy claims for approximately 200 million unique covered lives in employer-sponsored health insurance plans across the United States. The raw yearly releases are distributed as SAS7BDAT files. From these annual releases, we constructed extracted analysis databases containing patient demographics (sex, birth year, enrollment family identifier), enrollment histories (start and end dates for coverage intervals) and diagnostic codes (ICD-9-CM and ICD-10-CM) recorded at each encounter28. We used the MarketScan enrollee identifier as the individual identifier and the enrollment family identifier as the family identifier. In the submitted analytical cohort, all 10,270,012 sibling rows had distinct individual identifiers, all 5,135,006 families contained exactly two analytical siblings and no cohort individual identifiers mapped to more than one family identifier in the extracted demographics table. These checks were used to verify internal identifier consistency in the extracted data, but they cannot rule out unobserved reenrollment under a new identifier after employer or insurance-plan changes without a vendor crosswalk.
All Merative MarketScan data were accessed and analyzed under an institutional license agreement with Merative, and were used in compliance with the terms of use of that license agreement
Cohort definition
We identified enrollment families in extracted enrollment databases derived from the annual Merative MarketScan releases, containing at least two members born between 1978 and 2013, aged 12–60 years in the current data year. Within each family, we inferred parents as the youngest male and female members who were aged 15 years or older than the oldest candidate child and whose age at the youngest child’s birth fell within 18–69 years. At least one inferred parent was required (eliminating spouse–pair misclassification).
After excluding inferred parents, we required exactly two remaining children (a ‘true two-child family’ restriction applied before individual eligibility filters to prevent families with a third ineligible child from being misclassified as two-child families). Both children were required to have 365 or more days of enrollment visibility, age at last observation of 12 years or older and valid first and last observation years. The older child was designated sib_order = 1 (first-born) and the younger sib_order = 2 (second-born). The sibling age gap was computed as the absolute difference in birth years. Parental psychiatric history was ascertained by searching all diagnostic codes for the relevant parent against a curated set of 302 ICD-9-CM and 252 ICD-10-CM psychiatric diagnostic codes spanning schizophrenia-spectrum disorders (ICD-9: 295.xx; ICD-10: F20–F29), mood and bipolar disorders (296.xx; F30–F39), anxiety, stress and somatoform disorders (300.xx, 308–309.xx; F40–F48), personality disorders (301.xx; F60–F69) and sleep disorders (327.xx; G47.xx), among others. The complete code list is provided in Supplementary Table 10. A parent was flagged as having a psychiatric history if any qualifying code appeared in their claims record during the enrollment window.
Geographical annotation
Each individual was assigned a three-digit ZIP code (ZIP3) in our extracted demographics database derived from the annual Merative MarketScan files. ZIP3 was mapped to a dominant county (FIPS code) using the HUD ZIP–TRACT crosswalk, weighted according to residential ratio29. County population estimates from the U.S. Census Bureau Vintage 2023 county file (co-est2023-alldata.csv) were then used to assign both census region and county population30,31. Specifically, we used the census REGION code (1 = Northeast, 2 = Midwest, 3 = South, 4 = West) and recoded it as our analysis variable direction (E, N, S, W), where E corresponds to the census Northeast and N corresponds to the census Midwest. County population was also used to define the urbanization tertile (low, medium, high).
Between-family matching
We constructed a matched cohort by pairing one first-born from family A with one second-born from family B, subject to exact match on sex, birth year, census direction and urbanization tertile and caliper match on follow-up duration (± 50 days), paternal age at birth (± 10 years), maternal age at birth (± 10 years) and sibling age gap (± 2 years). We also had the constraint that the two individuals came from different families
Within each exact-match stratum, we applied a greedy nearest-neighbor algorithm with randomized order and randomized tie-breaking32,33. The distance metric was a weighted sum of 2.0 × ∣Δdays_visible∣ + 1.0 × ∣Δfather_age∣ + 1.0 × ∣Δmother_age∣ + 0.5 × ∣Δgap∣. Matching used 45 parallel workers with a fixed random seed (2025) for reproducibility. Post-match SMDs for paternal (0.30) and maternal (0.36) age exceeded the conventional 0.1 balance threshold because, by construction, second-borns are drawn from families with structurally older parents at their birth; therefore, parental ages are included as categorical regression covariates rather than relying on matching alone to control for these differences.
Post-match quality control confirmed zero caliper violations, correct sib_order composition for all 1,616,881 pairs and improved SMDs for all covariates34 (Supplementary Table 2). This procedure was standard greedy nearest-neighbor caliper matching; we did not derive a new matching estimator or doubly robust estimator. Because matching was performed at the individual level, the same family could contribute to more than one matched pair. A dependence audit found reciprocal unordered family-pair matches to be rare (ten of 1,616,881 primary matched pairs and 24 of 529,760 strict matched pairs); covariance estimator sensitivities are reported in the supplementary source data.
Stricter clinical matching sensitivity analysis
As an additional robustness analysis, we rebuilt the between-family matched cohort using substantially tighter parental-age and baseline clinical matching. To preserve overlap, we did not require exact state matching in this sensitivity analysis; instead, geography remained controlled by exact census direction and urbanization tertile in the match and by a separate state fixed-effects analysis in the regression. Pairs were required to come from different families and opposite birth order; they were matched exactly on sex, birth year, census direction, urbanization tertile, age at start of observation, sibling age gap and baseline Charlson comorbidity score. We imposed a caliper of ± 50 days on enrollment visibility, ± 1 year on paternal and maternal age at birth, and imposed a ± 0.1 caliper on the baseline Medication-Based Disease Burden Index, a pharmacy-claim-based comorbidity measure35. The Charlson comorbidity index was computed from diagnostic codes using the Quan adaptation36. The baseline clinical indices were derived from the first 365 observed enrollment days before outcome ascertainment. This stricter rematch yielded 529,760 pairs (1,059,520 individuals); we refitted the primary between-family logistic models in this cohort to quantify concordance with the primary between-family estimates.
Disease phenotyping
We defined 569 diseases using ICD-9-CM and ICD-10-CM diagnostic code groupings adapted from an established phenotyping system previously applied to longitudinal claim data37. The complete mapping from disease names to ICD codes is provided in Supplementary Table 9. A disease was considered present for an individual if any qualifying diagnostic code appeared in their claims record during the entire observation window. We imposed a minimum of 500 cases in the matched cohort (between-family analysis) and 100 discordant sibling pairs (within-family analysis) for a disease to be included.
Clinical domain classification
Each disease was assigned to one of 17 clinical domains based on primary organ system or clinical category: neuropsychiatric/behavioral, neurological, infectious, musculoskeletal, sense organs, dermatological, respiratory, endocrine/metabolic, congenital, pregnancy-related, digestive, circulatory, genitourinary, general symptoms, neoplasms, injury/toxicology and hematological/immune. Domain assignments were made by the study team based on established clinical groupings of ICD codes and were fixed before the analysis. Diseases that could plausibly belong to multiple domains were assigned to the most clinically conventional category (for example, migraine to neurological rather than general symptoms).
For the revised domain-level analysis, we fitted a normal-normal empirical-Bayes partial-pooling meta-analysis to disease-level log(ORs) and CI-derived standard errors, separately for the primary between-family, within-family and strict between-family analyses. Parameters were estimated using maximum likelihood with scipy.optimize. The model estimates a global log-OR mean, between-domain heterogeneity, within-domain residual heterogeneity and domain-specific posterior means. This analysis was used to quantify domain-level clustering and shrinkage; it did not replace the prespecified disease-level Bonferroni inference.
Between-family logistic regression
For computational efficiency, individual-level data were collapsed into frequency tables (one row per unique covariate pattern within each disease), with case counts as weights. For each disease, we fitted a weighted logistic regression model with disease status (0/1) as the outcome and birth order (sib_order: 1 = first-born, 2 = second-born) as the primary exposure. Covariates included sibling age gap (categorical: < 4, 4–6, 7–10, > 10 years), age at last observation (categorical: ≤ 6, 7–10, 11–13, 14–16, 17–18, > 18 years), sex, paternal and maternal age at birth (categorical, 5-year bins), parental psychiatric history (father, mother), urbanization group, ICD coding era (ICD-9 versus ICD-10 based on first observation year), calendar period (5-year bins from observation mid-year) and a full-sibling consistency flag. Standard errors were clustered at the county level using HC1 robust variance32. Follow-up duration entered the model as a log-transformed covariate. We used a logistic model because each phenotype was analyzed as an ever-versus-never diagnosis indicator during the observed enrollment window, not as a recurrent event count. Therefore, follow-up duration was included as an adjustment covariate rather than as a person-time offset. As model-form sensitivity analyses, we refitted the 418 primary between-family disease models using log-link Poisson regression with robust standard errors and complementary-log–log regression on the same aggregated covariate tables; both alternative links were direction-concordant with the submitted logistic estimate for all 418 diseases. These link-function sensitivities used the same prespecified aggregate covariate tables; therefore, they do not assess continuous or spline parameterizations of binned covariates. County-level clustering was chosen to allow for local correlation in coding practice, provider availability and claim ascertainment after ZIP3-to-county geographical annotation. For seven high-salience diseases, inference was also compared across model-based, HC1, county-clustered, state-clustered, matched-pair-clustered and family-clustered covariance estimators.
For sensitivity, we reestimated each disease model with state fixed effects (50 state indicators plus District of Columbia)
Within-family conditional logistic regression
For each disease, we fitted a conditional logistic regression (Cox proportional-hazards model with case–control sampling, implemented via clogit in R) stratified on family identifier, with birth order as the exposure. Covariates included birth-cohort year (centered), age at last observation (categorical: ≤ 6, 7–10, 11–13, 14–16, 17–18, 19–22, 23–30, > 30 years), sex, log(follow-up duration), ICD coding era and calendar period of observation (categorical 5-year bins based on observation-window midpoint).
We fitted four model specifications to assess sensitivity to APC parametrization: (1) cohort-adjusted (birth year + age + ICD era); (2) cohort plus calendar period (primary); (3) period-only (dropping birth year); and (4) cohort with gap × birth-order interaction. The cohort-plus-period specification served as the primary within-family model. The analyses were repeated in the full-sibling subset as a sensitivity analysis
Gap × birth-order interaction
In the between-family design, we estimated gap-stratified birth-order ORs from a logistic regression that included a birth-order × gap-category interaction (< 4, 4–6, 7–10, > 10 years). In the within-family design, we included a gap × birth-order interaction term. As additional exploratory heterogeneity analyses, we first fitted targeted primary between-family interaction models for selected high-priority diseases using sibling age gap, sex, paternal age, maternal age and calendar period. We report stratum-specific birth-order ORs and omnibus likelihood-ratio tests for the interaction terms. We then fitted a full-cohort-adjusted T-learner for the same seven diseases. For each disease, separate gradient-boosted logistic outcome models were trained among first-born and second-born children and included individual covariates (age at last observation, log(follow-up), sex, birth year, calendar period and ICD era) together with family-level modifiers (sibling gap, sibling sex composition, paternal and maternal age, baseline Charlson and Medication-Based Disease Burden Index comorbidity summaries, urbanization, census region and direction, full-sibling-like flag and family observation period). For each two-child family, we predicted the second-born − first-born risk difference over both observed sibling covariate profiles and averaged the two contrasts, yielding a standardized family-level risk-difference contrast. We used a T-learner rather than causal forests or Bayesian additive regression trees because it retains an explicit first-born versus second-born outcome-model contrast while allowing flexible modifier discovery. Because birth order is fixed by family structure rather than assigned through a covariate-dependent propensity mechanism, we treated this analysis as exploratory modifier discovery rather than as individualized causal risk prediction. We did not use family size as a modifier because the primary cohort is restricted to exactly two-child families.
Reproductive stoppage analysis
We conducted family-level analyses using an extracted MarketScan demographics database (not restricted to two-child families). Among all families with at least one child meeting the basic eligibility criteria, we identified whether the first-born had a diagnosis for each of four key first-born excess conditions (autism, ADHD, tics/Tourette syndrome and the other/unspecified PDD code group) and whether the family had a second eligible child. For each disease, we fitted a logistic regression with ‘has second child’ (0/1) as the outcome and ‘first-born diagnosis’ as the exposure, adjusting for first-born sex, birth year, enrollment duration, parental ages and calendar period, with HC1 robust standard errors.
Healthcare use sensitivity analysis
To test whether differential healthcare contact according to birth order could confound disease ascertainment, we computed the total number of distinct claim days (unique service dates with any diagnostic code) for each individual in the stricter clinically matched cohort from the diagnostic claims database. We then reestimated all between-family logistic regression models in this cohort with the log-transformed visit count ((mathrm{log}({n}_{mathrm{visits}}+1))) included as an additional covariate alongside all covariates in the primary model. We assessed concordance between unadjusted and visit-adjusted birth-order ORs using Pearson correlation of ({mathrm{log}}_{2}(mathrm{OR})) estimates.
Sex-stratified analysis
To assess whether birth-order effects are modulated by sex, we reestimated all between-family logistic regression models separately in males and females from the strict clinical cohort, omitting sex from the covariate set as it is constant within each stratum. A minimum of 200 cases per stratum was required for model convergence. We assessed male–female concordance using Pearson correlation of ({mathrm{log}}_{2}(mathrm{OR})) estimates across diseases analyzable in both sexes
Cross-design concordance analysis
To quantify the agreement between alternative analytical designs, we computed three metrics for each pairwise comparison (for example, primary between-family versus within-family): (1) Pearson correlation of ({mathrm{log}}_{2}(mathrm{OR})) estimates across all diseases analyzable in both designs; (2) directional concordance, defined as the proportion of diseases for which both designs yield an OR < 1 or both yielded an OR > 1; and (3) overlap of Bonferroni-significant diseases. We generated scatter plots of ({mathrm{log}}_{2}(mathrm{OR})) from the primary between-family analysis against each alternative specification (Extended Data Fig. 4).
Positive and negative controls
We prespecified five positive controls (diseases expected to show birth-order effects) and seven negative controls (diseases expected to show no effect) before examining phenome-wide results. Positive controls were: allergic rhinitis, food allergy and asthma (predicted first-born excess per the sibling-exposure literature5,6); acne (predicted first-born excess based on prior dermatological literature); and substance abuse (predicted second-born excess per the sociological literature3). Negative controls included five conditions with primarily genetic or structural etiologies unlikely to be influenced by birth order (type 1 diabetes, cystic fibrosis, Addison disease, Ehlers–Danlos syndrome, Turner syndrome) and two common acute conditions serving as empirical null comparators (acute sinusitis and acute upper respiratory infection).
Multiple-testing correction
We applied Bonferroni correction (α = 0.05/ntests, where ntests = 418 for between-family and 541 for within-family) and the Benjamini–Hochberg procedure38 at a false discovery rate of q < 0.05
Software
Cohort extraction and data preparation were performed in Python v.3.11 (pandas, sqlite3, multiprocessing). Statistical analyses were performed in R v.4.3 (survival, sandwich, lmtest packages). Figures were generated in Python using matplotlib v.3.8
Reporting summary
Further information on research design is available in the Nature Portfolio Reporting Summary linked to this article
Data availability
The individual-level Merative MarketScan Commercial Claims and Encounters data analyzed in this study are proprietary, licensed data owned by Merative and cannot be shared publicly or redistributed by the authors under the terms of our license. The data are available to any qualified researcher or research institution that obtains a license and executes a data use agreement directly with Merative; the authors held no special access privileges beyond this standard licensing route. Access should be requested from Merative (Merative MarketScan research databases; www.merative.com/real-world-evidence), which grants access to qualified academic, government and commercial researchers who complete its licensing and data use agreement process, for research use consistent with the terms of that agreement. Summary-level data sufficient to interpret, verify and extend the findings are provided within this article, its supplementary tables and a source data file. Supplementary Tables 1–15 provide summary-level results, matching diagnostics and sensitivity analyses, including selected birth-spacing-stratified results (Supplementary Table 7), complete disease-level results for all 418 diseases with between-family, within-family and strict clinical rematch estimates (Supplementary Table 8), ICD code definitions for all 569 disease phenotypes (Supplementary Table 9), the psychiatric diagnostic code list used to define parental psychiatric history (Supplementary Table 10), disease-level results from the stricter clinical rematch (Supplementary Table 11), covariate balance diagnostics for the strict clinical rematch (Supplementary Table 12), healthcare use sensitivity analysis (Supplementary Table 13), sex-stratified birth-order associations (Supplementary Table 14) and exploratory adjusted T-learner heterogeneity results (Supplementary Table 15). Source data are provided with this paper.
Code availability
All custom code used for cohort extraction, matching, regression modeling and figure generation is publicly available at https://github.com/benjaminkramer510/BirthOrderPhenome2026
References
Galton, F. English Men of Science: Their Nature and Nurture (Macmillan, 1874)
Adler, A. Characteristics of the first, second, and third child. Children3, 14–52 (1928)
Sulloway, F. J. Born to Rebel: Birth Order, Family Dynamics, and Creative Lives (Pantheon Books, 1996)
Ernst, C. & Angst, J. Birth Order:Its Influence On Personality (Springer Verlag, 1983)
Strachan, D. P. Hay fever, hygiene, and household size. BMJ299, 1259–1260 (1989)
Karmaus, W. & Botezan, C. Does a higher number of siblings protect against the development of allergy and asthma? A review. J. Epidemiol. Community Health56, 209–217 (2002)
Ball, T. M. et al. Siblings, day-care attendance, and the risk of asthma and wheezing during childhood. N. Engl. J. Med.343, 538–543 (2000)
Westergaard, T. et al. Sibship characteristics and risk of allergic rhinitis and asthma. Am. J. Epidemiol.162, 125–132 (2005)
Strachan, D. P. Family size, infection and atopy: the first decade of the “hygiene hypothesis”. Thorax55, S2–S10 (2000)
Rook, G. A. W. 99th Dahlem conference on infection, inflammation and chronic inflammatory disorders: Darwinian medicine and the “hygiene” or “old friends” hypothesis. Clin. Exp. Immunol.160, 70–79 (2010)
Ege, M. J. et al. Exposure to environmental microorganisms and childhood asthma. N. Engl. J. Med.364, 701–709 (2011)
Okada, H., Kuhn, C., Feillet, H. & Bach, J.-F. The “hygiene hypothesis” for autoimmune and allergic diseases: an update. Clin. Exp. Immunol.160, 1–9 (2010)
Black, S. E., Devereux, P. J. & Salvanes, K. G. The more the merrier? The effect of family size and birth order on children’s education. Q. J. Econ.120, 669–700 (2005)
Black, S. E., Devereux, P. J. & Salvanes, K. G. Older and wiser? Birth order and IQ of young men. CESifo Econ. Stud.57, 103–120 (2011)
Kristensen, P. & Bjerkedal, T. Explaining the relation between birth order and intelligence. Science316, 1717 (2007)
Hoffmann, T. J. et al. Evidence of reproductive stoppage in families with autism spectrum disorder: a large, population-based cohort study. JAMA Psychiatry71, 943–951 (2014)
Wood, C. L. et al. Evidence for ASD recurrence rates and reproductive stoppage from large UK families. Autism Res.8, 73–81 (2015)
Durkin, M. S. et al. Advanced parental age and the risk of autism spectrum disorder. Am. J. Epidemiol.168, 1268–1276 (2008)
Lawson, D. W. & Mace, R. Siblings and childhood mental health: evidence for a later-born advantage. Soc. Sci. Med.70, 2061–2069 (2010)
Cardwell, C. R., Carson, D. J. & Patterson, C. C. Parental age at delivery, birth order, birth weight and gestational age are associated with the risk of childhood type 1 diabetes: a UK regional retrospective cohort study. Diabet. Med.22, 200–206 (2005)
Barclay, K. & Myrskylä, M. Advanced maternal age and offspring outcomes: reproductive aging and counterbalancing period trends. Popul. Dev. Rev.42, 69–94 (2016)
Yang, Y. & Land, K. C. Age–period–cohort analysis of repeated cross-section surveys: fixed or random effects? Sociol. Methods Res.36, 297–326 (2008)
Donovan, S. J. & Susser, E. Commentary: advent of sibling designs. Int. J. Epidemiol.40, 345–349 (2011)
Frisell, T., Öberg, S., Kuja-Halkola, R. & Sjölander, A. Sibling comparison designs: bias from non-shared confounders and measurement error. Epidemiology23, 713–720 (2012)
Sjölander, A., Frisell, T. & Öberg, S. Causal interpretation of between-within models for twin research. Epidemiol. Methods1, 217–237 (2012)
Li, S. et al. A pregnancy and childhood epigenetics consortium (PACE) meta-analysis highlights potential relationships between birth order and neonatal blood DNA methylation. Commun. Biol.7, 66 (2024)
Turner, T., Pihur, V. & Chakravarti, A. Quantifying and modeling birth order effects in autism. PLoS ONE6, e26418 (2011)
Merative. Data assets for government, non-profit, and academic research: merative MarketScan research databases https://assets.merative.com/m/14a25695e23af4fe/original/MarketScan_Data-assets-for-government-non-profit-and-academic-research_Solution-Brief.PDF (2022)
U.S. Department of Housing and Urban Development. HUD USPS ZIP Code Crosswalk Files www.huduser.gov/portal/datasets/usps_crosswalk.html (2024)
U.S. Census Bureau. County Population Totals and Components of Change: 2020–2023 www2.census.gov/programs-surveys/popest/datasets/2020-2023/counties/totals/co-est2023-alldata.csv (2024)
U.S. Census Bureau. CO-EST2023-ALLDATA File Layout www2.census.gov/programs-surveys/popest/technical-documentation/file-layouts/2020-2023/CO-EST2023-ALLDATA.pdf (2024)
Rosenbaum, P. R. & Rubin, D. B. The central role of the propensity score in observational studies for causal effects. Biometrika70, 41–55 (1983)
Stuart, E. A. Matching methods for causal inference: a review and a look forward. Stat. Sci.25, 1–21 (2010)
Austin, P. C. Balance diagnostics for comparing the distribution of baseline covariates between treatment groups in propensity-score matched samples. Stat. Med.28, 3083–3107 (2009)
George, J. Development and validation of the medication-based disease burden index. Ann. Pharmacother.40, 645–650 (2006)
Quan, H. et al. Coding algorithms for defining comorbidities in ICD-9-CM and ICD-10 administrative data. Med. Care43, 1130–1139 (2005)
Jia, G. et al. The high-dimensional space of human diseases built from diagnosis records and mapped to genetic loci. Nat. Comput. Sci.3, 403–417 (2023)
Benjamini, Y. & Hochberg, Y. Controlling the false discovery rate: a practical and powerful approach to multiple testing. J. R. Stat. Soc. Ser. B57, 289–300 (1995)
<a href="https://citation-needed.springer.com/v2/references/10.1038/s44360-026-00177-z?format=refman&flavour=references” rel=”nofollow noopener” target=”_blank”>Download references
Acknowledgements
We thank the Merative MarketScan team for data access
Funding
This study was supported by award no. 1R01MH137646-01 from the National Institute of Mental Health and the National Institutes of Health to S.A.K. and A.R. The funders had no role in study design, data collection or analysis, decision to publish or preparation of the manuscript
Author information
Authors and Affiliations
Department of Medicine, University of Chicago, Chicago, IL, USA
Benjamin Kramer & Andrey Rzhetsky
Department of Psychiatry, Columbia University, New York, NY, USA
Steven A. Kushner
Department of Human Genetics, Committee on Genetics, Genomics, and Systems Biology, University of Chicago, Chicago, IL, USA
Andrey Rzhetsky
Authors
- Benjamin KramerView author publications
Search author on:PubMed Google Scholar
- Steven A. KushnerView author publications
Search author on:PubMed Google Scholar
- Andrey RzhetskyView author publications
Search author on:PubMed Google Scholar
Contributions
B.K. improved the study design, implemented the analytical pipeline, performed all the analyses and wrote the manuscript. A.R. conceived and supervised the study, provided critical input on study design and interpretation, designed and implemented early versions of the analytical pipeline, and edited the manuscript. S.A.K. provided critical input on study design and interpretation and edited the manuscript
Ethics declarations
Competing interests
The authors declare no competing interests
Peer review
Peer review information
Nature Health thanks the anonymous reviewers for their contribution to the peer review of this work
Additional information
Publisher’s note Springer Nature remains neutral with regard to jurisdictional claims in published maps and institutional affiliations
Extended data
Extended Data Fig. 1 Birth-order disease atlas across all displayed clinical domains
Atlas of the 75 diseases reaching Bonferroni significance in both the primary between-family and within-family analyses with concordant effect direction, across 14 clinical domains; format as in Fig. 2. Each tile is one disease; tile colour denotes the direction and magnitude of the birth-order effect (blue, first-born excess, OR < 1; red, second-born excess, OR > 1; intensity proportional to (| log 2({rm{OR}})|), range ± 0.81). Additional domains include dermatologic (acne, hirsutism, seborrheic dermatitis), respiratory (asthma, allergic rhinitis), endocrine/metabolic (lipid metabolism, pubertal dysfunction), congenital, pregnancy, digestive (gastritis/duodenitis, IBS, appendiceal disease), sense organs, genitourinary, and general symptoms. Substance abuse is the only neuropsychiatric condition showing second-born excess. Tiles are per-disease odds-ratio point estimates (colour encodes direction and magnitude); no error bars are shown, as the atlas encodes effect size by colour, and per-disease 95% confidence intervals are provided in the Source Data file. The unit of analysis is the individual child (the sibling pair in the within-family comparison). n = 75 diseases; per-disease case counts and odds ratios in Supplementary Table 8.
Source data
Extended Data Fig. 2 Domain-level distribution of birth-order effects
a, Number of Bonferroni-significant diseases per displayed clinical domain, split by direction (blue, left, first-born excess; red, right, second-born excess); congenital/genetic and injury/toxicology domains excluded; domains sorted by number of first-born-excess diseases; bars are integer disease counts. b, Box plots of the distribution of log2(OR) (primary between-family analysis) across all displayed diseases within each domain, with individual diseases overlaid as points; box centre line, median; box bounds, 25th and 75th percentiles (interquartile range, IQR); whiskers, most extreme values within 1.5 × IQR of the box; minima and maxima, the smallest and largest disease-level (log 2({rm{OR}})) within each domain, shown as the most extreme overlaid points; points beyond the whiskers are individual diseases; includes all displayed diseases, not only significant ones; domains ordered as in a. Number of diseases per domain (n): endocrine/metabolic 49, neoplasms 46, sense organs 37, neurological 33, digestive 32, dermatologic 29, circulatory 28, neuropsychiatric/behavioural 26, musculoskeletal 25, genitourinary/reproductive 24, infectious 23, hematologic/immune 19, respiratory 19, general symptoms 3, pregnancy 2 (total n = 395 diseases).
Source data
Extended Data Fig. 3 Domain-level partial pooling of birth-order effects
Forest plot of empirical-Bayes partially pooled domain-level odds ratios for second-born vs first-born children, estimated separately for the primary between-family scan, the within-family sibling comparison, and the strict between-family rematch. Points show domain-specific posterior means (measure of centre); horizontal lines show 95% intervals. Blue-shaded region, first-born excess (OR < 1); red-shaded region, second-born excess (OR > 1); vertical line, null. Domains ordered by the primary between-family pooled estimate. Number of diseases pooled per design: n = 418 (between-family primary), 541 (within-family), 318 (strict rematch), across 17 domains (per-domain n in the Source Data file). Quantifies domain-level clustering; does not replace the disease-level Bonferroni-corrected primary inference.
Source data
Extended Data Fig. 4 Cross-design concordance of birth-order effects
Scatter plots comparing log2(OR) from the primary between-family analysis (x-axis) with three alternative specifications (y-axis). a, Primary between-family vs within-family (r = 0.66; 74.2% directionally concordant; 79 of 150 Bonferroni-significant diseases significant in both; n = 418 diseases analysable in both). b, Primary between-family vs stricter clinically matched between-family cohort (r = 0.93; 91% concordant; 92 significant in both; n = 318 diseases analysable in both). c, Primary between-family vs state fixed-effects specification (r > 0.99; 98% concordant; 143 of 150 significant in both; n = 418). Each point is one disease (the unit of analysis), and r is the Pearson correlation across diseases; panels show disease-level point estimates with no error bars; dark blue, Bonferroni-significant in both; medium blue, significant in primary between-family only; grey, non-significant; dashed red line, perfect concordance (slope = 1). Per-disease estimates in Supplementary Table 8.
Source data
Extended Data Fig. 5 Validation with positive and negative controls and birth-spacing dose-response
a, Forest plots of odds ratios (point estimate = measure of centre) with 95% confidence intervals (error bars) for pre-specified positive controls (left: allergic rhinitis, food allergy, asthma, acne, substance abuse) and negative controls (right: type 1 diabetes, cystic fibrosis, Addison disease, Ehlers-Danlos syndrome, Turner syndrome, acute sinusitis, acute URI); filled markers, between-family (unit of analysis, the individual person); open markers, within-family (unit of analysis, the sibling pair); observations are independent individuals and families with no technical replicates; background shading indicates expected direction. b, Birth-order odds ratios (point estimate) with 95% confidence intervals (error bars) stratified by sibling age gap (< 4, 4-6, 7-10, > 10 years) for eight diseases (autism, ADHD, allergic rhinitis, food allergy, acne, substance abuse, anxiety/phobia, depression); blue, first-born-excess diseases; red, second-born-excess. Between-family case counts (n) range from 822 (Turner syndrome) to 1,228,989 (acute URI); per-disease and per-stratum case counts are listed in full in Supplementary Tables 1, 5, and 8.
Source data
Supplementary information
Supplementary Information (download PDF )
Supplementary Methods, Tables 1–15 and Figs. 1 and 2
Reporting Summary (download PDF )
Source data
Source Data Figs. 1–4, Extended Data Fig. 1–5 (download XLSX )
Tab ‘Fig1c_balance’: covariate standardized mean differences before and after matching (Fig. 1c). Tab ‘Fig2_3_4_ED1_ED4_diseases’: per-disease odds ratios, 95% CIs, P, prevalence, and case counts for all 418 diseases. Tab ‘Fig2_3_4_ED1_ED4_diseases’: per-disease odds ratios and case counts (landscape). Tabs ‘Fig2_3_4_ED1_ED4_diseases’ and ‘STab11_strict_rematch’: per-disease estimates across specifications (robustness). Tab ‘Fig2_3_4_ED1_ED4_diseases’: per-disease odds ratios and case counts (atlas, all domains). Tab ‘Fig2_3_4_ED1_ED4_diseases’: per-disease log2(OR) used for the per-domain distributions; clinical-domain groupings as defined in the Methods and analysis code; per-domain disease counts are listed in the Extended Data Fig. 2 legend. Tab ‘ED3_domain_pooling’: empirical-Bayes pooled domain-level odds ratios and per-domain n for each design. Tab ‘Fig2_3_4_ED1_ED4_diseases’: per-disease estimates across specifications (concordance). Tab ‘ED5_validation_gap’: within-family disease-level estimates; control and gap-stratified odds ratios are also in Supplementary Tables 5 and 7.
Rights and permissions
Open Access This article is licensed under a Creative Commons Attribution-NonCommercial-NoDerivatives 4.0 International License, which permits any non-commercial use, sharing, distribution and reproduction in any medium or format, as long as you give appropriate credit to the original author(s) and the source, provide a link to the Creative Commons licence, and indicate if you modified the licensed material. You do not have permission under this licence to share adapted material derived from this article or parts of it. The images or other third party material in this article are included in the article’s Creative Commons licence, unless indicated otherwise in a credit line to the material. If material is not included in the article’s Creative Commons licence and your intended use is not permitted by statutory regulation or exceeds the permitted use, you will need to obtain permission directly from the copyright holder. To view a copy of this licence, visit http://creativecommons.org/licenses/by-nc-nd/4.0/.
About this article
Cite this article
Kramer, B., Kushner, S.A. & Rzhetsky, A. Birth order and disease risk across the human phenome.
Nat. Health (2026). https://doi.org/10.1038/s44360-026-00177-z
Received:09 April 2026
Accepted:03 July 2026
Published:03 August 2026
Version of record:03 August 2026
DOI
:https://doi.org/10.1038/s44360-026-00177-z
