


Abstract
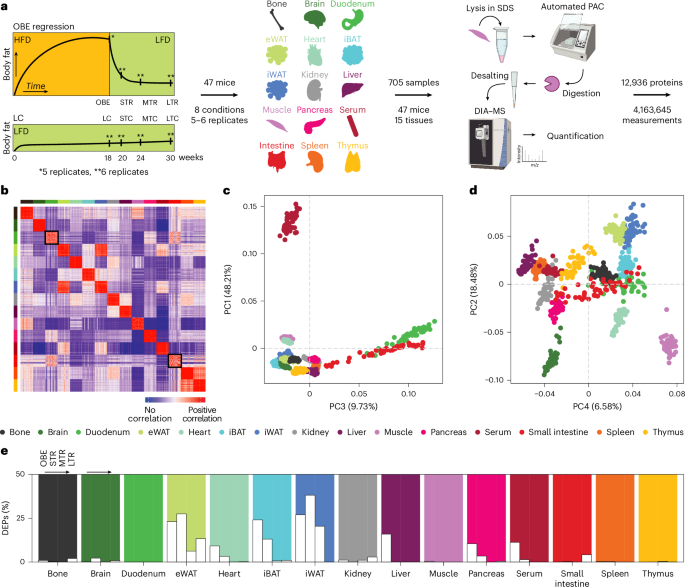
Obesity drives systemic metabolic dysfunction, yet how the body adapts and recovers at a system-wide level remains unclear. Here we generate a multi-organ proteomic atlas of diet-induced obesity and its regression in male mice. Using a standardized, semi-automated sample preparation workflow, we quantify 12,936 unique proteins across 15 organs and four timepoints. We find proteomic changes to be highly tissue-dependent, with a small number of proteins displaying shared changes across multiple tissues. While proteomes of most tissues revert to lean levels after weight loss, white adipose tissue retains strong phagocytic and inflammatory responses, and the brain, kidney, bone, thymus and spleen display delayed obesity-induced alterations. We map the adipose tissue-specific immune regulators using ligand-target inference and show reduced expression of proteasomal subunits in brown adipose tissue, resulting in stalled ubiquitin turnover. Finally, we make all datasets open access and create an interactive webtool to facilitate further community-driven discovery.
This is a preview of subscription content, access
Access options
Access through your institution
- Purchase on SpringerLink
- Instant access to the full article PDF.
39,95 €
Prices may be subject to local taxes which are calculated during checkout
Subjects
- Metabolism
- Proteomics
- Translational research
Data availability
The MS proteomics data have been deposited to the ProteomeXchange Consortium via the PRIDE66 partner repository with the dataset identifier PXD066875. All relevant processed data can also be found in Supplementary Data 1–22 (descriptions in Extended Data Table 1). Raw RNA-seq data have been deposited in the NCBI Gene Expression Omnibus (GEO) under accession no. GSE338985. The Shiny-based webtool can be accessed at https://computproteomics.bmb.sdu.dk/app_direct/obesity-atlas/ and a dockerized container can be pulled from Docker Hub at felixboel/proteomic-atlas-of-obesity. Source data are provided with this paper.
Code availability
Code for our Shiny-based webtool, along with necessary datasets, is availableesity (ref. 67). Remaining data analysis pipelines come from popular well-documented R packages and can be found briefly described in the Methods
References
Nyberg, S. T. et al. Obesity and loss of disease-free years owing to major non-communicable diseases: a multicohort study. Lancet Public Health3, e490–e497 (2018)
Vishvanath, L. & Gupta, R. K. Contribution of adipogenesis to healthy adipose tissue expansion in obesity. J. Clin. Invest.129, 4022–4031 (2019)
Rosen, E. D. & Spiegelman, B. M. What we talk about when we talk about fat. Cell156, 20–44 (2014)
Bondareva, O. et al. Single-cell profiling of vascular endothelial cells reveals progressive organ-specific vulnerabilities during obesity. Nat. Metab.4, 1591–1610 (2022)
Haase, C. L. et al. Weight loss and risk reduction of obesity-related outcomes in 0.5 million people: evidence from a UK primary care database. Int. J. Obes.45, 1249–1258 (2021)
Hinte, L. C. et al. Adipose tissue retains an epigenetic memory of obesity after weight loss. Nature636, 457–465 (2024)
Hahn, O. et al. A nutritional memory effect counteracts the benefits of dietary restriction in old mice. Nat. Metab.1, 1059–1073 (2019)
Correia, C. M. et al. Acute deletion of the glucocorticoid receptor in hepatocytes disrupts postprandial lipid metabolism in male mice. Endocrinology164, bqad128 (2023)
Schmitz, J. et al. Obesogenic memory can confer long-term increases in adipose tissue but not liver inflammation and insulin resistance after weight loss. Mol. Metab.5, 328–339 (2016)
Collins, B. C. et al. Multi-laboratory assessment of reproducibility, qualitative and quantitative performance of SWATH–mass spectrometry. Nat. Commun.8, 291 (2017)
Moritz, R. L. et al. A proteome strategy for fractionating proteins and peptides using continuous free-flow electrophoresis coupled off-line to reversed-phase high-performance liquid chromatography. Anal. Chem.76, 4811–4824 (2004)
Sampath, H. & Ntambi, J. M. The role of stearoyl-CoA desaturase in obesity, insulin resistance, and inflammation. Ann. N.Y. Acad. Sci.1243, 47–53 (2011)
Hallenborg, P. et al. Adipose MDM2 regulates systemic insulin sensitivity. Sci. Rep.11, 21839 (2021)
Meghadri, S. H. et al. Loss of Serpina1 in mice leads to altered gene expression in inflammatory and metabolic pathways. Int. J. Mol. Sci.23, 10425 (2022)
Okagawa, S. et al. Hepatic SerpinA1 improves energy and glucose metabolism through regulation of preadipocyte proliferation and UCP1 expression. Nat. Commun.15, 9585 (2024)
Abdollahi, S., Lotfi, A. S., Saravani, R. & Taheri, H. An association study of SERPINA1 gene polymorphisms with the risk of metabolic dysfunction-associated steatotic liver disease in an Iranian population: a preliminary case-control study. Biochem. Biophys. Rep.42, 101974 (2025)
Kim, H. et al. Serpina1e mediates the exercise-induced enhancement of hippocampal memory in male mice. Nat. Commun.17, 5018 (2026)
Yang, H. et al. Obesity accelerates thymic aging. Blood114, 3803–3812 (2009)
Cottam, M. A., Caslin, H. L., Winn, N. C. & Hasty, A. H. Multiomics reveals persistence of obesity-associated immune cell phenotypes in adipose tissue during weight loss and weight regain in mice. Nat. Commun.13, 2950 (2022)
Prabata, A., Ikeda, K., Rahardini, E. P., Hirata, K.-I. & Emoto, N. GPNMB plays a protective role against obesity-related metabolic disorders by reducing macrophage inflammatory capacity. J. Biol. Chem.297, 101232 (2021)
Katayama, A. et al. Beneficial impact of Gpnmb and its significance as a biomarker in nonalcoholic steatohepatitis. Sci. Rep.5, 16920 (2015)
Speir, M. L. et al. UCSC Cell Browser: visualize your single-cell data. Bioinformatics37, 4578–4580 (2021)
Perrin, S. et al. Single-nucleus transcriptomics reveal the differentiation trajectories of periosteal skeletal/stem progenitor cells in bone regeneration. Elife13, RP92519 (2024)
Zhao, L. et al. Pharmacologically reversible zonation-dependent endothelial cell transcriptomic changes with neurodegenerative disease associations in the aged brain. Nat. Commun.11, 4413 (2020)
Miao, Z. et al. Single cell regulatory landscape of the mouse kidney highlights cellular differentiation programs and disease targets. Nat. Commun.12, 2277 (2021)
Zhang, S. et al. Zyxin regulates embryonic stem cell fate by modulating mechanical and biochemical signaling interface. Commun. Biol.6, 62 (2023)
Anderson, C. A., Kovar, D. R., Gardel, M. L. & Winkelman, J. D. LIM domain proteins in cell mechanobiology. Cytoskeleton78, 303–311 (2021)
López-Colomé, A. M., Lee-Rivera, I., Benavides-Hidalgo, R. & López, E. Paxillin: a crossroad in pathological cell migration. J. Hematol. Oncol.10, 1–15 (2017)
Rauskolb, C., Pan, G., Reddy, B., Oh, H. & Irvine, K. D. Zyxin links fat signaling to the hippo pathway. PLoS Biol.9, e1000624 (2011)
Elbediwy, A. et al. Enigma proteins regulate YAP mechanotransduction. J. Cell Sci.131, jcs221788 (2018)
Zaslavsky, K. et al. SHANK2 mutations associated with autism spectrum disorder cause hyperconnectivity of human neurons. Nat.Neurosci.22, 556–564 (2019)
Klaassen, R. V. et al. Shisa6 traps AMPA receptors at postsynaptic sites and prevents their desensitization during synaptic activity. Nat. Commun.7, 10682 (2016)
Guan, F. et al. Evaluation of voltage-dependent calcium channel γ gene families identified several novel potential susceptible genes to schizophrenia. Sci. Rep.6, 24914 (2016)
Troyano-Rodriguez, E., Mann, S., Ullah, R. & Ahmad, M. PRRT1 regulates basal and plasticity-induced AMPA receptor trafficking. Mol. Cell. Neurosci.98, 155–163 (2019)
Whitmer, R. A., Gunderson, E. P., Barrett-Connor, E., Quesenberry, C. P. & Yaffe, K. Obesity in middle age and future risk of dementia: a 27 year longitudinal population based study. BMJ330, 1360 (2005)
Khanna, D., Khanna, S., Khanna, P., Kahar, P. & Patel, B. M. Obesity: a chronic low-grade inflammation and its markers. Cureus14, e22711 (2022)
Nguyen, H. C., Wang, W. & Xiong, Y. Cullin–RING E3 ubiquitin ligases: bridges to destruction. In Macromolecular Protein Complexes: Structure and Function (eds Harris, J. R. & Marles-Wright, J.) 323–347 (Springer, 2017)
Akimov, V. et al. UbiSite approach for comprehensive mapping of lysine and N-terminal ubiquitination sites. Nat. Struct. Mol. Biol.25, 631–640 (2018)
Senju, Y. & Tsai, F.-C. A biophysical perspective of the regulatory mechanisms of ezrin/radixin/moesin proteins. Biophys. Rev.14, 199–208 (2022)
Browaeys, R., Saelens, W. & Saeys, Y. NicheNet: modeling intercellular communication by linking ligands to target genes. Nat. Methods17, 159–162 (2020)
Eguchi, A. & Feldstein, A. E. Lysosomal cathepsin D contributes to cell death during adipocyte hypertrophy. Adipocyte2, 170–175 (2013)
Lee, W. H. et al. Self-assembled hyaluronic acid nanoparticle suppresses fat accumulation1 (2020)
Sun, H., Hu, L. & Fan, Z. β2 integrin activation and signal transduction in leukocyte recruitment. Am. J. Physiol. Cell. Physiol.321, C308–C316 (2021)
Wilson, A. M. et al. Neuropilin-1 expression in adipose tissue macrophages protects against obesity and metabolic syndrome. Sci. Immunol.3, eaan4626 (2018)
Bartelt, A. et al. Brown adipose tissue thermogenic adaptation requires Nrf1-mediated proteasomal activity. Nat. Med.24, 292–303 (2018)
Chung, K. W. Advances in understanding of the role of lipid metabolism in aging. Cells10, 880 (2021)
Medrikova, D. et al. Sex differences during the course of diet-induced obesity in mice: adipose tissue expandability and glycemic control. Int. J. Obes.36, 262–272 (2012)
Stapleton, S., Welch, G., DiBerardo, L. & Freeman, L. R. Sex differences in a mouse model of diet-induced obesity: the role of the gut microbiome. Biol. Sex Differ.15, 5 (2024)
Papenberg, M. minDiff: minimize differences between groups. GitHubhttps://github.com/m-Py/minDiff (2018)
Batth, T. S. et al. Protein aggregation capture on microparticles enables multipurpose proteomics sample preparation. Mol. Cell. Proteom.18, 1027–1035 (2019)
Dobin, A. et al. STAR: ultrafast universal RNA-seq aligner. Bioinformatics29, 15–21 (2013)
Madsen, J. G. S. et al. iRNA-seq: computational method for genome-wide assessment of acute transcriptional regulation from total RNA-seq data. Nucleic Acids Res.43, e40 (2015)
Love, M. I., Huber, W. & Anders, S. Moderated estimation of fold change and dispersion for RNA-seq data with DESeq2. Genome Biol.15, 550 (2014)
Chylek, L. A. et al. Phosphorylation site dynamics of early T-cell receptor signaling. PloS ONE9, e104240 (2014)
Schneider, C. A., Rasband, W. S. & Eliceiri, K. W. NIH Image to ImageJ: 25 years of image analysis. Nat. Methods9, 671–675 (2012)
Goeminne, L. J., Gevaert, K. & Clement, L. Experimental design and data-analysis in label-free quantitative LC/MS proteomics: a tutorial with MSqRob. J. Proteom.171, 23–36 (2018)
Yu, G. & He, Q.-Y. ReactomePA: an R/Bioconductor package for reactome pathway analysis and visualization. Mol. BioSyst.12, 477–479 (2016)
Wu, T. et al. clusterProfiler 4.0: a universal enrichment tool for interpreting omics data. Innovation2, 100141 (2021)
Szklarczyk, D. et al. The STRING database in 2023: protein–protein association networks and functional enrichment analyses for any sequenced genome of interest. Nucleic Acids Res.51, D638–D646 (2023)
Wickham, H. & Wickham, H. Data Analysis (Springer, 2016)
Larsson, J. eulerr: Area-proportional Euler and Venn diagrams. Comprehensive R Archive Network (CRAN)https://CRAN.R-project.org/package=eulerr (2026)
Kolde, R. pheatmap: Pretty heatmaps. Comprehensive R Archive Network (CRAN)https://doi.org/10.32614/CRAN.package.pheatmap (2019)
Gu, Z., Eils, R. & Schlesner, M. Complex heatmaps reveal patterns and correlations in multidimensional genomic data. Bioinformatics32, 2847–2849 (2016)
Yu, G. enrichplot: Visualization of functional enrichment result. Bioconductorhttps://doi.org/10.18129/B9.bioc.enrichplot (2025)
Conway, J. R., Lex, A. & Gehlenborg, N. UpSetR: an R package for the visualization of intersecting sets and their properties. Bioinformatics33, 2938–2940 (2017)
Perez-Riverol, Y. et al. The PRIDE database reences. Nucleic Acids Res.50, D543–D552 (2022)
Boel, F. Proteomic atlas of obesity (version 1.1.0). Zenodohttps://doi.org/10.5281/zenodo.16729496 (2026)
Acknowledgements
We thank V. Schwämmle for hosting the Shiny-based webtool associated with this study
Funding
This research received funding from the Danish National Research Foundation (grant no. DNRF141) awarded to the Center for Functional Genomics and Tissue Plasticity (ATLAS) and the Independent Research Fund Denmark (grant no. 1026-00013B). The proteomics work was supported by the INTEGRA MS research infrastructure established at SDU by a generous grant from the Novo Nordisk Foundation (grant no. NNF20OC0061575)
Author information
Authors and Affiliations
Department of Biochemistry and Molecular Biology, University of Southern Denmark, Odense, Denmark
Felix Boel, Ellen Gammelmark Klinggaard, Vyacheslav Akimov, Daniel Hansen, M. L. Uthpala, Babukrishna Maniyadath, Flora Reincke Fuglsang, Kim Ravnskjær, Susanne Mandrup & Blagoy Blagoev
Center for Functional Genomics and Tissue Plasticity (ATLAS), University of Southern Denmark, Odense, Denmark
Felix Boel, Ellen Gammelmark Klinggaard, Vyacheslav Akimov, Daniel Hansen, M. L. Uthpala, Babukrishna Maniyadath, Flora Reincke Fuglsang, Kim Ravnskjær, Susanne Mandrup & Blagoy Blagoev
Novo Nordisk Foundation Center for Basic Metabolic Research, Faculty of Health and Medical Sciences, University of Copenhagen, Copenhagen, Denmark
Marc Pielies Avellí & Simon Rasmussen
Authors
- Felix BoelView author publications
Search author on:PubMed Google Scholar
- Ellen Gammelmark KlinggaardView author publications
Search author on:PubMed Google Scholar
- Vyacheslav AkimovView author publications
Search author on:PubMed Google Scholar
- Daniel HansenView author publications
Search author on:PubMed Google Scholar
- M. L. UthpalaView author publications
Search author on:PubMed Google Scholar
- Babukrishna ManiyadathView author publications
Search author on:PubMed Google Scholar
- Flora Reincke FuglsangView author publications
Search author on:PubMed Google Scholar
- Marc Pielies AvellíView author publications
Search author on:PubMed Google Scholar
- Simon RasmussenView author publications
Search author on:PubMed Google Scholar
- Kim RavnskjærView author publications
Search author on:PubMed Google Scholar
- Susanne MandrupView author publications
Search author on:PubMed Google Scholar
- Blagoy BlagoevView author publications
Search author on:PubMed Google Scholar
Contributions
Conceptualization—F.B., E.G.K., S.M. and B.B.; proteomics laboratory work—F.B. and V.A.; animal work—E.G.K., B.M. and F.R.F.; immunohistochemical staining—D.H.; serum cholesterol measurements— M.L.U.; exploratory analysis—F.B. and M.P.A.; main data analysis and figures—F.B.; supervision of the study—B.B., S.M., K.R. and S.R.; and manuscript preparation
Ethics declarations
Competing interests
The authors declare no competing interests
Peer review
Peer review information
Nature Metabolism thanks Nathaniel Vacanti, Matthew Watt and the other, anonymous, reviewer(s) for their contribution to the peer review of this work. Primary Handling Editor: Revati Dewal, in association with the Nature Metabolism team. Peer reviewer reports are available
Additional information
Publisher’s note Springer Nature remains neutral with regard to jurisdictional claims in published maps and institutional affiliations
Extended data
Extended Data Fig. 1 Overview of mouse cohort
Body mass in grams (left), fat mass in grams (center), and body fat percentage (right). x-axis shows the number of weeks after the regression cohort reverted from a high-fat diet to a low-fat diet. Each time point shows the group mean, along with the standard error of the mean. Statistical comparisons were performed independently at each time point using a two-sided Welch’s t-tests with Benjamini-Hochberg correction. Adjusted P < 0.05 is indicated by an asterisk
Extended Data Fig. 2 Differential expression overview
Percentage of DEPs at each timepoint between the obesity regression group and age-matched lean control mice across all tissues using a free y-axis scale. OBE obese, STR short-term regression, MTR medium-term regression, LTR long-term regression
Extended Data Fig. 3 Overview of processes in most regulated tissues
Results from Reactome-based pathway enrichment analysis of DEPs found in obese mice
Extended Data Fig. 4 Transcriptomics- and protein-level agreement and enrichment in eWAT and iWAT
a,b, Scatter plots showing the gene-wise log2FC values (RNA vs protein) at each time point. Linear model R2 values are reported for each panel. Representative discordant proteins identified in obesity (OBE), Serpina1e, Apoc3, and Saa4, are labelled across time points. c, Pathway enrichment analysis of proteins increased at the protein level but decreased in RNA (‘protein up & RNA down’) across tissues and timepoints. Dot size indicates the number of proteins per pathway. Color represents BH-adjusted p-value. X axis shows the fold enrichment of pathways. d, STRING network plot of proteins that were upregulated at protein-level & downregulated in RNA. Nodes represent proteins, edges indicate STRING interactions (confidence > 0.4). The three largest interaction modules are shown in color where, (i) red shows a module of acute phase/lipoproteins, (ii) green shows a module of cytoskeleton/adhesion proteins, and (iii) blue shows a module of histones/chromatin proteins, while sparsely connected proteins are grouped as ‘Other’. Isolated proteins are omitted for clarity.
Extended Data Fig. 5 Discordant apolipoprotein regulation at the protein and RNA levels in adipose tissue and associated changes in circulating cholesterol
a, Protein-level and b, RNA-level log2 fold changes of selected apolipoproteins in eWAT and iWAT during obesity (Ob) and long-term regression (LTR), relative to age matched controls. c, Fed serum LDL/VLDL, HDL, and total cholesterol concentrations measured in lean and obese mice before regression of obesity and at after long-term regression. Bars represent mean ± SD, dots represent individual biological replicates (lean start, n = 3; lean long term, n = 3; obese start, n = 3; obese regressed, n = 4).
Extended Data Fig. 6 Validation of Hippo pathway-associated protein changes across tissues during long-term regression
Representative western blots and quantification of total and phosphorylated YAP and MOB proteins in a, bone, b, iBAT, c, kidney, and d, spleen from long-term regression (LTR) and age-matched lean control (LTC) mice. Phosphorylated YAP (p-YAP Ser127) and phosphorylated MOB1 (p-MOB1 Thr35) were assessed alongside corresponding total protein levels. Panels to the right show the quantification relative to the levels in LTR mice. Bars represent mean ± SD, dots represent individual biological replicates (n = 3 mice per group). GAPDH was used as loading control.
Source data
Extended Data Fig. 7 Altered PIP3 distribution in eWAT during obesity and regression
Representative images of PIP3 staining in epididymal white adipose tissue (eWAT) from lean control (LC), obese (OBE), and long-term regression (LTR) mice. Arrowheads indicate representative regions with detectable PIP3 signal. Obese animals displayed reduced PIP3 staining compared with lean controls, with partial recovery observed following regression. Nuclei are counterstained in blue. Scale bars, 100 µm (top panels) and 50 µm (bottom panels). The experiment was performed independently twice with similar results using biological replicates (LC, n = 3; OBE, n = 3; LTR, n = 2). Representative images are shown.
Extended Data Fig. 8 Reduced AKT phosphorylation during long-term regression
Representative western blots and quantification of phosphorylated AKT (p-AKT Ser473) and total AKT levels in epididymal white adipose tissue (eWAT) from long-term regression (LTR) and long-term lean control (LTC) mice. Panel to the right show the quantification relative to the levels in LTR mice. Bars represent mean ± SD, dots represent individual biological replicates (n = 3 mice per group). β-Actin was used as loading control
Source data
Supplementary information
Supplementary Information (download PDF )
Supplementary Figs. 1–17
Reporting Summary (download PDF )
Peer Review File (download PDF )
Supplementary Data 1 (download XLSX )
Metadata for all proteomic samples included in the study
Supplementary Data 2 (download XLSX )
Cohort characteristics for all mice included in the study
Supplementary Data 3 (download XLSX )
Proteomics data for bone
Supplementary Data 4 (download XLSX )
Proteomics data for brain
Supplementary Data 5 (download XLSX )
Proteomics data for duodenum
Supplementary Data 6 (download XLSX )
Proteomics data for eWAT
Supplementary Data 7 (download XLSX )
Proteomics data for heart
Supplementary Data 8 (download XLSX )
Proteomics data for iBAT
Supplementary Data 9 (download XLSX )
Proteomics data for iWAT
Supplementary Data 10 (download XLSX )
Proteomics data for kidney
Supplementary Data 11 (download XLSX )
Proteomics data for liver
Supplementary Data 12 (download XLSX )
Proteomics data for skeletal muscle
Supplementary Data 13 (download XLSX )
Proteomics data for pancreas
Supplementary Data 14 (download XLSX )
Proteomics data for serum
Supplementary Data 15 (download XLSX )
Proteomics data for small intestine
Supplementary Data 16 (download XLSX )
Proteomics data for spleen
Supplementary Data 17 (download XLSX )
Proteomics data for thymus
Supplementary Data 18 (download XLSX )
Merged proteomics dataset containing all tissues
Supplementary Data 19 (download XLSX )
Metadata corresponding to Supplementary Data 18
Supplementary Data 20 (download XLSX )
Summary of differential expression test statistics across all tissues and timepoints
Supplementary Data 21 (download XLSX )
Protein group annotations, including corresponding gene names and protein descriptions
Supplementary Data 22 (download XLSX )
GlyGly proteomics data from iBAT comparing OBE and LC mice
Source data
Source Data Extended Data Fig. 6 (download PDF )
Unprocessed western blots for Extended Data Fig. 6
Source Data Extended Data Fig. 8 (download PDF )
Unprocessed western blots for Extended Data Fig. 8
Rights and permissions
Springer Nature or its licensor (e.g. a society or other partner) holds exclusive rights to this article under a publishing agreement with the author(s) or other rightsholder(s); author self-archiving of the accepted manuscript version of this article is solely governed by the terms of such publishing agreement and applicable law
About this article
Cite this article
Boel, F., Klinggaard, E.G., Akimov, V. et al. Multi-organ proteomic atlas of obesity regression in male mice.
Nat Metab (2026). https://doi.org/10.1038/s42255-026-01599-5
Received:21 July 2025
Accepted:28 July 2026
Published:21 August 2026
Version of record:21 August 2026
DOI
:https://doi.org/10.1038/s42255-026-01599-5
