


Download PDF
Abstract
Rapid whole-genome sequencing (rWGS) enables timely diagnosis and management of critically ill patients, particularly in consanguineous populations with a high burden of recessive diseases. Here we report Little Falcon, a citywide rWGS program implemented within centralized neonatal and pediatric intensive care units in Dubai. In total, 100 critically ill patients from 18 Middle Eastern and Asian countries underwent trio rWGS with a median turnaround time of 3.4 days. The overall diagnostic yield was 53% (95% CI 43.3–62.5%), rising to 80% in consanguineous families (P < 0.001). Multiple molecular findings were identified in 12% of patients, including dual diagnoses (5%), while additional actionable findings included newborn screening-relevant variants (4%) and American College of Medical Genetics secondary or incidental findings (3%). rWGS led to clinically meaningful management changes in 53% of patients including those with (n = 45) or without (n = 8) molecular diagnoses, altering disease trajectories in 16%. Compared with a matched historical cohort of critically ill patients receiving standard genetic testing, rWGS significantly reduced diagnostic time (3.4 versus 38 days, P < 0.001), increased diagnostic yield (53% versus 30%, P < 0.01) and improved clinical management (53% versus 18%, P < 0.001). These findings support integrating rWGS into routine neonatal and pediatric intensive care units within a citywide <a href="https://healthylife7.com/in-iran-spiraling-health-costs-force-people-to-delay-care/” title=”In Iran, spiraling health costs force people to delay care”>healthcare system.
Subjects
- Consanguinity
- Genetics research
- Paediatrics
Rare diseases pose a substantial burden in neonatal and pediatric medicine. More than 7,000 distinct conditions have been identified, approximately 80% of which are genetic in origin and manifest predominantly in early childhood1. Collectively, they account for a disproportionate share of childhood mortality and morbidity worldwide2,3
In neonatal and pediatric intensive care units (NICU/PICU), rare genetic diseases are increasingly recognized contributors to critical illness and early death. Although estimates vary across studies, approximately 15–45% of critically ill children exhibit clinical features suggestive of an underlying genetic etiology4,5,6. Molecular investigations of infant mortality further reveal that 20–40% of infant deaths are attributable to genetic causes3,7,8,9,10, with approximately one-third of affected children dying before the age of 5 years1.
Nevertheless, many critically ill children remain undiagnosed during the narrow window in which early interventions could alter the course of disease and deliver life-long benefits11. Conventional diagnostic testing is typically sequential, slow and limited in scope, with results often taking weeks to several months to return, leaving many patients without a definitive molecular diagnosis, while delaying targeted management and treatment plans, and the overall clinical decision-making in intensive care settings4,11,12,13.
In recent years, rapid whole-genome sequencing (rWGS) has emerged as a powerful diagnostic tool in NICU/PICU, providing timely and comprehensive genomic insights that can directly inform clinical management13,14,15. Across multiple NICU/PICU cohorts in the USA, Europe and Australia, rWGS has achieved diagnostic yields of approximately 30–60% in critically ill children, with result turnaround times ranging from <24 h to 14 days13,15,16. Beyond diagnosis, rWGS consistently informed clinical actions, modifying therapeutic strategies, refining diagnostic plans, guiding procedures and supporting critical decisions regarding prognosis and care escalation or de-escalation17,18,19,20. Taken together, these findings have positioned rWGS as a transformative first-tier diagnostic modality in intensive care medicine, leading to its adoption at a national scale for the first time in the UK21.
While rWGS is gaining momentum globally, similar efforts remain largely absent in the Middle East. This absence is striking, given the region’s unique and underrepresented genomic architecture, marked by high rates of consanguinity, founder mutations and a disproportionate burden of rare recessive disorders22,23,24,25,26, features that strongly suggest rWGS could yield particularly high diagnostic and clinical value while generating genomic insights of substantial regional and global relevance27,28,29. Yet, despite this potential, implementation remains hindered by the considerable financial resources, specialized infrastructure and genomic expertise required30. As a result, critically ill children in this region continue to face persistent inequities in access to genomic-based care and precision medicine.
To address this gap, we report the region’s first citywide implementation of rWGS across neonatal and pediatric intensive care units centralized within Dubai Health, the city’s public healthcare system, which serve a diverse patient population of Middle Eastern, North African and Asian origins. We assess the diagnostic efficacy and clinical utility of rWGS in guiding management decisions for critically ill children in this setting and characterize the genomic landscape of life-threatening conditions in this high-burden cohort. Our study provides a model for rWGS implementation in similar large-scale healthcare systems.
Results
Implementation of a patient referral and rWGS workflow
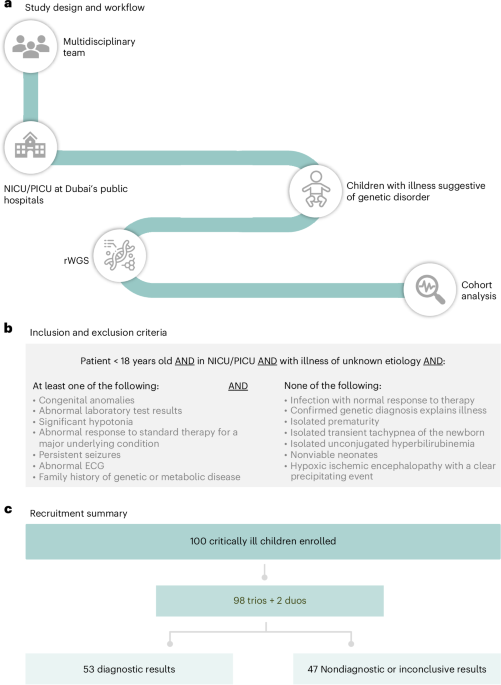
We established a cross-institutional referral network within Dubai Health to enable the implementation of rWGS for critically ill neonatal and pediatric patients (Fig. 1a). Neonatal referrals were primarily coordinated through the maternity center (Latifa Hospital), which hosts the central NICU. External referrals included ex utero and antenatal cases, with high-risk pregnancies directed to the fetal medicine center at Latifa Hospital. This enabled early identification of candidates for rWGS in the perinatal period. Critically ill pediatric patients beyond the neonatal period were referred through the central PICU at Al Jalila Children’s Hospital, ensuring coverage across the pediatric age spectrum within Dubai Health.
a, Children in NICU/PICU settings with suspected genetic disease were evaluated and recruited to a streamlined rWGS workflow overseen by a multidisciplinary clinical–genomic team. b, Clinical features used to identify NICU/PICU patients eligible for rWGS, alongside exclusion criteria applied to avoid nongenetic or clearly explained conditions (Methods). c, A flow diagram summarizing patient enrollment, sequencing structure and diagnostic outcome. HGDP, Human Genome Diversity Project; MCA, multiple congenital anomalies.
This referral workflow integrated a multidisciplinary clinical team comprising neonatologists, pediatricians and genetic counselors who jointly identified and referred eligible patients from the centralized NICU and PICU (~110 beds). Case selection was guided by predefined inclusion criteria (detailed in Fig. 1b; Methods), focusing on patients with suspected monogenic disorders where a rapid diagnosis was anticipated to inform acute clinical management. In addition to formal referral pathways, ad hoc case discussions between clinicians and the genetics team were frequently undertaken to rapidly assess eligibility. Genetic counselors were involved in all cases, while clinical or metabolic geneticists were consulted selectively on the basis of the clinical presentation and complexity of the case. Consistent with the gradual integration of rWGS and improved uptake, we observed a steady rise in patient enrollment over time (40 patients in year 1 to 73 patients in year 3) (Extended Data Fig. 1a), accompanied by a reduction in the time from admission to referral (median 7 days in year 1 to 5 days in year 3) (Extended Data Fig. 1b). The increased uptake and shorter referral interval are largely attributable to greater awareness of, and education about, the program and its inclusion criteria, as well as more established referral pathways. Eligible patients received pre-test counseling, during which a written informed consent was obtained by a genetic counselor before enrollment and sample collection.
In parallel, we established an end-to-end rWGS protocol to deliver testing within a clinically actionable timeframe under a genomic sequencing facility accredited by the College of American Pathologists (CAP). A dedicated multidisciplinary laboratory team—including molecular technologists, genomic scientists, bioinformaticians, genetic counselors and clinical molecular geneticists—was assembled to oversee all stages of the workflow following case selection. This encompassed sample processing, sequencing, bioinformatic analysis and variant interpretation in accordance with the American College of Medical Genetics and Genomics (ACMG)/Association for Molecular Pathology (AMP) guidelines, as well as integration of clinical and genomic data for diagnostic reporting. Pathogenic or likely pathogenic variants consistent with the gene-disease mechanism, mode of inheritance and patient phenotype were considered diagnostic and were often confirmed by the clinical team. To facilitate rapid clinical decision-making, results were communicated by genetic counselors to the treating clinical team immediately upon completion of analysis. Ad hoc interdisciplinary discussions were also held during the analysis phase, particularly for complex or uncertain findings, to support consensus-driven variant interpretation and clinical correlation.
The program was initially co-sponsored by Dubai Health and Illumina for enabling infrastructure development, capacity building and early implementation. Thereafter, with the continuous reduction in sequencing costs, the program is transitioning to a sustainable funding model, with government coverage for UAE nationals and support for non-nationals provided through insurance or philanthropic organizations, including the Al Jalila Foundation within Dubai Health
This study includes data from the first 100 consented families (Supplementary Table 1). rWGS was performed as proband–parent trios (n = 98), except for two patients in which paternal samples were unavailable (and were therefore analyzed as duos) (Fig. 1c). Patients and their parents underwent short-read sequencing to an average coverage of >30× across the genome (Extended Data Fig. 2 and Supplementary Table 2)
Patient demographics and clinical characteristics
The median age at presentation was 17 days (interquartile range (IQR) 0–151 days) (47% females), with 53% being neonates and 87% less than 1 year of age (Fig. 2a). Sequencing was frequently undertaken within the first weeks of life, reflecting a predominance of early-onset, clinically severe genetic disorders that manifest at, or shortly after, birth. Among all, 62 patients were referred from the NICU while 38 were from the PICU (Supplementary Table 3). Half of patients presented with phenotypes affecting a single system, with metabolic (n = 15), neurologic (n = 10) and cardiovascular (n = 8) presentations being most recurrent, while the remainder exhibited multiple congenital anomalies (MCAs) or complex multisystemic presentations (Fig. 2b). However, we note that most patients with MCAs presented in the NICU, while relatively more patients with neurologic presentations were referred from PICU (Supplementary Table 3). Consistent with the multicultural demographics of Dubai31, self-reported parental nationalities represented 18 countries, predominantly of Middle Eastern (61%) and Asian (36%) origins (Fig. 2c).
a, Violin plots with individual data points showing the age at presentation by sex and for the overall cohort. Median age is annotated for each group and the dashed line indicates the proportion of patients presenting within the first year of life. b, The distribution of primary clinical indications prompting rWGS, categorized as single-system disorders, multisystemic disorders or MCAs. Each patient was assigned to one primary indication category. c, A sunburst plot illustrating cohort composition by ethnicity (inner ring) and nationality (outer ring). d, PCA showing study probands projected onto the HGDP reference populations. Colored circles represent HGDP superpopulations and black crosses indicate probands in this study. e, Violin plots showing the distribution of coefficients of relatedness stratified by inferred parental relationship categories: unrelated (<0.2%), shared ancestry (0.2–4%) and consanguineous (>4%), alongside the total cohort. Individual points represent probands, with medians indicated above each group. Percentages and sample counts for each category are shown along the x axis.
Source data
To explore the genetic ancestry of our samples, we projected them onto principal components generated from a reference set of Human Genome Diversity Project (HGDP) populations32 (Fig. 2d). The majority of samples clustered within the variation of Middle Eastern or South Asian populations, with a minority showing East Asian-related ancestry. A subset of samples showed notable sub-Saharan-related African ancestry, consistent with known admixture in contemporary Middle Eastern and South Asian groups33. Model-based clustering using ADMIXTURE confirmed the patterns found in the principal component analysis (PCA) (Extended Data Fig. 3).
Genomic analysis also showed that 52% of patients demonstrate evidence of parental relatedness, at variable degrees, ranging from distant shared ancestries (16.3%) to close consanguineous unions (35.7%) such as double first cousins (Fig. 2e). Parental relatedness rates among Middle Eastern families reached 52.5%, aligning with well-recognized marriage traditions in the region (Extended Data Fig. 4). Notably, Asian families scored similarly high rates (55.8%), largely driven by Pakistani families, who share similar consanguineous marriage practices34 (Extended Data Fig. 4).
Time to reporting
The median turnaround time from sample submission to reporting was 81.1 h (IQR 69.9–108.6 h), equivalent to 3.4 calendar days, with the fastest time to results being 47.7 h. Sequencing and bioinformatics analysis accounted for the largest proportion of total turnaround time (median 51.7 h, IQR 46.7–68.7 h) (Fig. 3a). Turnaround times were generally tightly clustered across samples, with limited inter-sample variability observed (Fig. 3b)
a, A schematic overview of the end-to-end rWGS pipeline, including DNA extraction, library preparation, sequencing, alignment, variant calling, annotation and clinical interpretation, with median processing times for major stages shown. b, The elapsed time for individual cases, partitioned by major workflow stages represented by different bar colors as shown in a. Panel a created in BioRender; Rabea, F. https://biorender.com/k6jv4g3 (2026)
Source data
Diagnostic outcomes
Out of the 100 enrolled patients, 53 received at least one molecular diagnosis related to the primary presentation, yielding an overall diagnostic rate of 53% (95% CI 43.3–62.5%) (Fig. 4a). The diagnostic yield was comparable between NICU (32/62; 51.6%) and PICU (21/38; 55.3%) patient groups (Supplementary Table 3). Five patients (5%) had dual molecular diagnoses where two or more pathogenic variants or genomic alterations affecting distinct loci jointly contributed to the phenotype (Fig. 4b). For instance, a 3-month-old infant (F32) admitted to the PICU owing to infantile spasms was found, within 83 h by rWGS, to harbor a homozygous pathogenic variant in SLC19A3 (HGNC: 16266) and likely pathogenic compound heterozygous variants in BTD (HGNC: 1122) consistent with thiamine metabolism dysfunction syndrome 2 (MIM no. 607483) and Biotinidase Deficiency (MIM no. 253260), respectively. Both conditions are responsive to oral biotin and thiamine therapy, highlighting both the multilayered complex diagnoses in this setting, and the importance of rWGS in supporting timely treatment plans. Among patients with dual diagnoses, phenotypes were overlapping in four patients (F20, F32, F57 and F91) but distinct in one patient (F85) (Supplementary Table 4).
a, The proportion of diagnostic, inconclusive and nondiagnostic outcomes among tested patients. b, The breakdown of cases with additional molecular findings. c, The proportion of cases achieving a molecular diagnosis within each primary clinical indication category. Percentages and numbers of diagnosed cases are indicated. Note: indications with at least five patients are displayed. d, The diagnostic yield of rWGS stratified by inferred parental relatedness categories. Percentages and counts of diagnosed cases are shown for each group. Pairwise comparisons between each relatedness category and the unrelated group were performed using two-sided Fisher’s exact tests with Bonferroni correction for multiple comparisons. Bonferroni-adjusted P values were 0.000137 (consanguineous versus unrelated), 0.000670 (consanguineous or shared ancestry versus unrelated) and 0.436 (shared ancestry versus unrelated). Statistical significance is indicated by ***P < 0.001. e, The distribution of conditions’ inheritance modes among diagnosed cases, including autosomal recessive, autosomal dominant, X-linked and chromosomal anomalies. Counts and percentages reflect primary diagnoses only (58 diagnoses in 53 patients, including 5 with dual conditions). Percentages and case counts are shown for each category. f, A sunburst plot summarizing the spectrum of detected variants, grouped by major variant class (inner ring) and specific variant types (outer ring). Percentages indicate the relative contribution of each category among all reported variants. Counts and percentages reflect variants identified within primary group diagnoses only (63 variants underlying the 58 primary diagnoses shown in e, 5 of which were due to compound heterozygous variants).
Source data
In addition, seven patients (7% of all cohort) had eight actionable molecular findings unrelated to the primary indication, including five newborn screening (NBS)-relevant findings in four patients (4%), two ACMG-designated secondary findings in two patients (2%) and an incidental finding in one patient (1%) (Fig. 4b and Supplementary Tables 1 and 4). All these patients had diagnostic variants underlying their primary disease, but were pre-symptomatic for the nonprimary conditions at the time of testing (Supplementary Table 4).
Diagnostic yield varied across clinical indication categories, with the highest observed in metabolic disorders at 80% (Fig. 4c). Yield was also statistically significant among children born to consanguineous parents, with rWGS establishing a molecular diagnosis in 80% of those cases (28/35), more than double the yield (34%) observed in children of unrelated parents (16/47) (Fisher’s exact test, P < 0.001) (Fig. 4d)
Genomic landscape
A total of 58 primary diagnoses in 53 patients (including 5 with dual findings) were reported in our cohort (Fig. 4e). Consistent with the observed parental relatedness pattern, most diagnoses (41/58 or 70.7%) were attributable to autosomal recessive conditions, mostly driven by homozygous variants (62.1%) (Fig. 4e). Recessive disorders were significantly enriched among children born to consanguineous families compared with those from unrelated unions (93% versus 50%; Fisher’s exact test, P < 0.01) (Extended Data Fig. 5). By contrast, autosomal dominant disorders represented 13.8% (8/58), with comparable distribution of inherited and de novo pathogenic variants, while X-linked conditions represented 3.4% (2/58). rWGS also identified chromosomal anomalies, ranging from small copy number changes to aneuploidies, accounting for 12.1% (7/58) of diagnoses (Fig. 4e). It is important to note that most dominant conditions and those associated with chromosomal anomalies were identified in NICU patients (Supplementary Table 3).
Of the 63 variants underlying the 58 primary diagnoses (Fig. 4e,f), single nucleotide variants (SNVs) and small insertions and deletions (INDELs) represented 84.1% (Supplementary Table 5), while larger variants constituted 15.9% (Supplementary Table 6). Of the 56 intragenic diagnostic variants (53 SNVs/INDELs and 3 small intragenic copy number variants (CNVs)), 20 were novel while 36 were previously reported, spanning 50 known disease-associated genes (Supplementary Tables 5 and 6). This distribution highlights the marked genetic heterogeneity underlying diseases in the cohort, with TRAPPC12 (HGNC: 24284) being the only gene implicated in more than one patient; the same pathogenic variant (NM_016030.6 (TRAPPC12):c.1603+5G>C;p.?) was identified in both cases.
Alongside molecular diagnostic findings, 60% of patients were carriers of at least one recessive condition, providing important reproductive screening implications in this high burden population (Supplementary Tables 1 and 5). Recurrent carrier findings involved genes associated with hemoglobinopathies and metabolic disorders, including HFE (HGNC: 4886), HBB (HGNC: 4827), MEFV (HGNC: 6998), G6PD (HGNC: 4057), GALT (HGNC: 4135) and BTD (HGNC: 1122). Furthermore, 67% of patients harbored at least one pharmacogenomic variant associated with Food and Drug Administration-approved drug responses (Supplementary Tables 1 and 7). The most frequently encountered gene was CYP2D6 (*4, *17 and *41 alleles), followed by CYP2C9 (*2 and *3 alleles). CYP2D6 alleles are known to influence metabolism across multiple therapeutic classes, including antiarrhythmics, analgesics, antipsychotics, antihypertensives, psychostimulants and selected anticancer and antidepressant agents. Conversely, CYP2C9 alleles impact dosing and toxicity risk for certain anticoagulants and antiepileptic agents. These pharmacogenomic findings were not utilized to guide clinical management in this cohort, as they were not directly relevant to patients’ acute clinical presentations at the time of testing. However, all identified variants were documented in patients’ electronic medical records to inform future relevant therapeutic decision-making.
Clinical utility
Beyond diagnostic clarification, rWGS was associated with clinically meaningful shifts in care trajectory in 53% of critically ill patients (53/100), including those with (45 out of 53; 85%) or without (8 out of 47; 17%) molecular diagnoses (Fig. 5a and Supplementary Table 1), where rWGS informed time-sensitive therapeutic, procedural and prognostic decisions during periods of substantial physiologic instability in this setting. Across the cohort, rWGS findings were associated with targeted pharmacologic or dietary intervention in 36% of patients (Supplementary Table 8), procedure- or surgery-defining decisions in 13%, consolidation of diagnostic pathways in 43%, subspeciality referrals in 37% and redirection toward palliative care in 9% (Fig. 5b and Supplementary Table 1).
a, The proportion of cases in which rWGS findings led to changes in clinical management, stratified by diagnostic and nondiagnostic results, versus no change. b, A heat map summarizing the types of clinical actions influenced by rWGS results. Rows represent individual cases (with case number and affected gene/locus shown on the side), with color indicating whether changes were driven by positive or negative rWGS findings. Aggregate proportions of cases within each management category, out of the overall cohort, are shown on top. AND, allowing natural death.
Source data
To further assess the impact of rWGS on care management, we adapted the recently published Clinician-reported Genetic testing Utility InDEx questionnaire in ICU (C-GUIDE ICU) to score impacts across ten clinical domains (0–2 points per domain, with higher scores correlating with higher clinical utility) for each patient35. Clinical domains included timely diagnostic, prognostic, therapeutic and management insights (Methods; Supplementary Table 9). Cumulative scores across the cohort ranged from 2 to 16, with a median of 9. Scores were consistently higher among genetically diagnosed patients relative to those who were undiagnosed (median 12 versus 2, P < 0.00001), suggesting that, overall, rWGS translated diagnostic resolution into immediate therapeutic and prognostic action during periods of critical physiologic vulnerability.
In addition to improving care trajectories in 53% of patients, rWGS led to immediate changes in disease trajectories in 16% of patients, where rWGS-triggered management plans led to favorable outcomes (8%) or end-of-life decisions (8%). We summarize all those cases in Supplementary Table 10 and we here highlight illustrative examples. In a 2-week-old ventilator-dependent newborn with recurrent apneic episodes (F42), rapid identification of a pathogenic variant in PHOX2B (HGNC: 9143) established congenital central hypoventilation syndrome (MIM no. 209880) within 72.7 h, permitting early definitive airway planning and transition from recurrent reactive attempts at stabilization to structured long-term ventilatory management.
In an 18-day-old infant with persistent severe hypoglycemia requiring high-concentration dextrose infusion (F64), genotype-directed classification of ‘focal’ ABCC8-associated disease by rWGS within 55 h supported early definitive surgical intervention, to remove focal pancreatic lesions, without prolonged empiric medical management, limiting sustained exposure to reliance on high-concentration glucose infusion and predisposition to potential recurrent hypoglycemic instability during the diagnostic interval.
In a 2-month-old infant presenting with abdominal distention, adrenal calcifications and evolving disease deterioration (F81), rWGS established a Wolman disease (MIM no. 620151) diagnosis due to a homozygous exonic deletion in the LIPA gene (HGNC: 6617) within 50.6 h. This enabled initiation of enzyme replacement therapy and dietary modification even before completion of conventional biochemical testing. Untreated infantile Wolman disease is characterized by rapidly progressive hepatic dysfunction, intestinal failure, systemic inflammatory complications and high mortality within the first year of life. Early initiation of disease-modifying therapy during this critical phase stabilized clinical progression and redirected management toward sustained enzyme replacement-based care rather than progression toward the expected fulminant course.
rWGS also provided prognostic clarification in severe neurodevelopmental disease. In a newborn with hydranencephaly and complex congenital anomalies (F77), identification of a homozygous pathogenic variant in TRAPPC12, within 80 h, established a progressive encephalopathy (MIM no. 617669) with poor anticipated neurologic outcome. Rapid genomic confirmation informed timely goals-of-care discussions and alignment of treatment intensity with expected disease trajectory, avoiding escalation of invasive life-sustaining interventions unlikely to alter outcome.
Clinical impact was observed not only in patients with positive diagnoses but also in a subset with negative genomic results (n = 8), where exclusion of a monogenic etiology narrowed the differential diagnosis and curtailed further invasive investigation. In a 5-month-old infant (F44) (Supplementary Table 1) on diazoxide therapy for presumed hyperinsulinemic hypoglycemia, rWGS results were negative, within 89.7 h, ruling out possible implicated genes and confirming a diagnosis of a nongenetic transient neonatal hyperinsulinemia, leading to diazoxide discontinuation, and avoiding additional diagnostic evaluations in this infant whose glucose levels gradually normalized.
Finally, beyond direct impact on patient management, the autosomal recessive inheritance pattern of the diagnostic variants in most positive families (~70% of all positives and 93% of those who are consanguineous), in our context, enabled reproductive counseling of parents who were offered pre-implementation genetic testing or prenatal diagnosis to mitigate the 25% recurrence risk for future affected pregnancies
rWGS versus standard-of-care testing
To compare the diagnostic efficacy (yield and time-to-diagnosis) and clinical utility of rWGS to that of standard-of-care testing in critically ill patients, we established a retrospective control cohort of infants and children (n = 100) admitted to the NICU/PICU during the period preceding rWGS implementation (2018–2022) (Supplementary Table 11). Patients were randomly selected from a group of critically ill patients who were referred for genetic testing from NICU/PICU and whose clinical presentations suggest a possible genetic etiology according to the eligibility criteria for rWGS. This selection process was otherwise blind to all other variables, including genetic and clinical outcomes.
The median age at presentation in this control group was 7 days (IQR 0–107 days), with 89% being under the age of 1 year, and with equal sex distribution (53% females and 47% males) (Fig. 6a). The spectrum of clinical indications was comparable to the rWGS cohort, with 54% presenting with single-system disorders and 46% presenting with multisystem disorders or multiple congenital anomalies (Fig. 6b and Supplementary Table 12). Similarly, ethnic composition was primarily Middle Eastern and Asian at 69% and 22%, respectively (Fig. 6c). No statistically significant differences were observed between the rWGS and control cohorts across these demographic and clinical variables (Supplementary Table 12).
The rWGS and control cohorts each comprised 100 independent patients (n = 100 per cohort). All analyses were performed at the patient level, with each observation representing one patient; no technical replicates were included. a, Violin plots with individual data points show age at presentation by sex and for the overall control cohort. Median age is annotated for each group and the dashed line indicates the proportion of patients presenting within the first year of life. b, The distribution of primary clinical indications prompting genetic testing in the control cohort, categorized as single-system disorders, multisystemic disorders or multiple congenital anomalies. Each patient was assigned to one primary indication category. c, The distribution of the control cohort by broad self-reported ethnic grouping. d, The number and type of genetic tests performed per patient in the control cohort. Each vertical bar represents one patient, and stacked segments indicate the types of tests performed. e, The diagnostic turnaround time (days) in the rWGS and control cohorts. Box plots show the median (center line), IQR (bounds of box represent the 25th–75th percentiles) and minimum and maximum values (whiskers). Groups were compared using a two-sided Wilcoxon rank-sum test; P < 2.2 × 10⁻¹⁶. Statistical significance is indicated by ***P < 0.001. f, The diagnostic yield comparison between the rWGS and control cohorts. Percentages of diagnosed cases are shown for each cohort. Groups were compared using a two-sided Fisher’s exact test; P = 0.0015. Statistical significance is indicated by **P < 0.01. g, A comparison of the proportion of patients in whom genetic testing resulted in a change in clinical management between the rWGS and control cohorts. Groups were compared using a two-sided Fisher’s exact test; P = 3.4 × 10⁻⁷. Statistical significance is indicated by ***P < 0.001.
Source data
Diagnostic evaluations in the control group often involved multiple, sequential genetic tests spanning different strategies. While most patients underwent one investigation, 23% required additional tests, often progressing from cytogenetic analysis to exome-based sequencing approaches (Fig. 6d). This testing paradigm was associated with significantly prolonged diagnostic timelines (median 38 days (IQR 23–53 days) versus 3.4 days (IQR 2.9–4.5 days); Mann–Whitney U test, P < 0.001) and lower diagnostic yield (30% (95% CI 21.3–40.2%) versus 53% (95% CI 43.3–62.5%); Fisher’s exact test, P < 0.01) relative to rWGS (Fig. 6e,f). Changes in clinical management were also significantly lower in control cases relative to the rWGS cohort (18% versus 53%, 95% CI for controls 11.1–27.4%, P < 0.001) (Fig. 6g). Compared with patients who received rWGS, the C-GUIDE ICU scores were also significantly lower in control cases (median 9 versus 0, P < 0.00001) (Supplementary Table 9), highlighting the added impact of rWGS on clinical management in intensive care units.
Discussion
This study represents the first citywide implementation of rWGS across NICUs and PICUs in a Middle Eastern population and provides the operational and clinical evidence required to support its adoption as a first-tier diagnostic modality for critically ill children in the region. Through a centralized referral network, supported by genetic counseling and multidisciplinary teams, and close clinical–laboratory coordination, the program achieved seamless integration into acute-care workflows, demonstrated robust diagnostic performance and delivered measurable clinical impact in a population characterized by high consanguinity and a considerable burden of autosomal recessive disease. Its successful incorporation within Dubai’s healthcare infrastructure establishes a scalable framework for other regional systems seeking to embed genomic medicine within time-sensitive critical care environments.
Rapid, comprehensive genome-wide interrogation enables delineation of complex molecular architectures, including multi-locus pathogenic variation and blended phenotypes, which may be missed by targeted panels, sequential single-gene testing or nongenetic investigations such as biochemical or enzymatic assays. For example, rWGS established earlier diagnoses of lysosomal disorders than enzyme testing, including Wolman disease (F81), permitting treatment to commence approximately 2 weeks before enzymatic confirmation. Furthermore, rWGS identified dual molecular diagnoses, including, for instance, GLB1 and TRAPPC12 in patient F57, demonstrating its ability to resolve complex or overlapping phenotypes. Patient F93 presented with hydrops fetalis, a phenotype associated with a broad differential diagnosis in which lysosomal disorders represent only one possibility. Conventional evaluation would have required multiple enzymatic assays, many of which are technically challenging, unstable and associated with turnaround times of approximately 1 month. By contrast, rWGS established a diagnosis of sialidosis (NEU1) within 7 days. Similarly, rWGS provided precise molecular subtyping of methylmalonic aciduria, identifying cobalamin B (MMAB) and C (MMACHC) disease in patients F13 and F10, respectively, enabling genotype-directed management without the delays associated with cofactor response testing.
More broadly, the wide spectrum of genetic disorders identified in this cohort underscores the limitations of phenotype-driven targeted testing in critically ill children, who frequently presented with nonspecific features such as encephalopathy, acidosis or sepsis-like illness. These presentations encompass an exceptionally broad and heterogeneous differential diagnosis that cannot be reliably narrowed on clinical grounds alone, even by experienced clinicians. No sequential targeted testing strategy can realistically capture this breadth within a clinically actionable timeframe. Consequently, rWGS functions not only as a comprehensive diagnostic test but also as a diagnostic safety net, identifying disorders that would otherwise remain unsuspected and providing a level of diagnostic breadth that targeted approaches cannot replicate.
The diagnostic yield observed in this cohort falls within the upper range reported by major international rWGS initiatives, including Project Baby Bear36, the NSIGHT Consortium17,37,38, the Australian Acute Care Genomics Program39,40, NHS England’s national rWGS service41, the GEMINI Study42 and the NICUSeq Study43. Achieving comparable performance in a genetically diverse and historically underrepresented population underscores the generalizability of rWGS beyond predominantly European-ancestry cohorts. However, the underlying genetic architecture in our cohort differs markedly from these studies. Across these same cohorts, which are largely derived from outbred populations with relatively lower reported consanguinity (3–20%), autosomal dominant and de novo variants typically account for 50–85% of diagnoses, whereas recessive conditions comprise 10–25% (refs. 37,38,40,42,43). By contrast, our cohort was predominantly characterized by recessive conditions (~70%), largely driven by homozygous variants. Accordingly, our diagnostic yield was significantly enriched among children from consanguineous families, reinforcing the particular utility of rWGS in populations with elevated rates of autosomal recessive disease, with important implications for prevention through reproductive counseling in affected families.
Beyond diagnostic performance, we demonstrate clinical benefit through detailed case-by-case evaluation of disease trajectories, documenting how genomic findings precipitated changes in management, therapeutic decision-making, subspecialty referral and goals-of-care discussions. To contextualize these outcomes, we compared the rWGS cohort with a matched historical cohort referred for standard-of-care genetic testing from NICU/PICU within the same healthcare system. rWGS was associated with significantly higher diagnostic yield, greater documented clinical utility, and substantially reduced turnaround time.
Several limitations merit consideration. Middle Eastern populations remain underrepresented in global genomic reference datasets, and widely used variant databases are disproportionately weighted toward European ancestry44,45. This imbalance constrains available pathogenicity evidence for region-specific alleles and may bias variant interpretation toward conservative classification. Consequently, the diagnostic yield and burden of pathogenic variation reported here probably represent a lower bound of the true Mendelian disease burden in this setting. These findings highlight the imperative to expand ancestrally diverse reference resources and to integrate data from underrepresented populations into global variant interpretation frameworks.
Our eligibility criteria focus on conditions where rWGS could have direct impact on patient’s health, limiting its benefits to critical care while excluding utility beyond this setting. For example, the exclusion of nonidentify pathogenic variants associated with lethal genetic conditions; information which families can utilize to avoid future recurrence
A major historical barrier to implementing rWGS in critical care has been the perceived high cost of sequencing. While our study was intentionally designed to focus on feasibility, clinical utility and capacity building rather than formal cost–effectiveness analysis, we contend that sequencing cost is no longer a primary limitation in this context. As sequencing and analytical technologies continue to advance, costs also continue to decline substantially. Earlier studies reported a median rWGS cost of US$9,239 per proband (range US$6,300–US$16,063) and a median cost per diagnosis of US$23,602 (range US$14,072–US$37,480)4,17,19,36,42,46,47,48,49,50. By contrast, the current cost of rWGS in our setting, benchmarked against commercial laboratories in the USA, is approximately US$3,500 per case, resulting in a cost per diagnosis of US$6,603 in our cohort. This is markedly lower than prior reports, even though those earlier studies still demonstrated overall cost savings per patient despite higher sequencing expenses.
Preliminary analysis of our cohort further suggests that rWGS may be economically favorable when broader healthcare expenditures are considered. In addition, economic modeling using published cost estimates suggests that accelerated diagnosis through rWGS is likely to generate considerable savings by reducing the financial burden of diagnostic delay. Beyond direct patient care savings, rWGS may also provide substantial long-term economic benefits through reproductive counseling and prevention, given the nature of recessive inheritance, and the associated 25% recurrence risk, in most diagnoses in our population. We therefore posit that rWGS is no longer operationally cost-prohibitive in critical care settings and may, in fact, offer substantial clinical and economic value through reduced hospitalization costs, faster diagnosis and downstream prevention benefits. Hence, although implementing rWGS still requires notable initial capital investment to establish genomics capabilities, strengthen NICU and PICU infrastructure and build a skilled multidisciplinary workforce, healthcare institutions should consider its potential to generate long-term economic and clinical benefits.
Notwithstanding these limitations, our findings position rWGS as more than a diagnostic adjunct for critically ill children. It functions as an integrated clinical instrument capable of accelerating molecular etiologic resolution, informing precision therapeutics, guiding subspecialty referral and shaping longitudinal care pathways within time-sensitive settings. In a region marked by pronounced genetic diversity and elevated consanguinity, first-tier rWGS represents both a precision-medicine advance and a systems-level innovation, with implications that extend beyond individual patient encounters to the design of sustainable genomic care models.
Methods
Ethics
The Little Falcon Study was approved by Mohammed Bin Rashid University institutional review board (MBRU IRB no. DAHC-MBRU-IRB-2023-008) and the Dubai Scientific Research Ethics Committee (DSREC-08/2025_17). Following genetic counseling, a written informed consent was obtained from parents for participation in the study. All participants consented to the sharing and publication of their sequencing and clinical data
Study design and participants
We assembled a multidisciplinary team, comprising molecular biologists, genomic scientists, bioinformaticians, pediatricians, neonatologists and genetic counselors, to work collaboratively across all stages of the workflow, from case selection and patient consenting to sequencing, data analysis, variant interpretation, return of results and cohort-level analyses (Fig. 1a)
Critically ill infants or children were prospectively identified by the NICU or PICU teams at Dubai’s public hospitals. Inclusion and exclusion criteria were based on the Blue Shield of California Medical policy 2.04.102 as outlined below and briefly summarized in Fig. 1b and ref. 51
Patients were eligible for rWGS if they were less than 18 years of age and were hospitalized in the NICU or PICU with an illness of unknown etiology, and:
- (1)
Had at least one of the following:
- a.
Multiple congenital anomalies
- b.
Specific malformations highly suggestive of a genetic etiology, including but not limited to one or more of the following:
- i.
Coloboma
- ii.
Choanal atresia
- iii.
Meconium ileus
- iv.
Hirschsprung disease
- i.
- c.
An abnormal laboratory test suggesting a genetic disease or a complex metabolic phenotype, including but not limited to one or more of the following:
- i.
Abnormal NBS results
- ii.
Conjugated hyperbilirubinemia not due to total parental nutrition cholestasis
- iii.
Hyperammonemia
- iv.
Lactic acidosis not due to poor perfusion
- v.
Refractory of severe hypoglycemia
- i.
- d.
An abnormal response to standard therapy for a major underlying condition
- e.
Significant hypotonia
- f.
Persistent seizures
- g.
Infant with high-risk stratification on evaluation for a brief resolved unexplained event with one or more of the following:
- i.
Recurrent events without respiratory infection
- ii.
Recurrent witnessed seizure-like events
- iii.
Required cardiopulmonary resuscitation
- iv.
Significantly abnormal chemistry, including but not limited to electrolytes, biocarbonate or lactic acidosis, venous blood gas, glucose or other abnormal test results suggestive of an inborn error of metabolism
- i.
- h.
Significantly abnormal electrocardiogram, including but not limited to possible channelopathies, arrhythmias, cardiomyopathies, myocarditis or structural heart disease
- i.
Family history of one or more of the following:
- i.
Arrhythmia
- ii.
Brief resolved unexplained event in sibling
- iii.
Developmental delay
- iv.
Inborn error of metabolism or genetic disease
- v.
Long QT syndrome
- vi.
Sudden unexplained death (including unexplained car accident or drowning) in first- or second-degree family members before age 35 years, and particularly as an infant
- i.
AND
- a.
- (2)
All of the following have been excluded as a reason for admission:
- a.
An infection with normal response to therapy
- b.
Confirmed genetic diagnosis explaining illness
- c.
Hypoxic ischemic encephalopathy with a clear precipitating event
- d.
Isolated prematurity
- e.
Isolated transient tachypnea of the newborn
- f.
Isolated unconjugated hyperbilirubinemia
- g.
Nonviable neonates
- a.
rWGS was performed for 100 consented patients, mostly as proband–parent trios (n = 98), except for two duo cases in which paternal samples were unavailable (Fig. 1c)
To provide a benchmark for comparison, we established a retrospective control cohort of infants and children (n = 100) admitted to the NICU/PICU during the period preceding rWGS implementation (Supplementary Table 11). Patients were randomly selected from a larger group of critically ill patients referred to genetic testing for standard-of-care testing, before Little Falcon implementation, with clinical presentations suggesting a possible genetic etiology according to the eligibility criteria for rWGS. The patients’ selection process was otherwise blind to other variables including demographics, genetics and clinical outcomes. Subsequently, demographic, clinical and diagnostic data were extracted from the electronic medical record. This cohort served as a baseline internal reference against which variables from the rWGS cohort were evaluated, enabling assessment of differences potentially attributable to the introduction of rWGS.
Clinical indications
Clinical indications for rWGS were categorized into 12 major categories on the basis of the primary system(s) involved. Patients presenting with overlapping neurological and neurodevelopmental features were combined into a single ‘neurological’ category. Cases involving abnormalities spanning two or more organ systems were classified under a separate ‘multisystemic’ category
Sample collection
Peripheral blood samples (1–3 ml) were collected from each patient and their parents in EDTA tubes and delivered to our CAP-accredited Dubai Health Genomic Medicine Center within Al Jalila Children’s Specialty Hospital
DNA extraction
Genomic DNA was extracted from peripheral whole blood using the QIAsymphony DSP DNA Kit (Qiagen) and QIAsymphony nucleic acid purification instrument (Qiagen), according to the manufacturer’s instructions
rWGS
Around 500–1,000 ng of genomic DNA was used to prepare the sequencing libraries following the Illumina DNA PCR-Free library preparation protocol (Illumina) as described previously52. In brief, an initial DNA tagmentation step using bead-linked transposomes was carried out, during which DNA was simultaneously fragmented and tagged with adapter sequences. Following index ligation, final libraries were purified by a double-sided bead purification procedure and then quantified to a final loading concentration of 2 nM using the Qubit ssDNA Assay Kit (Thermo Fisher Scientific). Final libraries from each family were pooled and sequenced using paired end mode (2 × 150 bp) on an S1 flow cell and the NovaSeq 6000 system (Illumina) to generate, on average, 182 GB of data and an autosomal coverage of >30× (Extended Data Fig. 2 and Supplementary Table 2).
Demultiplexing of sequencing data was performed using the BSSH BCL2Convert application53 (version 2.20). The resulting FASTQ files were aligned to the reference genome GRCh38 (GCA_000001405.15), and variant calling was carried out using the DRAGEN pipeline54 (version 4.2.7). In addition to SNVs and INDELs, the DRAGEN pipeline called structural variants (SVs), CNVs, mitochondrial variants, repeat expansions, SMN1/SMN2 variants and regions of homozygosity (ROH)
Identified variants were subsequently annotated in Emedgene55 (version 36.0) using multiple components, primarily including gnomAD 4.1, ClinVar (2025-07-06), OMIM (2025-08-20), DECIPHER 9.30, dbSNP 155 and ClinGen (2025-08-21). These annotations provide insights related to a variant’s prevalence in the population, potential involvement in human disease and phenotypes, and predicted impact to protein function
Following annotation, variants were filtered and prioritized using Illumina ‘general’ and ‘Emedgene’ filtering strategies (Extended Data Fig. 6). The latter takes into consideration, among other features, protein effect, inheritance model and, most importantly, patient phenotype to rank variants. We evaluated small (SNVs and INDELs) and large variants (SVs, CNVs, ROH, and short tandem repeats or STR) retained through the ‘general’ filtering strategy. Rare (<0.01 minor allele frequency), high quality variants consistent with recessive or de novo inheritance were retained in this filter. For small variants, we retained those which were coding for genes with association to disease (OMIM), and which do not have a benign or likely benign assertion in ClinVar, while variants with a pathogenic or likely pathogenic assertion in ClinVar and Illumina MyKB database were prioritized in this bin. In addition, we retained noncoding variants with a splice artificial intelligence score >0.5. For large variants, we retained rare SVs, defined as INDELs >50 bp, translocations and CNVs >10-kb overlapping transcripts with consequences such as transcript amplification, transcript ablation and feature truncation.
To assess the performance of the WGS pipeline in calling CNVs, we used a validation cohort consisting of 19 cases in which 21 CNVs (ranging from 3.5 kb to 155 Mb in size) were previously identified by chromosomal microarray analysis, polymerase chain reaction gel electrophoresis or multiplex ligation-dependent probe amplification. All CNVs were successfully detected, indicating that our WGS-based CNV calling achieved a sensitivity of 100% for copy number detection (Supplementary Table 13)
In addition, the ‘Emedgene’ filter utilizes an artificial intelligence tool to prioritize the most-likely candidate variants. It generates a knowledge-graph showing supporting evidence for the variant prioritization using disease–gene relationships, generated by evaluating phenotypes, inheritance modes, splicing predictions and conservation, etc., and by the application of natural language processing to various datafilter
Prioritized variants were manually curated by a genomic scientist, a genetic counselor and an American Board of Medical Genetics and Genomics board-certified molecular geneticist. Retained variants were classified following the ACMG/AMP (SNVs or INDELs) or the AMCG/Clinical Genome Resource (ACMG-ClinGen) (CNVs) variant interpretation guidelines56,57. Pathogenic and likely pathogenic variants in genes relevant to the patients’ primary indications were reported verbally to the care team and were considered diagnostic if the patient’s phenotype (based on physician’s notes and feedback), disease mechanism and inheritance were all consistent. Clinically significant heterozygous variants in genes with recessive inheritance and all variants of uncertain significance relevant to patients’ primary indications were also reported, though were not considered diagnostic, leading to inconclusive reports. All diagnostic and uncertain variants in this study, and the applied ACMG codes for each, can be found in Supplementary Tables 5 and 6.
Extended genomic analysis
In addition to primary findings, an extended analysis was performed across four predefined gene sets. These include (1) secondary findings: pathogenic or likely pathogenic variants in the 81 medically actionable genes recommended by the ACMG58; (2) Incidental findings: pathogenic or likely pathogenic variants, which are considered to be diagnostic (heterozygous for dominant conditions and homozygous, hemizygous or compound heterozygous for recessive conditions) for potentially actionable conditions not on the ACMG secondary findings list; (3) NBS; heterozygous or homozygous pathogenic or likely pathogenic variants in 666 genes associated with newborn conditions59,60,61 (Supplementary Table 14); (4) carrier status: heterozygous pathogenic or likely pathogenic variants in 523 genes implicated in autosomal recessive or X-linked disorders curated from the Baylor Genetics and Sema4 carrier screening panels (Supplementary Table 15); and (5) pharmacogenomic screening: variants in the 53 loci associated with FDA-approved drug responses62,63,64 (Supplementary Table 16). Results from extended analyses were included in the written report only if parents opted in for such findings in the written consent. All identified variants from secondary or incidental findings, as well as newborn and carrier screening, can be found in Supplementary Table 5, and those identified from pharmacogenomic screening can be found in Supplementary Table 7.
Ancestry analysis
We joint-called probands on a set of 596,417 single nucleotide polymorphisms (SNPs) found in the Human Origin Array using bcftoolsv1.21 (mpileup+call) setting filters on mapping quality and base quality (-q30 -Q30)65. We set to missing genotypes with GQ <20 and then merged the samples with the HGDP WGS samples using plink-v1.932,66. We excluded any HGDP samples labeled with ‘ignore’ (817 remained) and filtered SNPs for minor allele frequency >5%, missingness <2% and pruned for linkage disequilibrium using the command–indep-pairwise 50 5 0.2, resulting in a set of 96,373 SNPs. For PCA, we projected the probands onto principal components generated from the HGDP samples using smartpca-v1021067, with options lsqproject: YES, shrinkmode: YES and numoutlieriter: 0. The same dataset was used for ADMIXTURE runs setting K from 5 to 9 (ref. 68). We plot the run with K = 7 in Extended Data Fig. 3.
Parental relatedness analysis
Parental relatedness was assessed by calculating the genome-wide burden of long ROHs using the Illumina DRAGEN ROH Caller algorithm within the Emedgene (v36.0) tertiary-analysis platform. In brief, homozygous SNV segments >3 Mb were identified according to default DRAGEN seed and extension criteria (minimum 50 consecutive homozygous SNVs, gap threshold ~500 kb), and the fraction of autosomal SNPs falling in these segments was computed. These values were then used as a continuous metric of autozygosity/consanguinity and incorporated as a covariate in downstream analyses54,55. Parental relatedness analysis was only performed for trio-based cases (n = 98).
Clinical utility assessment
Clinical utility was evaluated by determining whether rWGS results influenced patient management during their NICU/PICU admission period, either by prompting a change in clinical actions, including pharmacologic or dietary interventions, optimization of diagnostic evaluation, surgical or procedural decision-making, rapid specialty consultations and/or initiation of palliative or end-of-life care, or by providing diagnostic clarity that informed ongoing care. All cases were independently reviewed by two neonatologists to determine the presence and category of management change, with discrepancies resolved by consensus with a third reviewer. The overall clinical utility was measured as the proportion of cases where rWGS or other testing (controls) had an impact on NICU/PICU management as defined above, as detailed in Supplementary Tables 1 and 11 and quantified in Fig. 5.
To further quantify the impact of genetic testing on patient management, we applied the C-GUIDE, which was recently modified to quantify utility in the NICU35. Unlike the standard C-GUIDE tool, which includes items to also survey outpatient medical genetic context, future reproductive and health risks for patients and family members, as well as psychosocial well-being, the C-GUIDE NICU tool, which we also used for PICU and therefore refer to as ‘C-GUIDE ICU’, consists of ten questions (Supplementary Table 9) focusing primarily on diagnostic thinking and management decision-making. As a scoring system for the C-GUIDE ICU questionnaire has not yet been developed, we adapted one from the standard tool where each question scored 0 to 2 points. Questions 1–3 had four answers (complete, partial, possible and no) with varying scores (2, 1, 1 and 0, respectively), while questions 4–10 had binary answers (yes and no) and scores (2 and 0) (Supplementary Table 9). For each patient, the questionnaire was completed and scored retrospectively by a clinician involved in their care. C-GUIDE ICU scores were calculated by summing points across all questions/domains for each patient. Higher scores were interpreted to reflect greater number of clinician-reported impacts across domains, including timely diagnostic, prognostic, therapeutic and clinical management insights. Patients where rWGS-based management plans led to favorable outcomes or de-escalation, permitting natural death, are listed in Supplementary Table 10.
Statistical analysis
Categorical variables were compared using Pearson’s Chi-squared test or Fisher’s exact test, as appropriate. Continuous variables were compared using Wilcoxon rank-sum test (Mann–Whitney U test). P < 0.05 was considered statistically significant, and exact, or adjusted, P values are reported in figure legends where indicated. All statistical tests were conducted using R v4.4.1
Reporting summary
Further information on research design is available in the Nature Portfolio Reporting Summary linked to this article
Data availability
Deidentified aggregate data supporting the findings of this study are provided in the article, its figures, Source Data, Extended Data Figs. 1–6 and Supplementary Information. These materials include clinical, demographics, genomic, diagnostic and clinical utility data underlying the reported analyses and figures. The raw whole-genome sequencing data generated in this study can be requested from the corresponding author (Ahmad.Tayoun@dubaihealth.ae) who will respond within 2 weeks from receipt of the request. Requests in line with the ethics approval of the study will be considered for data sharing. Source data are provided with this paper.
References
The Lancet Global Health. The landscape for rare diseases in 2024. Lancet Glob. Health12, e341 (2024)
Zurynski, Y., Frith, K., Leonard, H. & Elliott, E. Rare childhood diseases: how should we respond?. Arch. Dis. Child.93, 1071–1074 (2008)
Oliveira, C. C. et al. A systematic review of studies that estimated the burden of chronic non-communicable rare diseases using disability-adjusted life years. Orphanet J. Rare Dis.19, 333 (2024)
Kingsmore, S. F., Nofsinger, R. & Ellsworth, K. Rapid genomic sequencing for genetic disease diagnosis and therapy in intensive care units: a review. npj Genom. Med.9, 17 (2024)
Peterson, B. et al. MPSE identifies newborns for whole genome sequencing within 48 h of NICU admission. npj Genom. Med.10, 47 (2025)
Schroeder, B. E. et al. The diagnostic trajectory of infants and children with clinical features of genetic disease. npj Genom. Med.6, 98 (2021)
Kingsmore, S. F. et al. Measurement of genetic diseases as a cause of mortality in infants receiving whole genome sequencing. npj Genom. Med.5, 49 (2020)
Owen, M. J. et al. Reclassification of the etiology of infant mortality with whole-genome sequencing. JAMA Netw. Open6, e2254069 (2023)
Wojcik, M. H. et al. Infant mortality: the contribution of genetic disorders. J. Perinatol.39, 1611–1619 (2019)
Wojcik, M. H. et al. The unrecognized mortality burden of genetic disorders in infancy. Am. J. Public Health111, S156–S162 (2021)
Wojcik, M. H. et al. Genetic disorders and mortality in infancy and early childhood: delayed diagnoses and missed opportunities. Genet. Med.20, 1396–1404 (2018)
Bhatia, S. et al. Role of next generation sequencing in diagnosis and management of critically ill children with suspected monogenic disorder. Eur. J. Hum. Genet.32, 1106–1115 (2024)
Stark, Z. & Ellard, S. Rapid genomic testing for critically ill children: time to become standard of care? Eur. J. Hum. Genet.30, 142–149 (2022)
Jezkova, J., Shaw, S., Taverner, N. V. & Williams, H. J. Rapid genome sequencing for pediatrics. Hum. Mutat.43, 1507–1518 (2022)
Kansal, R. Rapid whole-genome sequencing in critically ill infants and children with suspected, undiagnosed genetic diseases: evolution to a first-tier clinical laboratory test in the era of precision medicine. Children12, 429 (2025)
Xiao, F. et al. Diagnostic utility of rapid sequencing in critically ill infants: a systematic review and meta-analysis. Expert Rev. Mol. Diagn.22, 833–840 (2022)
Farnaes, L. et al. Rapid whole-genome sequencing decreases infant morbidity and cost of hospitalization. npj Genom. Med.3, 10 (2018)
Rodriguez, K. M. et al. Rapid whole-genome sequencing and clinical management in the PICU: a multicenter cohort, 2016-2023. Pediatr. Crit. Care Med.25, 699–709 (2024)
Sanford, E. F. et al. Rapid whole genome sequencing has clinical utility in children in the PICU. Pediatr. Crit. Care Med.20, 1007–1020 (2019)
Thompson, L. et al. Multi-center implementation of rapid whole genome sequencing provides additional evidence of its utility in the pediatric inpatient setting. Front. Pediatr.12, 1349519 (2024)
World-First National Genetic Testing Service to Deliver Rapid Life-Saving Checks for Babies and Kids Vol. 2026 (NHS, 2022)
Al-Gazali, L. & Hamamy, H. Consanguinity and dysmorphology in Arabs. Hum. Hered.77, 93–107 (2014)
Bittles, A. H. When cousins marry: a review of consanguinity in the Middle East. Perspect. Hum. Biol.1, 71–83 (1995)
El Naofal, M. et al. The genomic landscape of rare disorders in the Middle East. Genome Med15, 5 (2023)
Jain, R. et al. Pathogenic variation underlying rare diseases in an Arab population: implications for screening programs. Genet. Med. Open3, 103446 (2025)
Tadmouri, G. O. et al. Consanguinity and reproductive health among Arabs. Reprod. Health6, 17 (2009)
Abou Tayoun, A. N. & Rehm, H. L. Genetic variation in the Middle East—an opportunity to advance the human genetics field. Genome Med12, 116 (2020)
Özçelik, T. & Onat, O. E. Genomic landscape of the Greater Middle East. Nat. Genet.48, 978–979 (2016)
Scott, E. M. et al. Characterization of Greater Middle Eastern genetic variation for enhanced disease gene discovery. Nat. Genet.48, 1071–1076 (2016)
Abou Tayoun, A. N. & Alsheikh-Ali, A. A rapid whole-genome sequencing service for infants with rare diseases in the United Arab Emirates. Nat. Med.29, 2979–2980 (2023)
Population and Vital Statistics: Number of Population Estimated by Nationality Vol. 2026 (DDSE, 2024)
Bergström, A. et al. Insights into human genetic variation and population history from 929 diverse genomes. Science367, eaay5012 (2020)
Hellenthal, G. et al. A genetic atlas of human admixture history. Science343, 747–751 (2014)
Iqbal, S., Zakar, R., Fischer, F. & Zakar, M. Z. Consanguineous marriages and their association with women’s reproductive health and fertility behavior in Pakistan: secondary data analysis from Demographic and Health Surveys, 1990–2018. BMC Womens Health22, 118 (2022)
Dolman, L. I. et al. The clinician-reported genetic testing utility InDEx for neonatal intensive care (C-GUIDE NICU): quantifying genome-wide sequencing utility in the NICU. Genet. Med.27, 101503 (2025)
Dimmock, D. et al. Project Baby Bear: rapid precision care incorporating rWGS in 5 California children’s hospitals demonstrates improved clinical outcomes and reduced costs of care. Am. J. Hum. Genet.108, 1231–1238 (2021)
Kingsmore, S. F. et al. A randomized, controlled trial of the analytic and diagnostic performance of singleton and trio, rapid genome and exome sequencing in ill infants. Am. J. Hum. Genet.105, 719–733 (2019)
Petrikin, J. E. et al. The NSIGHT1-randomized controlled trial: rapid whole-genome sequencing for accelerated etiologic diagnosis in critically ill infants. npj Genom. Med.3, 6 (2018)
Lunke, S. et al. Integrated multi-omics for rapid rare disease diagnosis on a national scale. Nat. Med.29, 1681–1691 (2023)
Lunke, S. et al. Feasibility of ultra-rapid exome sequencing in critically ill infants and children with suspected monogenic conditions in the Australian public health care system. J. Am. Med. Assoc.323, 2503–2511 (2020)
Sloper, E. et al. Wales Infants’ and childreN’s Genome Service (WINGS): providing rapid genetic diagnoses for unwell children. Arch. Dis. Child.109, 409–413 (2024)
Maron, J. L. et al. Rapid whole-genomic sequencing and a targeted neonatal gene panel in infants with a suspected genetic disorder. J. Am. Med. Assoc.330, 161–169 (2023)
Krantz, I. D. et al. Effect of whole-genome sequencing on the clinical management of acutely ill infants with suspected genetic disease: a randomized clinical trial. JAMA Pediatr.175, 1218–1226 (2021)
Almarri, M. A. et al. The genomic history of the Middle East. Cell184, 4612–4625 (2021)
Fernandes, V. et al. Genome-wide characterization of Arabian Peninsula populations: shedding light on the history of a fundamental bridge between continents. Mol. Biol. Evol.36, 575–586 (2019)
Diaby, V. et al. Real-world economic evaluation of prospective rapid whole-genome sequencing compared to a matched retrospective cohort of critically ill pediatric patients in the United States. Pharmacogenomics J.22, 223–229 (2022)
Moore, C. et al. Rapid whole-genome sequencing as a first-line test is likely to significantly reduce the cost of acute care in a private payer system. J. Appl. Lab. Med.10, 833–842 (2025)
Bupp, C. P. et al. Breaking barriers to rapid whole genome sequencing in pediatrics: Michigan’s Project Baby Deer. Children10, 106 (2023)
Goranitis, I. et al. Is faster better? An economic evaluation of rapid and ultra-rapid genomic testing in critically ill infants and children. Genet. Med.24, 1037–1044 (2022)
Kingsmore, S. F. & Cole, F. S. The role of genome sequencing in neonatal intensive care units. Annu. Rev. Genomics Hum. Genet.23, 427–448 (2022)
Whole Exome and Whole Genome Sequencing for Diagnosis of Genetic Disordershttps://www.blueshieldca.com/content/dam/bsca/en/provider/docs/2021/May/PRV_WholeExome_Sequen.pdf (Blue Sheild of California, 2021)
Halabi, N. et al. Rapid whole genome sequencing of critically ill pediatric patients from genetically underrepresented populations. Genome Med.14, 56 (2022)
bcl2fastq2ConversionSoftwarev2.20 Software Guide Vol. 2026 (Illumina, 2019)
Behera, S. et al. Comprehensive genome analysis and variant detection at scale using DRAGEN. Nat. Biotechnol.43, 1177–1191 (2025)
Meng, L. et al. Evaluation of an automated genome interpretation model for rare disease routinely used in a clinical genetic laboratory. Genet. Med.25, 100830 (2023)
Richards, S. et al. Standards and guidelines for the interpretation of sequence variants: a joint consensus recommendation of the American College of Medical Genetics and Genomics and the Association for Molecular Pathology. Genet. Med.17, 405–424 (2015)
Riggs, E. R. et al. Technical standards for the interpretation and reporting of constitutional copy-number variants: a joint consensus recommendation of the American College of Medical Genetics and Genomics (ACMG) and the Clinical Genome Re. Genet. Med.22, 245–257 (2020)
Lee, K. et al. ACMG SF v3.3 list for reporting of secondary findings in clinical exome and genome sequencing: a policy statement of the American College of Medical Genetics and Genomics (ACMG). Genet. Med.27, 101454 (2025)
Kingsmore, S. F. et al. A genome sequencing system for universal newborn screening, diagnosis, and precision medicine for severe genetic diseases. Am. J. Hum. Genet.109, 1605–1619 (2022)
Milko, L. V. et al. An age-based framework for evaluating genome-scale sequencing results in newborn screening. J. Pediatr.209, 68–76 (2019)
Shum, B. O. V. et al. Feasibility of targeted next-generation DNA sequencing for expanding population newborn screening. Clin. Chem.69, 890–900 (2023)
Relling, M. V. et al. The clinical pharmacogenetics implementation consortium: 10 years later. Clin. Pharmacol. Ther.107, 171–175 (2020)
Swen, J. J. et al. A 12-gene pharmacogenetic panel to prevent adverse drug reactions: an open-label, multicentre, controlled, cluster-randomised crossover implementation study. Lancet401, 347–356 (2023)
Whirl-Carrillo, M. et al. An evidence-based framework for evaluating pharmacogenomics knowledge for personalized medicine. Clin. Pharmacol. Ther.110, 563–572 (2021)
Patterson, N. et al. Ancient admixture in human history. Genetics192, 1065–1093 (2012)
Chang, W., Cathcart, C., Hall, D. & Garrett, A. Ancestry-constrained phylogenetic analysis supports the Indo-European steppe hypothesis. Language91, 194–244 (2015)
Patterson, N., Price, A. L. & Reich, D. Population structure and eigenanalysis. PLoS Genet.2, e190 (2006)
Alexander, D. H., Novembre, J. & Lange, K. Fast model-based estimation of ancestry in unrelated individuals. Genome Res.19, 1655–1664 (2009)
Acknowledgements
We thank all families who participated in this study as well as the staff of Dubai Health’s Genomic Medicine Center, NICUs and PICUs for taking care of the patients
Funding
This work received funding support from Illumina in the form of sequencing reagents and software access. The funders had no role in study design, data collection and analysis, decision to publish or preparation of the paper
Author information
Authors and Affiliations
College of Medicine, Mohammed Bin Rashid University of Medicine and Health Sciences, Dubai, United Arab Emirates
Fatma Rabea, Ikram Chekroun, Syeda Khadija, Costerwell Khyriem, Mohamed Almarri, Stefan Du Plessis, Omer S. AlKhnbashi, Rasha Buhumaid, Hanan Al Suwaidi & Ahmad Abou Tayoun
Neonatal Intensive Care Unit, Dubai Health, Dubai, United Arab Emirates
Ibtesam Aljasmi & Shiva Shankar
Genomic Medicine Center, Dubai Health, Dubai, United Arab Emirates
Ruchi Jain, Sathishkumar Ramaswamy, Alan Taylor, Shruti Shenbagam, Shruti Sinha, Maha El Naofal, Sawsan Yaslam, Roudha Alfalasi, Maria Farag, Sarah AlHajjaj, Farah Almadhoun, Radwa Sharaf & Ahmad Abou Tayoun
Pediatrics Department, Metabolic Medicine, Dubai Health, Dubai, United Arab Emirates
Hamda Abulhoul & Ibrar Majid
Pediatrics Department, Genetics, Dubai Health, Dubai, United Arab Emirates
Heba Elabd
Pediatrics Department, Endocrinology, Dubai Health, Dubai, United Arab Emirates
Manal Mustafa
Genome Center, Department of Forensic Science and Criminology, Dubai Police GHQ, Dubai, United Arab Emirates
Mohamed Almarri
Center for Applied and Translational Genomics, Mohammed Bin Rashid University of Medicine and Health Sciences, Dubai Health, Dubai, United Arab Emirates
Omer S. AlKhnbashi
Dubai Health, Dubai, United Arab Emirates
Mohamed AlAwadhi & Abdulla AlKhayat
Dubai Health Authority, Dubai, United Arab Emirates
Alawi Alsheikh-Ali
Pediatric Intensive Care Unit, Dubai Health, Dubai, United Arab Emirates
Jihad Zahraa
Center for Genomic Discovery, Mohammed Bin Rashid University of Medicine and Health Sciences, Dubai Health, Dubai, United Arab Emirates
Ahmad Abou Tayoun
Authors
- Fatma RabeaView author publications
Search author on:PubMed Google Scholar
- Ibtesam AljasmiView author publications
Search author on:PubMed Google Scholar
- Ruchi JainView author publications
Search author on:PubMed Google Scholar
- Sathishkumar RamaswamyView author publications
Search author on:PubMed Google Scholar
- Alan TaylorView author publications
Search author on:PubMed Google Scholar
- Shruti ShenbagamView author publications
Search author on:PubMed Google Scholar
- Ikram ChekrounView author publications
Search author on:PubMed Google Scholar
- Shruti SinhaView author publications
Search author on:PubMed Google Scholar
- Maha El NaofalView author publications
Search author on:PubMed Google Scholar
- Sawsan YaslamView author publications
Search author on:PubMed Google Scholar
- Roudha AlfalasiView author publications
Search author on:PubMed Google Scholar
- Syeda KhadijaView author publications
Search author on:PubMed Google Scholar
- Maria FaragView author publications
Search author on:PubMed Google Scholar
- Sarah AlHajjajView author publications
Search author on:PubMed Google Scholar
- Farah AlmadhounView author publications
Search author on:PubMed Google Scholar
- Radwa SharafView author publications
Search author on:PubMed Google Scholar
- Costerwell KhyriemView author publications
Search author on:PubMed Google Scholar
- Hamda AbulhoulView author publications
Search author on:PubMed Google Scholar
- Heba ElabdView author publications
Search author on:PubMed Google Scholar
- Manal MustafaView author publications
Search author on:PubMed Google Scholar
- Mohamed AlmarriView author publications
Search author on:PubMed Google Scholar
- Stefan Du PlessisView author publications
Search author on:PubMed Google Scholar
- Omer S. AlKhnbashiView author publications
Search author on:PubMed Google Scholar
- Ibrar MajidView author publications
Search author on:PubMed Google Scholar
- Rasha BuhumaidView author publications
Search author on:PubMed Google Scholar
- Hanan Al SuwaidiView author publications
Search author on:PubMed Google Scholar
- Mohamed AlAwadhiView author publications
Search author on:PubMed Google Scholar
- Abdulla AlKhayatView author publications
Search author on:PubMed Google Scholar
- Alawi Alsheikh-AliView author publications
Search author on:PubMed Google Scholar
- Shiva ShankarView author publications
Search author on:PubMed Google Scholar
Contributions
A.A.T. conceived the project and obtained funding. A.A.T. and F.A. obtained ethical approvals. S. Shankar, J.Z., H.A., H.E. and M.M. recruited patients with the help of S. Shenbagam and A.T. S. Shenbagam and A.T. counseled and consented parents. F.R. performed rWGS with support from I.C., M.E.N., R.A. and S.Y. F.R., R.J. and A.A.T. performed genomic analysis and variant interpretation with support from S. Shenbagam. A.T., S.R. and S. Sinha. provided bioinformatics support. F.R. performed cohort analysis with the help of A.A.T. O.S.A and M. Almarri performed ancestry analysis (PCA). I.A., S. Shankar, and H.A. assessed patients’ outcomes. F.R. generated tables and figures with the help of R.J. and S.R. F.R., I.A. and A.A.T. generated the first draft of the paper. All co-authors edited the paper and provided feedback on the study.
Ethics declarations
Competing interests
The authors declare no competing interests. Support from Illumina was provided for sequencing and software access. Illumina had no role in the design and interpretation of the study
Peer review
Peer review information
Nature Medicine thanks Dana Marafi, Zornitza Stark and the other, anonymous, reviewer(s) for their contribution to the peer review of this work. Peer reviewer reports are available. Primary Handling Editor: Anna Ranzoni, in collaboration with the Nature Medicine team
Additional information
Publisher’s note Springer Nature remains neutral with regard to jurisdictional claims in published maps and institutional affiliations
Extended data
Extended Data Fig. 1 Referral uptake over time
a: Monthly recruitment (bars, right y-axis) and cumulative number of enrolled patients (line, left y-axis) from July 2023 to April 2026 (~3 years of implementation). Black markers denote the number of patients enrolled in each study year. Relative changes in recruitment between yearly intervals are indicated. b: Time from hospital admission to rWGS referral (days) within three years of the study. Each point represents an individual patient, and the curve illustrates the temporal trend. Median (interquartile range) referral times are annotated for each year. The percentage change in median referral time from Year 1 to Year 3 is indicated.
Source data
Extended Data Fig. 2 Sequencing Coverage
Bar plots (teal) represent mean genome coverage (×) for each sample (left y-axis). Gray dots indicate the percentage of bases covered at ≥10× depth (% bases ≥10×; right y-axis). The dashed horizontal line marks the 30× coverage threshold, commonly considered the benchmark for high-quality whole-genome sequencing suitable for clinical interpretation
Source data
Extended Data Fig. 3 Patient cohort ancestry analysis
Model-based clustering using ADMIXTURE of probands with the HGDP populations using K = 7. To help visualize ancestral components relevant to the probands, we selected Yoruba as representative of African-related ancestry, Han for East Asian, Bedouin & Palestinian for Middle Eastern, and Brahui for South Asian. We grouped and ordered the samples using the major ancestry component (HGDP: Human Genome Diversity Project, EAS: East Asia, ME: Middle East, SAS: South Asian, AFR: African)
Extended Data Fig. 4 Parental relatedness
Stacked horizontal bars show the proportion of consanguineous unions, shared ancestry, and unrelated parents among Middle Eastern and Asian families. Percentages are displayed within bars, with absolute counts indicated in parentheses
Source data
Extended Data Fig. 5 Burden of recessive diseases by parental relatedness
Horizontal bars show the proportion of molecular diagnoses attributable to autosomal recessive conditions within each parental relatedness category. Pairwise comparisons between each relatedness category and the unrelated group were performed using two-sided Fisher’s exact tests. P values were adjusted for multiple comparisons using the Bonferroni method. Bonferroni-adjusted P values were 0.00628 (Consanguineous vs Unrelated), 0.130 (Consanguineous OR Shared Ancestry vs Unrelated), and 1.000 (Shared Ancestry vs Unrelated). Statistical significance is indicated by asterisks.as ** (P < 0.01).
Source data
Extended Data Fig. 6 Variant filtration and prioritization
a: Schematic representation of Illumina ‘General’ variant filtering and prioritizing strategy. MyKB, Illumina knowledge base database. P, Pathogenic; LP, Likely pathogenic. b: Schematic representation of ‘Emedgene’ variant filtering and prioritizing strategy. Artificial Intelligent-based prioritization of candidate variants was performed using Emedgene. For example, Emedgene identified a pathogenic homozygous frameshift variant in MMACHC associated with methylmalonic aciduria and homocystinuria, cblC type which is related to patient’s phenotype (F10).
Supplementary information
Supplementary Information (download PDF )
Titles of Supplementary Tables 1–16
Reporting Summary (download PDF )
Peer Review File (download PDF )
Supplementary Tables 1–16 (download XLSX )
Supplementary Table 1 List of patients recruited for rWGS. Supplementary Table 2 Sequencing statistics and QC. Supplementary Table 3 NICU and PICU breakdown within rWGS cohort. Supplementary Table 4 Additional molecular findings. Supplementary Table 5 List of small variants identified within the rWGS cohort. Supplementary Table 6 List of CNVs and SVs identified within the rWGS cohort. Supplementary Table 7 List of pharmacogenomic variants identified within rWGS cohort. Supplementary Table 8 Medication and dietary interventions. Supplementary Table 9 Clinician-reported Genetic testing Utility InDEx questionnaire in ICU. Supplementary Table 10 Cases where management changes triggered by rWGS led to changes in disease trajectories. Supplementary Table 11 List of patients in the control cohort (retrospective). Supplementary Table 12 Comparison of variables across rWGS and control cohorts. Supplementary Table 13 Validation of WGS-based copy number variant calling. Supplementary Table 14 Newborn screening gene panel. Supplementary Table 15 Carrier gene panel. Supplementary Table 16 Pharmacogenomics gene panel.
Source data
Source Data Figs. 2a–e, 3b, 4a–f, 5a,b and 6a–g, and Extended Data Figs. 1a, 1b, 2, 4 and 5 (download XLSX )
Source data of age, gender, clinical indication, ethnicity and parental relatedness distributions in the rWGS cohort. Source Data Fig. 3b Source data of rWGS overall and stepwise turnaround per patient. Source Data Fig. 4a–d Source data of overall diagnostic yield, stratified by clinical indication and parental relatedness, and additional molecular findings per patient in the rWGS cohort. Source Data Fig. 4e,f Source data of inheritance modes and diagnostic variants in the rWGS cohort. Source Data Fig. 5a,b Source data of overall clinical changes, stratified by patient and change category in the rWGS cohort. Source Data Fig. 6a–c Source data of age, gender, clinical indication and ethnicity distributions in the control group. Source Data Fig. 6d Source data of tests orders per patient in the control group. Source Data Fig. 6e Source data of turnaround times per patient in the rWGS and control cohorts. Source Data Fig. 6f,g Source data of diagnostic yields and clinical utility in the rWGS and control cohorts. Source Data Extended Data Fig. 1a Source data of patient referral counts per month between July 2023 and April 2026. Source Data Extended Data Fig. 1b Source data of time between admission and referral to rWGS, per patient, in the first 3 years. Source Data Extended Data Fig. 2 Source data of samples’ sequencing coverage statistics in the rWGS cohort. Source Data Extended Data Fig. 4 Source data of parental relatedness distribution across ethnic groups. Source Data Extended Data Fig. 5 Source data of recessive disease distribution by relatedness category.
Rights and permissions
Open Access This article is licensed under a Creative Commons Attribution-NonCommercial-NoDerivatives 4.0 International License, which permits any non-commercial use, sharing, distribution and reproduction in any medium or format, as long as you give appropriate credit to the original author(s) and the source, provide a link to the Creative Commons licence, and indicate if you modified the licensed material. You do not have permission under this licence to share adapted material derived from this article or parts of it. The images or other third party material in this article are included in the article’s Creative Commons licence, unless indicated otherwise in a credit line to the material. If material is not included in the article’s Creative Commons licence and your intended use is not permitted by statutory regulation or exceeds the permitted use, you will need to obtain permission directly from the copyright holder. To view a copy of this licence, visit http://creativecommons.org/licenses/by-nc-nd/4.0/.
About this article
Cite this article
Rabea, F., Aljasmi, I., Jain, R. et al. Citywide implementation of a rapid whole-genome sequencing program for critically ill pediatric patients.
Nat Med (2026). https://doi.org/10.1038/s41591-026-04598-x
Received:26 February 2026
Accepted:20 July 2026
Published:24 August 2026
Version of record:24 August 2026
DOI
:https://doi.org/10.1038/s41591-026-04598-x
