


InfographicsCompanies
Market Size (2026)
USD 5.2 Bn
Forecast (2036)
USD 10.3 Bn
CAGR (2026 to 2036)
7.1%
How big is Portion-Control Meals Market in 2026?
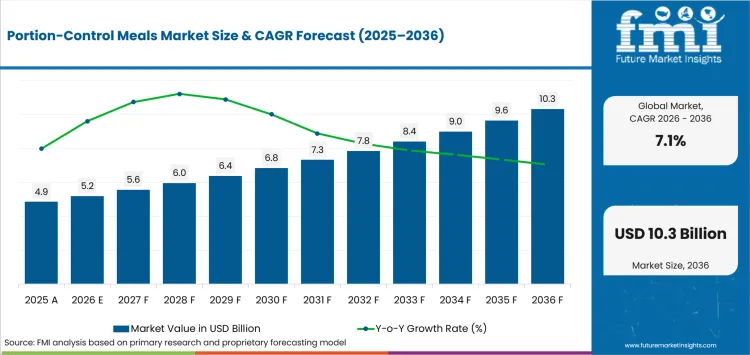
USD 5.2 billion in 2026 and USD 10.3 billion by 2036 at a 7.1% CAGR
The portion-control meals market is projected to grow at a 7.1% CAGR from USD 5.2 billion in 2026 to USD 10.3 billion by 2036. The market was valued at USD 4.8 billion in 2025 and is expected to add USD 5.1 billion in value over the forecast period
Portion-control meals convert a nutrition goal into a pre-sized purchase. Consumers do not need to weigh ingredients or calculate a recipe each time they eat. That convenience matters when weight management, calorie awareness, protein intake, or medication-related appetite changes make meal composition more deliberate. The USA Food and Drug Administration explained in March 2024 that nutrition information on packaged food is usually stated per serving. It also noted that serving sizes reflect typical consumption rather than a recommended amount. A single-serve meal therefore reduces a common interpretation step because the package can align the eating occasion with the nutrition panel more directly. Retail shoppers can compare calories and protein at the freezer door. Digital subscribers can make the same comparison before recurring delivery. Revenue expands when portion certainty saves enough planning effort to justify a packaged-meal premium.
Country conditions shape how quickly that value proposition converts into repeat purchasing. England combines a large weight-management need with pronounced affordability differences, which makes value per meal important alongside nutrition claims. Germany has a federal food and nutrition strategy that encourages health-promoting choices and healthier processed foods. That raises the importance of credible formulation and transparent labeling. Japan presents a different constraint. A Ministry of Agriculture, Forestry and Fisheries survey shows that less preparation effort, more time, and a larger food budget would help many consumers improve meal balance. South Korea combines active weight-control behavior with official attention to balanced lower-calorie eating. Across these markets, the conversion threshold is practical rather than rhetorical: the meal must taste good, fit the consumer’s budget, deliver understandable nutrition, and remove enough preparation work to earn repeat use.
Key Takeaways
- The market is projected to rise from USD 5.2 billion in 2026 to USD 10.3 billion by 2036 at a 7.1% CAGR.
- By product type, Frozen Entrees are estimated to account for 28.1% in 2026.
- By calorie band, 301-400 kcal is estimated to account for 45.6% in 2026.
- By diet claim, Weight Management is estimated to account for 36.1% in 2026.
- By packaging, Trays are estimated to account for 37.2% in 2026.
- By sales channel, Supermarkets & Hypermarkets are estimated to account for 31.6% in 2026.
Analyst Perspective
“Portion-control meals create value when calorie information, serving size and convenience work together without making the meal feel restrictive. Operators that protect taste, menu variety and reliable portioning can hold repeat demand across retail and direct delivery routes.”
– , Principal Consultant, Future Market Insights
How is the Portion-Control Meals Market segmented?
The portion-control meals market is segmented by product type, calorie band, diet claim, packaging, sales channel, and region
Product Type separates frozen, fresh, shelf-stable, kit-based, and snack-sized meal formats according to storage and preparation workflow. Calorie Band distinguishes the energy envelope buyers use when fitting a packaged meal into a daily intake plan. Diet Claim describes the nutritional job the meal is expected to support. Packaging separates the physical formats that control serving size and reheating. Sales Channel captures how the meal is discovered, compared, purchased, and replenished. These axes interact at the point of choice. A shopper may begin with a weight-management goal, filter by calories, prefer a tray or bowl, then choose between a supermarket freezer and a recurring delivery service.
Why do Supermarkets & Hypermarkets lead the Sales Channel category?
Supermarkets and hypermarkets concentrate comparison into a routine grocery trip. Shoppers can see multiple calorie levels, cuisines, diet claims, pack types, and price points at the same time. That matters for portion-control meals because the category competes both with other prepared meals and with ingredients for home cooking. Freezer and chilled placement also support immediate replenishment without waiting for delivery. Retail distribution therefore rewards recognizable packaging and simple front-of-pack nutrition cues. It also exposes brands to direct price comparison. The channel is strongest when the meal can communicate its portion and dietary role quickly enough to win a place in the shopper’s regular basket.
- Supermarkets & Hypermarkets account for 31.6% of Sales Channel in 2026 because routine grocery traffic enables direct comparison of meal size, nutrition, and price.
- In September 2024, Nestlé USA launched Vital Pursuit at national retailers including Walmart, Target, and Kroger. That rollout demonstrates the importance of mainstream grocery distribution for portion-focused frozen meals.
What makes Frozen Entrees central to the Product Type category?
Frozen entrees make portion control operationally simple. A producer can define one eating occasion at the factory, preserve it through frozen distribution, and give the consumer a repeatable heating instruction. That format also supports broad recipe variety without requiring the shopper to use the meal immediately after purchase. Retailers can merchandise many cuisines and nutrition positions in the same freezer set. The format fits both planned stock-up trips and last-minute meal replacement. Its main commercial advantage is therefore not freezing alone. It is the combination of controlled serving size, inventory life, microwave convenience, and familiar grocery placement.
- Frozen Entrees account for 28.1% of Product Type in 2026 because the format combines a defined serving with freezer life and quick preparation.
- In June 2026, Conagra (Healthy Choice) announced six new Healthy Choice frozen meals. The release emphasized convenient meal formats and made the range easier to identify for weight-management use through its On Track badge.
Why does 301-400 kcal lead the Calorie Band category?
The 301-400 kcal band sits between very light eating occasions and higher-energy prepared meals. That middle range gives formulators more room to use protein, vegetables, grains, sauces, and texture while retaining a visible calorie ceiling. For buyers, the band can feel substantial enough to function as lunch or a lighter dinner. It also leaves headroom for fruit, a beverage, or another small accompaniment without abandoning a controlled daily plan. The commercial test is nutrient density. Products that merely remove calories can underperform on satiety or taste. Products that use the available energy budget efficiently can support repeat purchase.
- The 301-400 kcal band holds 45.6% of Calorie Band in 2026 because it offers a practical compromise between energy control and a meal-like eating experience.
- In September 2024, Nestlé USA launched Vital Pursuit nationally with 14 thoughtfully portioned frozen meals that provide at least 20 grams of protein. The launch illustrates the formulation emphasis on nutrient density within smaller portions.
How does Weight Management anchor the Diet Claim category?
Weight Management is the most direct use case for a meal whose serving is intentionally bounded. The buyer is not only purchasing convenience. The buyer is purchasing fewer decisions about how much to plate and how to build a meal around a calorie or macro target. That makes the claim especially relevant to structured programs and consumers using appetite-management medications. It also raises the bar for credibility because smaller portions still need useful protein, fiber, and overall meal balance. Brands that connect the portion to understandable nutrition can reduce planning friction. Programs that add behavioral guidance can reinforce how the meal fits a broader eating pattern.
- Weight Management accounts for 36.1% of Diet Claim in 2026 because the controlled serving is directly connected to the buyer’s objective of managing food intake.
- In September 2024, Nestlé USA said Vital Pursuit was designed for GLP-1 users and consumers focused on weight management. The line paired smaller portions with high protein and essential nutrients.
What supports Trays in the Packaging category?
Trays turn portion definition into a physical boundary. They can hold the meal through freezing or chilled storage, support microwave heating, and present the food in the same container used for eating. That reduces transfer steps and helps maintain the designed serving. Compartmented or molded tray designs can also keep components separate until heating, which supports texture and visual completeness. The trade-off is that packaging has to survive distribution and heating while remaining easy to open. For buyers, the winning tray is the one that makes the portion feel convenient rather than constrained. For manufacturers, it is a stable platform for standardized filling and labeling.
- Trays hold 37.2% of Packaging in 2026 because they combine portion containment, reheating compatibility, and a familiar single-meal presentation.
- In June 2025, Conagra announced more than 50 new frozen foods that included single-serve meals and microwaveable tray formats. The range illustrates the continued operating fit of trays within heat-and-eat frozen food.
What are the drivers, restraints and opportunities in the Portion-Control Meals Market?
Demand is supported by weight-management and convenience needs, while price and eating satisfaction can restrict repeat purchase, and specialized high-protein or condition-aware nutrition creates room for differentiated growth
- Driver: Consumers want a ready meal that makes calories, serving size, and nutrition easier to manage.
- Restraint: Price per meal, taste, satiety, and delivery or freezer dependence can weaken repeat use.
- Opportunity: Higher-protein, lower-carb, diabetic-friendly, heart-healthy, and medication-aware meal design can serve more specific nutrition needs.
Convenient Calorie Management Supports Meal Demand
The main demand mechanism is decision simplification. A consumer who wants to manage weight or calories can buy a meal with a defined serving instead of measuring a recipe after cooking. That value becomes stronger when meal planning time is limited or appetite changes make portion size more important. In May 2025, England’s Office for Health Improvement and Disparities reported that 64.5% of adults were estimated to be overweight or living with obesity in 2023 to 2024. The statistic does not prove packaged-meal demand by itself. It establishes the scale of a weight-management need that can make controlled portions commercially relevant when the meal also meets taste and price expectations.
Menu Variety and Eating Experience Can Constrain Retention
The binding restraint appears after trial, when the consumer decides whether a controlled meal deserves a regular place in the food budget. Smaller portions must still feel satisfying. Prepared meals also carry manufacturing, packaging, cold-chain, or delivery costs that can increase price per eating occasion. Japan’s Ministry of Agriculture, Forestry and Fisheries reported in March 2024 that consumers who wanted more balanced meals often cited less preparation effort, more time, and a larger food budget as conditions that would help. That combination is instructive. Convenience can attract a first purchase, but repeat demand weakens if the meal saves time without delivering sufficient value or eating satisfaction.
Packaging and Portion Consistency Expand Repeat Use
The opportunity is to design portions around a clearer nutritional job rather than treating “smaller” as the product benefit. High-protein, low-carb, diabetic-friendly, and heart-healthy formats can help buyers filter choices according to different goals. Medication-led weight management adds another design brief because lower appetite can increase the importance of nutrient density in a smaller meal. In June 2026, Conagra introduced six new Healthy Choice meals and said all six carried its GLP-1 On Track badge. Four new Café entrees provided 12 to 15 grams of protein and were a good source of fiber. Suppliers that can combine specific nutrition criteria with taste, accessible pricing, and convenient channels are better placed to convert specialist interest into repeat meal purchases.
Which country CAGRs are profiled in the Portion-Control Meals Market?
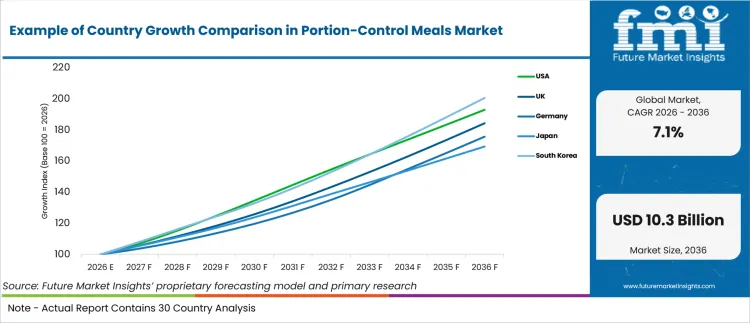
| Country | CAGR |
|---|---|
| USA | 6.8% |
| UK | 6.3% |
| Germany | 5.8% |
| Japan | 5.4% |
| South Korea | 7.2% |
How do country-level CAGRs compare in the Portion-Control Meals Market?
The five profiled countries fall within a relatively tight growth corridor. South Korea is highest at 7.2% CAGR from 2026 to 2036, followed by the USA at 6.8%. The UK sits in the middle at 6.3%, while Germany is forecast at 5.8% and Japan at 5.4%. The spread between South Korea and Japan is 1.8 percentage points. That difference is meaningful for investment timing but not large enough to make one national market interchangeable with another. Weight-management behavior, retail structure, food-price sensitivity, nutrition policy, and the value placed on preparation convenience differ across the five countries.
- South Korea at 7.2% is 0.4 percentage points above the USA at 6.8%. The faster rate supports earlier testing of specialized nutrition propositions, but local product fit still determines repeat purchase.
- The USA at 6.8% is 0.5 percentage points above the UK at 6.3%. The difference favors a somewhat faster pace of channel expansion in the USA, while UK propositions need strong value communication across income groups.
- The UK at 6.3% is 0.5 percentage points above Germany at 5.8%. Germany therefore rewards selective portfolio placement and compliance with local nutrition expectations more than simple assortment proliferation.
- Germany at 5.8% is 0.4 percentage points above Japan at 5.4%. Japan’s slower rate increases the importance of formats that remove preparation work without creating a price or taste penalty.
CAGR measures pace, not absolute revenue or addressable household count. A lower-growth country can still offer substantial sales if its retail base, price points, and repeat-purchase behavior support scale. A higher-growth country can remain difficult if the available meal formats do not match local eating patterns. Supplier decisions should therefore combine the growth rates with channel access, cost-to-serve, product localization, and the specific friction that prevents a consumer from buying the same meal again.
Country-wise Analysis
- USA: Packaged-food shoppers can use the Nutrition Facts panel to compare the calories and nutrients associated with one serving. Demand for Portion-Control Meals in USA is forecast to expand at 6.8% CAGR from 2026 to 2036. In March 2024, the USA Food and Drug Administration explained that serving sizes reflect amounts people typically consume and are not recommendations of how much to eat. That distinction creates a labeling friction when one package contains multiple servings. Suppliers can reduce the ambiguity by aligning a single meal package with one intended eating occasion and by making calorie, protein, and serving information easy to interpret.
- UK: Buyers face a strong health need but also wide differences in household resources, which makes value per meal commercially important. Demand for Portion-Control Meals in UK is forecast to expand at 6.3% CAGR from 2026 to 2036. In May 2025, the Office for Health Improvement and Disparities reported that 64.5% of adults in England were estimated to be overweight or living with obesity in 2023 to 2024. Obesity prevalence was also materially higher in the most deprived areas. The friction is affordability. Suppliers need retail reach, clear nutrition, and price points that make repeat purchasing realistic rather than occasional.
- Germany: Buyers encounter a policy environment that increasingly connects everyday food choice with health-promoting nutrition. Demand for Portion-Control Meals in Germany is forecast to expand at 5.8% CAGR from 2026 to 2036. On January 17, 2024, the German Federal Cabinet adopted the Good Food for Germany food and nutrition strategy, which supports health-promoting choices and healthier processed foods. The local friction is converting nutrition credentials into meals that still compete on taste and price. Suppliers should pair transparent nutritional positioning with familiar recipes, disciplined pricing, and formats that fit routine supermarket shopping.
- Japan: Consumers value healthier eating but often balance that goal against preparation effort, time, and household food budgets. Demand for Portion-Control Meals in Japan is forecast to expand at 5.4% CAGR from 2026 to 2036. The Ministry of Agriculture, Forestry and Fisheries reported in March 2024 that 59.9% of respondents who wanted more balanced meals said less effort would help. More time and more food budget were also frequently cited. The friction is therefore a three-way trade-off between convenience, value, and meal quality. Suppliers need portioned meals that remove work without feeling expensive or nutritionally thin.
- South Korea: Weight control is an active consumer behavior and official guidance also emphasizes balanced nutrition while reducing energy intake. Demand for Portion-Control Meals in South Korea is forecast to expand at 7.2% CAGR from 2026 to 2036. In November 2025, the Korea Disease Control and Prevention Agency reported that 34.4% of adults were obese in its analysis of 2024 Community Health Survey data. It also reported that 65% had tried to lose or maintain weight. The friction is nutritional adequacy in a smaller meal. Suppliers should emphasize protein, balanced meal composition, and clear calorie information rather than relying on portion size alone.
Who are the notable companies in the Portion-Control Meals Market?
Nestle (Lean Cuisine), Conagra (Healthy Choice), Kraft Heinz (Smart Ones), Nutrisystem, Factor (HelloFresh), Trifecta, BistroMD, WeightWatchers, Jenny Craig, and Amy’s Kitchen are the notable companies profiled in this market
Competition is organized around different ways of removing portion decisions from the consumer. Nestle (Lean Cuisine), Conagra (Healthy Choice), Kraft Heinz (Smart Ones), and Amy’s Kitchen rely on packaged frozen or shelf-ready meal architecture that fits mainstream retail routines. Nutrisystem, BistroMD, and Jenny Craig use structured meal programs in which portioned food is part of a broader weight-management system. Factor (HelloFresh) and Trifecta compete through direct delivery of prepared meals with calorie or macro filters. WeightWatchers has a different role because its primary strength is nutrition and behavioral guidance rather than manufacturing a broad proprietary meal range. Across these positions, the competitive levers are portion clarity, dietary specificity, and the ability to make repeat access convenient.
- Retail frozen portion platforms: Nestle (Lean Cuisine), Conagra (Healthy Choice), Kraft Heinz (Smart Ones), and Amy’s Kitchen compete through prepared-meal range, retail reach, and quick heat-and-eat use.
- Structured weight-management meal programs: Nutrisystem, BistroMD, and Jenny Craig compete by combining pre-portioned meals with planned menus and recurring delivery.
- Prepared-meal and nutrition platforms: Factor (HelloFresh), Trifecta, and WeightWatchers compete through fresh prepared delivery, diet-specific meal filtering, or structured nutrition guidance that shapes meal choice.
Competitive Benchmarking: Portion-Control Meals Market
| Company | Explicit Portion / Calorie Architecture | Specialized Diet Support | Direct-to-Consumer Meal Fulfillment | Geographic Reach |
|---|---|---|---|---|
| Nestle (Lean Cuisine) | High | High | Unscored | United States retail for profiled meal brands |
| Conagra (Healthy Choice) | High | High | Unscored | United States retail |
| Kraft Heinz (Smart Ones) | High | Unscored | Unscored | United States retail |
| Nutrisystem | High | High | High | United States direct-to-consumer |
| Factor (HelloFresh) | Unscored | Medium | High | Germany, Denmark, Sweden, Belgium, and the Netherlands |
| Trifecta | High | High | High | United States direct-to-consumer |
| BistroMD | High | High | High | United States direct-to-consumer |
| WeightWatchers | Unscored | High | Unscored | United States and UK program markets |
| Jenny Craig | High | Medium | High | United States and select Canada delivery |
| Amy’s Kitchen | Medium | High | Unscored | United States retail |
Scoring basis: Explicit Portion / Calorie Architecture measures how directly the offer uses a defined serving, calorie target, or portion-controlled meal structure. Specialized Diet Support measures documented coverage of weight-management, high-protein, low-carb, diabetic-friendly, heart-health, or comparable nutrition needs. Direct-to-Consumer Meal Fulfillment measures whether the company directly ships or delivers prepared meals as a core route to market. High indicates broad or deep documented capability against the criterion. Medium indicates credible but narrower capability. Low would indicate a documented limitation. Unavailable public information is left Unscored rather than being treated as Low.
Key Developments in the Portion-Control Meals Market
- In September 2024, Nestle (Lean Cuisine) expanded its USA portion-control portfolio when Nestlé USA launched the Vital Pursuit brand nationwide through Walmart, Target, and Kroger. The initial range included 14 thoughtfully portioned frozen meals with at least 20 grams of protein and essential nutrients. The launch expanded purpose-built options for consumers managing weight or using GLP-1 medications and demonstrated that smaller high-protein portions can be positioned in mainstream frozen retail.
- In June 2026, Conagra (Healthy Choice) introduced six new Healthy Choice meals across its Café, Café Steamers, and Simply Steamers lines. All six carried the GLP-1 On Track badge, while four Café entrees provided 12 to 15 grams of protein and were a good source of fiber. The expansion increased the number of portioned frozen options that shoppers can identify quickly for a weight-management routine.
- In May 2026, Factor (HelloFresh) launched production at its Factor facility in Verden, Germany. HelloFresh said the site would produce selected ready-to-eat meals for Germany, Denmark, Sweden, Belgium, and the Netherlands, while expanding European operating capacity. The action gives Factor a larger regional production base for fresh prepared meals and improves its ability to support direct delivery across several European markets.
- In May 2025, WeightWatchers announced a strategic partnership with UK digital weight-health provider CheqUp. The partnership combined CheqUp’s GLP-1 medication service with WeightWatchers behavioral and nutrition support for people using weight-management medication. The development does not add meal manufacturing capacity, but it strengthens a guidance channel that can influence how medication users select smaller, protein-aware, and nutritionally structured meals.
Key Players in the Portion-Control Meals Market
Retail Frozen Portion Platforms
- Nestle (Lean Cuisine)
- Conagra (Healthy Choice)
- Kraft Heinz (Smart Ones)
- Amy’s Kitchen
Structured Weight-Management Meal Programs
- Nutrisystem
- BistroMD
- Jenny Craig
Prepared Meal Delivery and Nutrition Platforms
- Factor (HelloFresh)
- Trifecta
- WeightWatchers
Portion-Control Meals Market – Report Scope
| Coverage field | Report scope |
|---|---|
| Market breakdown | By Product Type, Calorie Band, Diet Claim, Packaging, Sales Channel, and Region. |
| Quantitative Units | USD billion. |
| Market Definition | Revenue from portion-defined meals sold within the listed segmentation universe. This includes frozen entrees, fresh prepared meals, shelf-stable meals, meal kits, and snack-sized meal packs positioned as meals. It excludes restaurant and foodservice revenue, general non-portioned prepared meals, standalone supplements or beverages, raw ingredients, and adjacent substitute products. |
| Regions Covered | North America; Latin America; Western Europe; Eastern Europe; East Asia; South Asia and Pacific; Middle East and Africa |
| Countries Covered | USA, UK, Germany, Japan, South Korea, and more than twenty-five additional countries in the full report |
| Key Companies Profiled | Nestle (Lean Cuisine), Conagra (Healthy Choice), Kraft Heinz (Smart Ones), Nutrisystem, Factor (HelloFresh), Trifecta, BistroMD, WeightWatchers, Jenny Craig, Amy’s Kitchen |
| Forecast Period | 2026 to 2036 |
| Approach | Market sizing uses a hybrid bottom-up and top-down approach that reconciles company, channel, product, and country evidence within the defined revenue boundary. |
Portion-Control Meals Market – Research Methodology
| Method | Approach |
|---|---|
| Primary Research | Structured primary discussions focus on manufacturers, prepared-meal operators, distributors, retailers, nutrition and weight-management specialists, and buyer-side stakeholders. The research tests product boundaries, purchase criteria, channel behavior, pricing logic, and adoption frictions without relying on a single respondent type. |
| Desk Research | Desk research reviews government and regulator statistics, public company filings, first-party product documentation, company news releases, trade information, and relevant standards. Sources are included only when they support the defined meal market, buyer behavior, country context, or a dated company action. |
| Market Sizing and Forecasting | Market sizing and forecasting reconcile company, product, channel, and country inputs with observed demand mechanisms. Forecast assumptions consider pricing, product mix, distribution expansion, nutrition-led innovation, policy conditions, and the pace at which trial converts into repeat purchasing. |
| Data Validation | Validation cross-checks figures and narrative conclusions against the market boundary. The process removes double counting, unsupported claims, and revenue from adjacent categories while reconciling market values, segment leadership, country CAGRs, and company roles across the report. |
Portion-Control Meals Market by Segments
Portion-Control Meals Market segmented by Product Type:
- Frozen Entrees
- Fresh Prepared Meals
- Shelf-Stable Meals
- Meal Kits
- Snack-Sized Meal Packs
Portion-Control Meals Market segmented by Calorie Band:
- 301-400 kcal
- 200-300 kcal
- 401-500 kcal
- Under 200 kcal
- Others
Portion-Control Meals Market segmented by Diet Claim:
- Weight Management
- High-Protein
- Low-Carb
- Diabetic-Friendly
- Heart-Healthy
Portion-Control Meals Market segmented by Packaging:
- Trays
- Bowls
- Pouches
- Multi-Compartment Packs
- Others
Portion-Control Meals Market segmented by Sales Channel:
- Supermarkets & Hypermarkets
- Online / DTC
- Convenience Stores
- Specialty & Health Stores
- Others
Portion-Control Meals Market by Region:
- North America
- United States
- Canada
- Latin America
- Brazil
- Mexico
- Argentina
- Chile
- Western Europe
- Germany
- France
- United Kingdom
- Italy
- Spain
- Benelux
- Nordics
- Eastern Europe
- Poland
- Czech Republic
- Romania
- Hungary
- East Asia
- China
- Japan
- South Korea
- South Asia and Pacific
- India
- ASEAN
- Australia and New Zealand
- Middle East and Africa
- GCC Countries
- South Africa
- Türkiye
- Israel
Research
- USA Food and Drug Administration (2024, March 5). Serving Size on the Nutrition Facts Label.
- Office for Health Improvement and Disparities (2025, May 7). Obesity profile: short statistical commentary, May 2025.
- Federal Ministry of Food and Agriculture, Germany (2024, January 17). Good Food for Germany – the Food and Nutrition Strategy.
- Ministry of Agriculture, Forestry and Fisheries, Japan (2024, March). Survey Report on Attitudes toward Shokuiku.
- Korea Disease Control and Prevention Agency (2025, November 25). One in Three Korean Adults Is Obese.
- Nestlé USA (2024, September 18). Vital Pursuit Hits Shelves Nationwide as First-to-Market Nestlé Brand Designed for GLP-1 Users.
- Conagra Brands (2026, June 24). Conagra Brands Kicks Off Summer with Exciting New Introductions.
- HelloFresh SE (2026, May 6). HelloFresh Group Launches Factor Production in Verden.
- WeightWatchers (2025, May 22). CheqUp and WeightWatchers Announce Strategic Partnership to Support Growing Use of GLP-1 Medications in the UK.
- Nutrisystem (Accessed 2026, August 13). How It Works – Diet Meal Plans for Weight Loss.
- BistroMD (Accessed 2026, August 13). Signature Program.
- Trifecta (Accessed 2026, August 13). Get Lean Meal Plan.
- Kraft Heinz (Accessed 2026, August 13). Smart Ones Frozen Meals.
- Jenny Craig (Accessed 2026, August 13). Diet and Weight Loss Plans.
- Amy’s Kitchen (Accessed 2026, August 13). Our Foods.
This bibliography is provided for reader reference and is not exhaustive. The full report contains the complete reference list and detailed citations
This Report Answers
- What is the Portion-Control Meals Market size in 2026 and what value is forecast by 2036?
- What weight-management, nutrition, and convenience pressures support demand for portion-control meals?
- Why do Frozen Entrees hold the leading position within Product Type?
- How does the 301-400 kcal band influence meal design and downstream purchase decisions?
- Why does Weight Management hold the leading position within Diet Claim?
- How do growth rates differ across USA, UK, Germany, Japan, and South Korea?
- Which companies compete through retail frozen meals, direct meal programs, prepared delivery, or nutrition platforms?
- How do price per meal, taste, satiety, and operating convenience limit repeat adoption?
- What should retail category managers and digital commerce leaders evaluate before listing or purchasing portion-control meals?
Frequently Asked Questions
How big is the portion-control meals market in 2026?
The portion-control meals market is valued at USD 5.2 billion in 2026
What is the CAGR of the portion-control meals market from 2026 to 2036?
The portion-control meals market is projected to grow at a CAGR of 7.1% between 2026 and 2036
Which product type segment leads the portion-control meals market?
Frozen Entrees are projected to account for 28.1% of the product type category in 2026
How much value will the portion-control meals market add between 2026 and 2036?
The market is expected to add USD 5.1 billion in value between 2026 and 2036
Which companies are active in the portion-control meals market?
Key companies operating in the market include Nestle (Lean Cuisine), Conagra (Healthy Choice), Kraft Heinz (Smart Ones), Nutrisystem, Factor (HelloFresh), Trifecta, BistroMD, WeightWatchers, Jenny Craig, and Amy’s Kitchen
Preview the report firsthand – request a free sample
Get Sample
Get the brochure for pricing and purchase details
Get PDF
Table of Content
- Key Takeaways
- Market Size and CAGR
- Top Growth Driver
- Fastest Growing Segment
- Leading Region
- Key Companies
- Emerging Opportunities
- Executive Summary
- Global Market Outlook
- Demand-side Trends
- Supply-side Trends
- Technology Roadmap Analysis
- Analysis and Recommendations
- Analyst Perspective (What is happening? Why now? What should investors know?)
- Key Questions Answered
- How large is the market?
- What is the CAGR?
- What are key trends?
- Which region dominates?
- Who are the leaders?
- Market Overview
- Market Coverage / Taxonomy
- Market Definition / Scope / Limitations
- Research Methodology
- Chapter Orientation
- Analytical Lens and Working Hypotheses
- Market Structure, Signals, and Trend Drivers
- Benchmarking and Cross-market Comparability
- Market Sizing, Forecasting, and Opportunity Mapping
- Research Design and Evidence Framework
- Desk Research Programme (Secondary Evidence)
- Expert Input and Fieldwork (Primary Evidence)
- Tooling, Models, and Reference Databases
- Data Engineering and Model Build
- Quality Assurance and Audit Trail
- Market Background
- Market Dynamics (Drivers, Restraints, Opportunity, Trends)
- Scenario Forecast (Optimistic, Likely, Conservative)
- Impact Analysis
- AI Impact
- Sustainability Impact
- Regulatory Impact
- Technology Impact
- Consumer / Buyer Analysis
- Purchase Drivers
- Adoption Barriers
- Buyer Journey
- Opportunity Map Analysis
- Product Life Cycle Analysis
- Supply Chain Analysis
- Investment Feasibility Matrix
- Value Chain Analysis
- PESTLE and Porter’s Analysis
- Regulatory Landscape
- Regional Parent Market Outlook
- Production and Consumption Statistics
- Import and Export Statistics
- Global Market Analysis and Forecast, 2021 to 2036
- Historical Market Size Value (USD Billion) Analysis, 2021 to 2025
- Current and Future Market Size Value (USD Billion) Projections, 2026 to 2036
- Y-o-Y Growth Trend Analysis
- Absolute $ Opportunity Analysis
- Global Market Pricing Analysis, 2021 to 2036
- Global Market Analysis and Forecast, By Product Type, 2021 to 2036
- Introduction / Key Findings
- Historical Market Size Value (USD Billion) Analysis By Product Type, 2021 to 2025
- Current and Future Market Size Value (USD Billion) Analysis and Forecast By Product Type, 2026 to 2036
- Frozen Entrees
- Fresh Prepared Meals
- Shelf-Stable Meals
- Meal Kits
- Snack-Sized Meal Packs
- Y-o-Y Growth Trend Analysis By Product Type, 2021 to 2025
- Absolute $ Opportunity Analysis By Product Type, 2026 to 2036
- Global Market Analysis and Forecast, By Calorie Band, 2021 to 2036
- Introduction / Key Findings
- Historical Market Size Value (USD Billion) Analysis By Calorie Band, 2021 to 2025
- Current and Future Market Size Value (USD Billion) Analysis and Forecast By Calorie Band, 2026 to 2036
- 301-400 kcal
- 200-300 kcal
- 401-500 kcal
- Under 200 kcal
- Others
- Y-o-Y Growth Trend Analysis By Calorie Band, 2021 to 2025
- Absolute $ Opportunity Analysis By Calorie Band, 2026 to 2036
- Global Market Analysis and Forecast, By Diet Claim, 2021 to 2036
- Introduction / Key Findings
- Historical Market Size Value (USD Billion) Analysis By Diet Claim, 2021 to 2025
- Current and Future Market Size Value (USD Billion) Analysis and Forecast By Diet Claim, 2026 to 2036
- Weight Management
- High-Protein
- Low-Carb
- Diabetic-Friendly
- Heart-Healthy
- Y-o-Y Growth Trend Analysis By Diet Claim, 2021 to 2025
- Absolute $ Opportunity Analysis By Diet Claim, 2026 to 2036
- Global Market Analysis and Forecast, By Packaging, 2021 to 2036
- Introduction / Key Findings
- Historical Market Size Value (USD Billion) Analysis By Packaging, 2021 to 2025
- Current and Future Market Size Value (USD Billion) Analysis and Forecast By Packaging, 2026 to 2036
- Trays
- Bowls
- Pouches
- Multi-Compartment Packs
- Others
- Y-o-Y Growth Trend Analysis By Packaging, 2021 to 2025
- Absolute $ Opportunity Analysis By Packaging, 2026 to 2036
- Global Market Analysis and Forecast, By Sales Channel, 2021 to 2036
- Introduction / Key Findings
- Historical Market Size Value (USD Billion) Analysis By Sales Channel, 2021 to 2025
- Current and Future Market Size Value (USD Billion) Analysis and Forecast By Sales Channel, 2026 to 2036
- Supermarkets & Hypermarkets
- Online / DTC
- Convenience Stores
- Specialty & Health Stores
- Others
- Y-o-Y Growth Trend Analysis By Sales Channel, 2021 to 2025
- Absolute $ Opportunity Analysis By Sales Channel, 2026 to 2036
- Global Market Analysis and Forecast, By Region, 2021 to 2036
- Introduction
- Historical Market Size Value (USD Billion) Analysis By Region, 2021 to 2025
- Current Market Size Value (USD Billion) Analysis and Forecast By Region, 2026 to 2036
- North America
- Latin America
- Western Europe
- Eastern Europe
- East Asia
- South Asia and Pacific
- Middle East & Africa
- Market Attractiveness Analysis By Region
- North America Market Analysis and Forecast, By Country, 2021 to 2036
- Historical Market Size Value (USD Billion) Trend Analysis By Market Taxonomy, 2021 to 2025
- Market Size Value (USD Billion) Forecast By Market Taxonomy, 2026 to 2036
- By Country
- USA
- Canada
- By Product Type
- By Calorie Band
- By Diet Claim
- By Packaging
- By Sales Channel
- By Country
- Market Attractiveness Analysis
- By Country
- By Product Type
- By Calorie Band
- By Diet Claim
- By Packaging
- By Sales Channel
- Key Takeaways
- Latin America Market Analysis and Forecast, By Country
- Historical Market Size Value (USD Billion) Trend Analysis By Market Taxonomy, 2021 to 2025
- Market Size Value (USD Billion) Forecast By Market Taxonomy, 2026 to 2036
- By Country
- Brazil
- Mexico
- Chile
- Rest of Latin America
- By Product Type
- By Calorie Band
- By Diet Claim
- By Packaging
- By Sales Channel
- By Country
- Market Attractiveness Analysis
- By Country
- By Product Type
- By Calorie Band
- By Diet Claim
- By Packaging
- By Sales Channel
- Key Takeaways
- Western Europe Market Analysis and Forecast, By Country
- Historical Market Size Value (USD Billion) Trend Analysis By Market Taxonomy, 2021 to 2025
- Market Size Value (USD Billion) Forecast By Market Taxonomy, 2026 to 2036
- By Country
- Germany
- UK
- Italy
- Spain
- France
- Nordic
- BENELUX
- Rest of Western Europe
- By Product Type
- By Calorie Band
- By Diet Claim
- By Packaging
- By Sales Channel
- By Country
- Market Attractiveness Analysis
- By Country
- By Product Type
- By Calorie Band
- By Diet Claim
- By Packaging
- By Sales Channel
- Key Takeaways
- Eastern Europe Market Analysis and Forecast, By Country
- Historical Market Size Value (USD Billion) Trend Analysis By Market Taxonomy, 2021 to 2025
- Market Size Value (USD Billion) Forecast By Market Taxonomy, 2026 to 2036
- By Country
- Russia
- Poland
- Hungary
- Balkan & Baltic
- Rest of Eastern Europe
- By Product Type
- By Calorie Band
- By Diet Claim
- By Packaging
- By Sales Channel
- By Country
- Market Attractiveness Analysis
- By Country
- By Product Type
- By Calorie Band
- By Diet Claim
- By Packaging
- By Sales Channel
- Key Takeaways
- East Asia Market Analysis and Forecast, By Country
- Historical Market Size Value (USD Billion) Trend Analysis By Market Taxonomy, 2021 to 2025
- Market Size Value (USD Billion) Forecast By Market Taxonomy, 2026 to 2036
- By Country
- China
- Japan
- South Korea
- By Product Type
- By Calorie Band
- By Diet Claim
- By Packaging
- By Sales Channel
- By Country
- Market Attractiveness Analysis
- By Country
- By Product Type
- By Calorie Band
- By Diet Claim
- By Packaging
- By Sales Channel
- Key Takeaways
- South Asia and Pacific Market Analysis and Forecast, By Country
- Historical Market Size Value (USD Billion) Trend Analysis By Market Taxonomy, 2021 to 2025
- Market Size Value (USD Billion) Forecast By Market Taxonomy, 2026 to 2036
- By Country
- India
- ASEAN
- Australia & New Zealand
- Rest of South Asia and Pacific
- By Product Type
- By Calorie Band
- By Diet Claim
- By Packaging
- By Sales Channel
- By Country
- Market Attractiveness Analysis
- By Country
- By Product Type
- By Calorie Band
- By Diet Claim
- By Packaging
- By Sales Channel
- Key Takeaways
- Middle East & Africa Market Analysis and Forecast, By Country
- Historical Market Size Value (USD Billion) Trend Analysis By Market Taxonomy, 2021 to 2025
- Market Size Value (USD Billion) Forecast By Market Taxonomy, 2026 to 2036
- By Country
- Kingdom of Saudi Arabia
- Other GCC Countries
- Türkiye
- South Africa
- Other African Union
- Rest of Middle East & Africa
- By Product Type
- By Calorie Band
- By Diet Claim
- By Packaging
- By Sales Channel
- By Country
- Market Attractiveness Analysis
- By Country
- By Product Type
- By Calorie Band
- By Diet Claim
- By Packaging
- By Sales Channel
- Key Takeaways
- Key Countries Market Analysis
- USA
- Pricing Analysis
- Market Share Analysis, 2025
- By Product Type
- By Calorie Band
- By Diet Claim
- By Packaging
- By Sales Channel
- Canada
- Pricing Analysis
- Market Share Analysis, 2025
- By Product Type
- By Calorie Band
- By Diet Claim
- By Packaging
- By Sales Channel
- Mexico
- Pricing Analysis
- Market Share Analysis, 2025
- By Product Type
- By Calorie Band
- By Diet Claim
- By Packaging
- By Sales Channel
- Brazil
- Pricing Analysis
- Market Share Analysis, 2025
- By Product Type
- By Calorie Band
- By Diet Claim
- By Packaging
- By Sales Channel
- Chile
- Pricing Analysis
- Market Share Analysis, 2025
- By Product Type
- By Calorie Band
- By Diet Claim
- By Packaging
- By Sales Channel
- Germany
- Pricing Analysis
- Market Share Analysis, 2025
- By Product Type
- By Calorie Band
- By Diet Claim
- By Packaging
- By Sales Channel
- UK
- Pricing Analysis
- Market Share Analysis, 2025
- By Product Type
- By Calorie Band
- By Diet Claim
- By Packaging
- By Sales Channel
- Italy
- Pricing Analysis
- Market Share Analysis, 2025
- By Product Type
- By Calorie Band
- By Diet Claim
- By Packaging
- By Sales Channel
- Spain
- Pricing Analysis
- Market Share Analysis, 2025
- By Product Type
- By Calorie Band
- By Diet Claim
- By Packaging
- By Sales Channel
- France
- Pricing Analysis
- Market Share Analysis, 2025
- By Product Type
- By Calorie Band
- By Diet Claim
- By Packaging
- By Sales Channel
- India
- Pricing Analysis
- Market Share Analysis, 2025
- By Product Type
- By Calorie Band
- By Diet Claim
- By Packaging
- By Sales Channel
- ASEAN
- Pricing Analysis
- Market Share Analysis, 2025
- By Product Type
- By Calorie Band
- By Diet Claim
- By Packaging
- By Sales Channel
- Australia & New Zealand
- Pricing Analysis
- Market Share Analysis, 2025
- By Product Type
- By Calorie Band
- By Diet Claim
- By Packaging
- By Sales Channel
- China
- Pricing Analysis
- Market Share Analysis, 2025
- By Product Type
- By Calorie Band
- By Diet Claim
- By Packaging
- By Sales Channel
- Japan
- Pricing Analysis
- Market Share Analysis, 2025
- By Product Type
- By Calorie Band
- By Diet Claim
- By Packaging
- By Sales Channel
- South Korea
- Pricing Analysis
- Market Share Analysis, 2025
- By Product Type
- By Calorie Band
- By Diet Claim
- By Packaging
- By Sales Channel
- Russia
- Pricing Analysis
- Market Share Analysis, 2025
- By Product Type
- By Calorie Band
- By Diet Claim
- By Packaging
- By Sales Channel
- Poland
- Pricing Analysis
- Market Share Analysis, 2025
- By Product Type
- By Calorie Band
- By Diet Claim
- By Packaging
- By Sales Channel
- Hungary
- Pricing Analysis
- Market Share Analysis, 2025
- By Product Type
- By Calorie Band
- By Diet Claim
- By Packaging
- By Sales Channel
- Kingdom of Saudi Arabia
- Pricing Analysis
- Market Share Analysis, 2025
- By Product Type
- By Calorie Band
- By Diet Claim
- By Packaging
- By Sales Channel
- Türkiye
- Pricing Analysis
- Market Share Analysis, 2025
- By Product Type
- By Calorie Band
- By Diet Claim
- By Packaging
- By Sales Channel
- South Africa
- Pricing Analysis
- Market Share Analysis, 2025
- By Product Type
- By Calorie Band
- By Diet Claim
- By Packaging
- By Sales Channel
- USA
- Market Structure Analysis
- Competition Dashboard
- Competition Benchmarking
- Market Share Analysis of Top Players
- By Regional
- By Product Type
- By Calorie Band
- By Diet Claim
- By Packaging
- By Sales Channel
- Emerging Startups
- Innovation Benchmarking
- Competition Analysis
- Competition Deep Dive
- Nestle (Lean Cuisine)
- Overview
- Product Portfolio
- Profitability by Market Segments
- Sales Footprint
- Strategy Overview
- Marketing Strategy
- Product Strategy
- Channel Strategy
- Conagra (Healthy Choice)
- Kraft Heinz (Smart Ones)
- Nutrisystem
- Factor (HelloFresh)
- Trifecta
- BistroMD
- WeightWatchers
- Jenny Craig
- Amy’s Kitchen
- Nestle (Lean Cuisine)
- Case Studies
- Success Stories
- Recent Developments
- Competition Deep Dive
- Assumptions & Acronyms Used
- Table 1: Global Market Value (USD Billion) Forecast by Region, 2021 to 2036
- Table 2: Global Market Value (USD Billion) Forecast by Product Type, 2021 to 2036
- Table 3: Global Market Value (USD Billion) Forecast by Calorie Band, 2021 to 2036
- Table 4: Global Market Value (USD Billion) Forecast by Diet Claim, 2021 to 2036
- Table 5: Global Market Value (USD Billion) Forecast by Packaging, 2021 to 2036
- Table 6: Global Market Value (USD Billion) Forecast by Sales Channel, 2021 to 2036
- Table 7: North America Market Value (USD Billion) Forecast by Country, 2021 to 2036
- Table 8: North America Market Value (USD Billion) Forecast by Product Type, 2021 to 2036
- Table 9: North America Market Value (USD Billion) Forecast by Calorie Band, 2021 to 2036
- Table 10: North America Market Value (USD Billion) Forecast by Diet Claim, 2021 to 2036
- Table 11: North America Market Value (USD Billion) Forecast by Packaging, 2021 to 2036
- Table 12: North America Market Value (USD Billion) Forecast by Sales Channel, 2021 to 2036
- Table 13: Latin America Market Value (USD Billion) Forecast by Country, 2021 to 2036
- Table 14: Latin America Market Value (USD Billion) Forecast by Product Type, 2021 to 2036
- Table 15: Latin America Market Value (USD Billion) Forecast by Calorie Band, 2021 to 2036
- Table 16: Latin America Market Value (USD Billion) Forecast by Diet Claim, 2021 to 2036
- Table 17: Latin America Market Value (USD Billion) Forecast by Packaging, 2021 to 2036
- Table 18: Latin America Market Value (USD Billion) Forecast by Sales Channel, 2021 to 2036
- Table 19: Western Europe Market Value (USD Billion) Forecast by Country, 2021 to 2036
- Table 20: Western Europe Market Value (USD Billion) Forecast by Product Type, 2021 to 2036
- Table 21: Western Europe Market Value (USD Billion) Forecast by Calorie Band, 2021 to 2036
- Table 22: Western Europe Market Value (USD Billion) Forecast by Diet Claim, 2021 to 2036
- Table 23: Western Europe Market Value (USD Billion) Forecast by Packaging, 2021 to 2036
- Table 24: Western Europe Market Value (USD Billion) Forecast by Sales Channel, 2021 to 2036
- Table 25: Eastern Europe Market Value (USD Billion) Forecast by Country, 2021 to 2036
- Table 26: Eastern Europe Market Value (USD Billion) Forecast by Product Type, 2021 to 2036
- Table 27: Eastern Europe Market Value (USD Billion) Forecast by Calorie Band, 2021 to 2036
- Table 28: Eastern Europe Market Value (USD Billion) Forecast by Diet Claim, 2021 to 2036
- Table 29: Eastern Europe Market Value (USD Billion) Forecast by Packaging, 2021 to 2036
- Table 30: Eastern Europe Market Value (USD Billion) Forecast by Sales Channel, 2021 to 2036
- Table 31: East Asia Market Value (USD Billion) Forecast by Country, 2021 to 2036
- Table 32: East Asia Market Value (USD Billion) Forecast by Product Type, 2021 to 2036
- Table 33: East Asia Market Value (USD Billion) Forecast by Calorie Band, 2021 to 2036
- Table 34: East Asia Market Value (USD Billion) Forecast by Diet Claim, 2021 to 2036
- Table 35: East Asia Market Value (USD Billion) Forecast by Packaging, 2021 to 2036
- Table 36: East Asia Market Value (USD Billion) Forecast by Sales Channel, 2021 to 2036
- Table 37: South Asia and Pacific Market Value (USD Billion) Forecast by Country, 2021 to 2036
- Table 38: South Asia and Pacific Market Value (USD Billion) Forecast by Product Type, 2021 to 2036
- Table 39: South Asia and Pacific Market Value (USD Billion) Forecast by Calorie Band, 2021 to 2036
- Table 40: South Asia and Pacific Market Value (USD Billion) Forecast by Diet Claim, 2021 to 2036
- Table 41: South Asia and Pacific Market Value (USD Billion) Forecast by Packaging, 2021 to 2036
- Table 42: South Asia and Pacific Market Value (USD Billion) Forecast by Sales Channel, 2021 to 2036
- Table 43: Middle East & Africa Market Value (USD Billion) Forecast by Country, 2021 to 2036
- Table 44: Middle East & Africa Market Value (USD Billion) Forecast by Product Type, 2021 to 2036
- Table 45: Middle East & Africa Market Value (USD Billion) Forecast by Calorie Band, 2021 to 2036
- Table 46: Middle East & Africa Market Value (USD Billion) Forecast by Diet Claim, 2021 to 2036
- Table 47: Middle East & Africa Market Value (USD Billion) Forecast by Packaging, 2021 to 2036
- Table 48: Middle East & Africa Market Value (USD Billion) Forecast by Sales Channel, 2021 to 2036
- Figure 1: Global Market Pricing Analysis
- Figure 2: Global Market Value (USD Billion) Forecast 2021-2036
- Figure 3: Global Market Value Share and BPS Analysis by Product Type, 2026 and 2036
- Figure 4: Global Market Y-o-Y Growth Comparison by Product Type, 2026-2036
- Figure 5: Global Market Attractiveness Analysis by Product Type
- Figure 6: Global Market Value Share and BPS Analysis by Calorie Band, 2026 and 2036
- Figure 7: Global Market Y-o-Y Growth Comparison by Calorie Band, 2026-2036
- Figure 8: Global Market Attractiveness Analysis by Calorie Band
- Figure 9: Global Market Value Share and BPS Analysis by Diet Claim, 2026 and 2036
- Figure 10: Global Market Y-o-Y Growth Comparison by Diet Claim, 2026-2036
- Figure 11: Global Market Attractiveness Analysis by Diet Claim
- Figure 12: Global Market Value Share and BPS Analysis by Packaging, 2026 and 2036
- Figure 13: Global Market Y-o-Y Growth Comparison by Packaging, 2026-2036
- Figure 14: Global Market Attractiveness Analysis by Packaging
- Figure 15: Global Market Value Share and BPS Analysis by Sales Channel, 2026 and 2036
- Figure 16: Global Market Y-o-Y Growth Comparison by Sales Channel, 2026-2036
- Figure 17: Global Market Attractiveness Analysis by Sales Channel
- Figure 18: Global Market Value (USD Billion) Share and BPS Analysis by Region, 2026 and 2036
- Figure 19: Global Market Y-o-Y Growth Comparison by Region, 2026-2036
- Figure 20: Global Market Attractiveness Analysis by Region
- Figure 21: North America Market Incremental Dollar Opportunity, 2026-2036
- Figure 22: Latin America Market Incremental Dollar Opportunity, 2026-2036
- Figure 23: Western Europe Market Incremental Dollar Opportunity, 2026-2036
- Figure 24: Eastern Europe Market Incremental Dollar Opportunity, 2026-2036
- Figure 25: East Asia Market Incremental Dollar Opportunity, 2026-2036
- Figure 26: South Asia and Pacific Market Incremental Dollar Opportunity, 2026-2036
- Figure 27: Middle East & Africa Market Incremental Dollar Opportunity, 2026-2036
- Figure 28: North America Market Value Share and BPS Analysis by Country, 2026 and 2036
- Figure 29: North America Market Value Share and BPS Analysis by Product Type, 2026 and 2036
- Figure 30: North America Market Y-o-Y Growth Comparison by Product Type, 2026-2036
- Figure 31: North America Market Attractiveness Analysis by Product Type
- Figure 32: North America Market Value Share and BPS Analysis by Calorie Band, 2026 and 2036
- Figure 33: North America Market Y-o-Y Growth Comparison by Calorie Band, 2026-2036
- Figure 34: North America Market Attractiveness Analysis by Calorie Band
- Figure 35: North America Market Value Share and BPS Analysis by Diet Claim, 2026 and 2036
- Figure 36: North America Market Y-o-Y Growth Comparison by Diet Claim, 2026-2036
- Figure 37: North America Market Attractiveness Analysis by Diet Claim
- Figure 38: North America Market Value Share and BPS Analysis by Packaging, 2026 and 2036
- Figure 39: North America Market Y-o-Y Growth Comparison by Packaging, 2026-2036
- Figure 40: North America Market Attractiveness Analysis by Packaging
- Figure 41: North America Market Value Share and BPS Analysis by Sales Channel, 2026 and 2036
- Figure 42: North America Market Y-o-Y Growth Comparison by Sales Channel, 2026-2036
- Figure 43: North America Market Attractiveness Analysis by Sales Channel
- Figure 44: Latin America Market Value Share and BPS Analysis by Country, 2026 and 2036
- Figure 45: Latin America Market Value Share and BPS Analysis by Product Type, 2026 and 2036
- Figure 46: Latin America Market Y-o-Y Growth Comparison by Product Type, 2026-2036
- Figure 47: Latin America Market Attractiveness Analysis by Product Type
- Figure 48: Latin America Market Value Share and BPS Analysis by Calorie Band, 2026 and 2036
- Figure 49: Latin America Market Y-o-Y Growth Comparison by Calorie Band, 2026-2036
- Figure 50: Latin America Market Attractiveness Analysis by Calorie Band
- Figure 51: Latin America Market Value Share and BPS Analysis by Diet Claim, 2026 and 2036
- Figure 52: Latin America Market Y-o-Y Growth Comparison by Diet Claim, 2026-2036
- Figure 53: Latin America Market Attractiveness Analysis by Diet Claim
- Figure 54: Latin America Market Value Share and BPS Analysis by Packaging, 2026 and 2036
- Figure 55: Latin America Market Y-o-Y Growth Comparison by Packaging, 2026-2036
- Figure 56: Latin America Market Attractiveness Analysis by Packaging
- Figure 57: Latin America Market Value Share and BPS Analysis by Sales Channel, 2026 and 2036
- Figure 58: Latin America Market Y-o-Y Growth Comparison by Sales Channel, 2026-2036
- Figure 59: Latin America Market Attractiveness Analysis by Sales Channel
- Figure 60: Western Europe Market Value Share and BPS Analysis by Country, 2026 and 2036
- Figure 61: Western Europe Market Value Share and BPS Analysis by Product Type, 2026 and 2036
- Figure 62: Western Europe Market Y-o-Y Growth Comparison by Product Type, 2026-2036
- Figure 63: Western Europe Market Attractiveness Analysis by Product Type
- Figure 64: Western Europe Market Value Share and BPS Analysis by Calorie Band, 2026 and 2036
- Figure 65: Western Europe Market Y-o-Y Growth Comparison by Calorie Band, 2026-2036
- Figure 66: Western Europe Market Attractiveness Analysis by Calorie Band
- Figure 67: Western Europe Market Value Share and BPS Analysis by Diet Claim, 2026 and 2036
- Figure 68: Western Europe Market Y-o-Y Growth Comparison by Diet Claim, 2026-2036
- Figure 69: Western Europe Market Attractiveness Analysis by Diet Claim
- Figure 70: Western Europe Market Value Share and BPS Analysis by Packaging, 2026 and 2036
- Figure 71: Western Europe Market Y-o-Y Growth Comparison by Packaging, 2026-2036
- Figure 72: Western Europe Market Attractiveness Analysis by Packaging
- Figure 73: Western Europe Market Value Share and BPS Analysis by Sales Channel, 2026 and 2036
- Figure 74: Western Europe Market Y-o-Y Growth Comparison by Sales Channel, 2026-2036
- Figure 75: Western Europe Market Attractiveness Analysis by Sales Channel
- Figure 76: Eastern Europe Market Value Share and BPS Analysis by Country, 2026 and 2036
- Figure 77: Eastern Europe Market Value Share and BPS Analysis by Product Type, 2026 and 2036
- Figure 78: Eastern Europe Market Y-o-Y Growth Comparison by Product Type, 2026-2036
- Figure 79: Eastern Europe Market Attractiveness Analysis by Product Type
- Figure 80: Eastern Europe Market Value Share and BPS Analysis by Calorie Band, 2026 and 2036
- Figure 81: Eastern Europe Market Y-o-Y Growth Comparison by Calorie Band, 2026-2036
- Figure 82: Eastern Europe Market Attractiveness Analysis by Calorie Band
- Figure 83: Eastern Europe Market Value Share and BPS Analysis by Diet Claim, 2026 and 2036
- Figure 84: Eastern Europe Market Y-o-Y Growth Comparison by Diet Claim, 2026-2036
- Figure 85: Eastern Europe Market Attractiveness Analysis by Diet Claim
- Figure 86: Eastern Europe Market Value Share and BPS Analysis by Packaging, 2026 and 2036
- Figure 87: Eastern Europe Market Y-o-Y Growth Comparison by Packaging, 2026-2036
- Figure 88: Eastern Europe Market Attractiveness Analysis by Packaging
- Figure 89: Eastern Europe Market Value Share and BPS Analysis by Sales Channel, 2026 and 2036
- Figure 90: Eastern Europe Market Y-o-Y Growth Comparison by Sales Channel, 2026-2036
- Figure 91: Eastern Europe Market Attractiveness Analysis by Sales Channel
- Figure 92: East Asia Market Value Share and BPS Analysis by Country, 2026 and 2036
- Figure 93: East Asia Market Value Share and BPS Analysis by Product Type, 2026 and 2036
- Figure 94: East Asia Market Y-o-Y Growth Comparison by Product Type, 2026-2036
- Figure 95: East Asia Market Attractiveness Analysis by Product Type
- Figure 96: East Asia Market Value Share and BPS Analysis by Calorie Band, 2026 and 2036
- Figure 97: East Asia Market Y-o-Y Growth Comparison by Calorie Band, 2026-2036
- Figure 98: East Asia Market Attractiveness Analysis by Calorie Band
- Figure 99: East Asia Market Value Share and BPS Analysis by Diet Claim, 2026 and 2036
- Figure 100: East Asia Market Y-o-Y Growth Comparison by Diet Claim, 2026-2036
- Figure 101: East Asia Market Attractiveness Analysis by Diet Claim
- Figure 102: East Asia Market Value Share and BPS Analysis by Packaging, 2026 and 2036
- Figure 103: East Asia Market Y-o-Y Growth Comparison by Packaging, 2026-2036
- Figure 104: East Asia Market Attractiveness Analysis by Packaging
- Figure 105: East Asia Market Value Share and BPS Analysis by Sales Channel, 2026 and 2036
- Figure 106: East Asia Market Y-o-Y Growth Comparison by Sales Channel, 2026-2036
- Figure 107: East Asia Market Attractiveness Analysis by Sales Channel
- Figure 108: South Asia and Pacific Market Value Share and BPS Analysis by Country, 2026 and 2036
- Figure 109: South Asia and Pacific Market Value Share and BPS Analysis by Product Type, 2026 and 2036
- Figure 110: South Asia and Pacific Market Y-o-Y Growth Comparison by Product Type, 2026-2036
- Figure 111: South Asia and Pacific Market Attractiveness Analysis by Product Type
- Figure 112: South Asia and Pacific Market Value Share and BPS Analysis by Calorie Band, 2026 and 2036
- Figure 113: South Asia and Pacific Market Y-o-Y Growth Comparison by Calorie Band, 2026-2036
- Figure 114: South Asia and Pacific Market Attractiveness Analysis by Calorie Band
- Figure 115: South Asia and Pacific Market Value Share and BPS Analysis by Diet Claim, 2026 and 2036
- Figure 116: South Asia and Pacific Market Y-o-Y Growth Comparison by Diet Claim, 2026-2036
- Figure 117: South Asia and Pacific Market Attractiveness Analysis by Diet Claim
- Figure 118: South Asia and Pacific Market Value Share and BPS Analysis by Packaging, 2026 and 2036
- Figure 119: South Asia and Pacific Market Y-o-Y Growth Comparison by Packaging, 2026-2036
- Figure 120: South Asia and Pacific Market Attractiveness Analysis by Packaging
- Figure 121: South Asia and Pacific Market Value Share and BPS Analysis by Sales Channel, 2026 and 2036
- Figure 122: South Asia and Pacific Market Y-o-Y Growth Comparison by Sales Channel, 2026-2036
- Figure 123: South Asia and Pacific Market Attractiveness Analysis by Sales Channel
- Figure 124: Middle East & Africa Market Value Share and BPS Analysis by Country, 2026 and 2036
- Figure 125: Middle East & Africa Market Value Share and BPS Analysis by Product Type, 2026 and 2036
- Figure 126: Middle East & Africa Market Y-o-Y Growth Comparison by Product Type, 2026-2036
- Figure 127: Middle East & Africa Market Attractiveness Analysis by Product Type
- Figure 128: Middle East & Africa Market Value Share and BPS Analysis by Calorie Band, 2026 and 2036
- Figure 129: Middle East & Africa Market Y-o-Y Growth Comparison by Calorie Band, 2026-2036
- Figure 130: Middle East & Africa Market Attractiveness Analysis by Calorie Band
- Figure 131: Middle East & Africa Market Value Share and BPS Analysis by Diet Claim, 2026 and 2036
- Figure 132: Middle East & Africa Market Y-o-Y Growth Comparison by Diet Claim, 2026-2036
- Figure 133: Middle East & Africa Market Attractiveness Analysis by Diet Claim
- Figure 134: Middle East & Africa Market Value Share and BPS Analysis by Packaging, 2026 and 2036
- Figure 135: Middle East & Africa Market Y-o-Y Growth Comparison by Packaging, 2026-2036
- Figure 136: Middle East & Africa Market Attractiveness Analysis by Packaging
- Figure 137: Middle East & Africa Market Value Share and BPS Analysis by Sales Channel, 2026 and 2036
- Figure 138: Middle East & Africa Market Y-o-Y Growth Comparison by Sales Channel, 2026-2036
- Figure 139: Middle East & Africa Market Attractiveness Analysis by Sales Channel
- Figure 140: Global Market – Tier Structure Analysis
- Figure 141: Global Market – Company Share Analysis
