


Download PDF
Abstract
Dietary protein is a key regulator of metabolic health in humans and rodents. Many of the benefits of protein restriction are mediated by reduced intake of dietary branched-chain amino acids (leucine, valine and isoleucine) and restriction of the branched-chain amino acids is sufficient to extend healthspan and lifespan in mice. Here we find that valine restriction (Val-R) improves metabolic health in C57BL/6J mice, promotes leanness and glycemic control across ages, and reduces frailty, cancer prevalence and senescent cell burden in both sexes while increasing median male lifespan by 23%. Assessing gene relationships across tissues, we identified a liver gene module enriched in mitochondrial pathways and increased mitochondrial respiration in Val-R-fed male mice. Our results demonstrate that Val-R improves multiple aspects of healthspan in mice of both sexes, extends lifespan in male mice and suggests that interventions that mimic Val-R may have translational potential for aging and age-related diseases.
Dietary interventions strongly influence healthspan and lifespan. Protein consumption has traditionally been thought of as beneficial for healthy aging, as protein promotes satiety and supports weight loss1,2, and increased protein intake is often recommended for older adults to combat sarcopenia3. However, several retrospective and prospective cohort studies link higher protein consumption to diseases of aging, including diabetes4,5,6,7 and sarcopenia8. Randomized clinical trials show that protein restriction (PR) improves metabolic health, reducing adiposity and improving insulin sensitivity9,10,11. Finally, multiple studies show that PR promotes metabolic health and extends lifespan in flies and mice12,13,14,15,16.
Many benefits of PR may be owing to reduced intake of specific essential amino acids, particularly the branched-chain amino acids (BCAAs; leucine, isoleucine and valine). Blood levels of BCAAs are specifically reduced by PR in humans10, and restriction of the BCAAs improves metabolic health in C57BL/6J mice of both sexes and extends the lifespan of male mice by over 30%15. Isoleucine is the most potent of the BCAAs in its impact on metabolic health, and restriction of isoleucine improves metabolic health and extends the lifespan of both flies and UM-HET3 mice17,18,19,20,21.
While this previous work demonstrates an important effect of isoleucine on metabolism and aging, the impact of restricting either leucine or valine on healthy aging and lifespan has not been investigated. Although leucine activates mTORC1, a central regulator of metabolism and aging22,23, restriction of leucine in our hands provides minimal metabolic benefits, and leucine supplementation has been found to not impact lifespan21,24,25. By contrast, recent work shows that valine is associated with cancer, inflammation, insulin resistance and glucotoxicity in mouse and cell culture models26,27,28,29. Further, dietary restriction of valine alone reverses diet-induced obesity and restores glucoregulatory control in C57BL/6J male mice21,25.
Here, we investigate the hypothesis that valine restriction (Val-R) increases the healthspan and lifespan of mice. We find that lifelong Val-R improves metabolic health and reduces frailty in C57BL/6J mice of both sexes, and increases the lifespan of male but not female mice when started at 1 month of age. While Val-R also improves cognitive function in female mice, we observed a stronger reduction in neuroinflammatory glia in Val-R-fed female mice. Val-R induced sex-specific transcriptional changes across tissues, including altering PI3K–AKT signaling, a pathway whose downregulation is associated with longevity in multiple organisms. Surprisingly, at the protein level, we observed increased AKT activity and activation of its downstream targets in the liver, including mTORC1. An increase in activity of either AKT or mTORC1 would generally be associated with accelerated aging and reduced lifespan, prompting us to look deeper for potential mechanisms to explain the beneficial effects of Val-R. Analyzing transcriptional networks across tissues, we identified a hub module enriched for mitochondrial metabolism genes; examining mitochondrial activity in the liver, we found that Val-R induces a male-specific increase in mitochondrial respiration. These findings support dietary Val-R as a potential intervention for age-related diseases, and expand the universe of dietary components that control healthy aging.
Results
Val-R improves the metabolic health of male and female mice
We began our lifespan study by assigning male and female C57BL/6J mice to one of two amino acid (AA)-defined diets starting at 4 weeks of age and followed them longitudinally (Fig. 1a). Our control (CTL) diet contained all 20 common AAs; the diet composition reflects that of a natural chow in which 21% of calories are derived from protein. The experimental diet reduced the level of valine by 67% (valine-restricted diet). Diets were isocaloric, with identical levels of fat and carbohydrates; reduced valine was offset by an increase in non-essential AAs, keeping the calories derived from AAs constant (Supplementary Table 1).
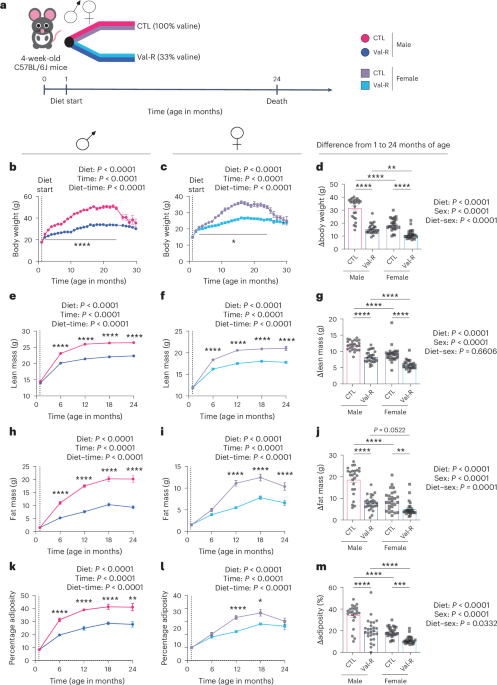
a, The experimental design. b–d, The body weight of male (b) and female (c) mice over 30 months and change in body weight from 1 month of age until 24 months of age (d); *P < 0.05, **P = 0.0077, ****P < 0.0001. e–g, Lean mass of male (e) and female (f) mice over 30 months and change in lean mass from 1 month of age until 24 months of age (g); ****P < 0.0001. h–j, Fat mass of male (h) and female (i) mice over 30 months and change in body weight from 1 month of age until 24 months of age (j); **P = 0.0051, ****P < 0.0001. k–m, Percentage adiposity of male (k) and female (l) mice over 30 months and change in body weight from 1 month of age until 24 months of age (m); *P = 0.0121, **P = 0.0018, ***P = 0.0007, ****P < 0.0001. For b, c, e, f, h, i, k and l, n varies by month; maximum n = 37 mice per group; two-way repeated measures ANOVA was used; *P < 0.05, **P < 0.01, ***P < 0.001, ****P < 0.0001. P values from a Sidak’s post-test examining the effect of parameters were identified as significant in the two-way ANOVA; statistics for the overall effects of time or sex, diet and the interaction represent the P value from a two-way ANOVA. For d, g, j and m, n = 25, 26, 26 and 27, respectively; statistics for the overall effects of sex, diet and the interaction represent the P value from a two-way ANOVA; P values from a Sidak’s post-test examining the effect of parameters were identified as significant in the two-way ANOVA. The n values denote biologically independent animals and are listed in the order of CTL male mice, Val-R male mice, CTL female mice and Val-R female mice. Data are represented as mean ± s.e.m.
Source data
We measured body weight monthly and assessed body composition every 6 months. Val-R-fed mice of both sexes gained weight more slowly than CTL-fed mice, with a highly significant difference at 24 months of age (Fig. 1b–d). The lower weight of Val-R-fed mice reflected reduced accretion of both lean mass and fat mass; the greater impact on fat mass led to reduced adiposity in both sexes (Fig. 1e–m). Val-R-fed mice had reduced inguinal white adipose tissue (iWAT) and epididymal WAT (eWAT) mass, as well as a reduced iWAT:eWAT ratio, but mass of the quadricep muscle relative to body weight was increased (Supplementary Fig. 1).
Micro-computed tomography (μCT) analysis showed no effect of Val-R on femur or tibia length, indicating that there was no effect of diet on skeletal growth (Supplementary Fig. 2a–c). In male mice, Val-R significantly decreased total cross-sectional area of the femur, with a proportional decrease in marrow area, indicating inhibition of radial bone expansion; the reduction in total cross-sectional area was associated with reduced mean polar moment of inertia (Supplementary Fig. 2d–m). In female mice, Val-R reduced trabecular thickness at the femur distal metaphysis, suggesting reduced bone remodeling (Supplementary Fig. 2j–m).
While decreased weight and adiposity can result from reduced calorie intake, this was not the case; Val-R-fed mice consumed more calories (but less valine) relative to their body weight than CTL-fed mice (Fig. 2a–d). Metabolic chamber analysis showed that Val-R significantly increased energy expenditure in both sexes at 18 months of age (Fig. 2e,f,h,i); we observed a similar overall effect throughout the lifespan, reaching statistical significance at 12 and 18 months of age in both sexes, and at 24 months of age in male mice (Fig. 2g,j). Despite matched macronutrient composition, the respiratory exchange ratio was higher in Val-R-fed male mice throughout their life, and higher in Val-R-fed female mice before 24 months of age (Supplementary Fig. 3a,b). The increased energy expenditure was not explained by increased activity, which was unchanged in Val-R-fed male mice and lower in Val-R-fed female mice than in CTL-fed mice (Supplementary Fig. 3c,d).
a, Kilocalorie intake per day per gram of body weight (kcal day−1 g−1 BW) measured over 24 months on diet in male mice (n varies by month; maximum n = 18; aP < 0.1, *P = 0.0194, **P = 0.0071, 0.0028, 0.0046, ****P < 0.0001). b, Kilocalories derived from valine per gram of body weight (valine kcal g−1 BW) over 24 months on diet in male mice (n varies by month; maximum n = 18; *P < 0.05, **P < 0.01). c,d, Kcal day−1 g−1 BW (c) and valine kcal/g BW (d) over 24 months on diet in female mice (n varies by month; maximum n = 18; a = P < 0.1, *P = 0.0115, **P < 0.01, ****P < 0.0001). e,f, The energy expenditure of male mice as a function of body weight in the light (e) and dark (f) phase at 18 months of age (n = 15 and 16). g, The average energy expenditure normalized to body weight at 6, 12, 18 and 24 months of age in male mice (n varies by month; maximum n = 15 and 16; ****P < 0.0001). h,i, The energy expenditure of female mice as a function of body weight in the light (h) and dark (i) phase at 18 months of age (n = 12 and 11 mice per group). j, The average energy expenditure normalized to body weight at 6, 12, 18 and 24 months of age in female mice (n varies by month; maximum n = 12 and 11; ****P < 0.0001). k,l Representative images (k) and quantified number of monolocular cells per 100 µm2 in BAT (l) (n = 9, 6, 9 and 8 mice per group; *P = 0.0160, ***P = 0.0001). m–o, The log2 fold change of gene expression from RNA sequencing analysis in the BAT of preselected genes relating to thermogenesis (m), lipogenesis and lipolysis (n) and SERCA1 and SERCA2 (o) (n = 9, 6, 9 and 10 mice per group; moderated t-test; *P < 0.05). p, The log2 fold change of gene expression from RNA sequencing analysis in the muscle of preselected genes related to SERCA1 and SERCA2 (n = 9, 6, 9 and 10 mice per group; moderated t-test; *P < 0.05). In a–d, g and j, statistics for the overall effects of time, diet and the interaction represent the P value from a two-way ANOVA analysis. For e, f, h and i, data for each individual mouse are plotted; simple linear regression (ANCOVA) was calculated to determine whether the slopes or elevations are equal; if the slopes are significantly different, differences in elevation cannot be determined. In l, statistics for the overall effects of sex, diet and the interaction represent the Pvalue from a two-way ANOVA. In a–d, g, j and l, P values from a Sidak’s post-test examining the effect of parameters were identified as significant in the two-way ANOVA. The n values denote biologically independent animals and are listed in the order of CTL male mice, Val-R male mice, CTL female mice and Val-R female mice. Data are represented as mean ± s.e.m.
Source data
The effects of PR on energy balance are mediated by fibroblast growth factor 21 (FGF21), which promotes the beiging of iWAT14,30,31,32,33. However, Val-R did not increase FGF21 levels in the blood (Extended Data Fig. 1a), and we observed no change in the phosphorylation of eIF2α, an upstream regulator of FGF21 (refs. 34,35,36), in liver or muscle (Supplementary Fig. 3e,l). Consistent with this, while Val-R induces beiging in young mice21, the adipocytes of 24-month-old Val-R-fed mice were monolocular and similar in size to those of CTL-fed mice (Extended Data Fig. 1b,c). Despite this lack of change in adipocyte morphology, Val-R produced an overall significant increase in thermogenic gene expression, including a significant elevation of Elovl3 in both sexes (Extended Data Fig. 1d,e) and increased UCP1 protein in male mice (Extended Data Fig. 1f,g).
We next turned to brown adipose tissue (BAT). Val-R reduced the number of monolocular cells, significantly in male mice (Fig. 2k,l), suggesting a shift away from lipid storage and toward utilization of lipids for thermogenesis. Expression of Elovl3 was increased, along with an overall increase in lipogenesis-related genes and a modest increase in lipolysis-related genes in the BAT of both sexes (Fig. 2m,n), suggesting enhanced futile lipid cycling to promote thermogenesis. SERCA1-related genes were upregulated, suggesting an increase in SERCA1-mediated futile calcium cycling (Fig. 2o). Thus, Val-R mice of both sexes may engage UCP1-independent thermogenic mechanisms in BAT. In muscle, Val-R induced a male-specific increase in Sln and a nonsignificant increase in Ryr2 (P = 0.068) (Fig. 2p), suggesting that Val-R-fed male mice may also engage thermogenesis in the muscle. Overall, Val-R increased canonical and noncanonical thermogenesis across multiple tissues.
Assessing glycemic control, we found that Val-R-fed male mice displayed improved glucose tolerance as early as 3 months of age and throughout life, even at 24 months of age (Fig. 3a–c and Supplementary Fig. 4a,b,e,f,i,j,m,n). Male Val-R-fed mice tended to be more sensitive to intraperitoneal administration of insulin than CTL-fed male mice, which was significant at 12 months of age (Fig. 3d–f). Although glucose-stimulated insulin secretion (GSIS) and HOMA2-IR were unchanged (Fig. 3g,h), Val-R increased HOMA2 %B, suggesting improved pancreatic beta cell function (Fig. 3i). Val-R feeding resulted in a significant effect on alanine tolerance, suggesting that Val-R improves hepatic insulin sensitivity in male mice (Supplementary Fig. 4q).
a, A graph showing glucose tolerance test area under the curve (GTT AUC) over time in male mice (n varies by month; maximum n = 12 mice per group; *P = 0.0443, **P = 0.0014, 0.0038, ****P < 0.0001). b,c, A GTT (b) performed at 24 months of age and its GTT AUC (c) in male mice (n = 9 and 10 mice per group; *P = 0.0491). d, An insulin tolerance test (ITT) AUC over time in male mice (n varies by month; maximum n = 13; *P = 0.0113). e,f, An ITT (e) performed at 12 months of age and its ITT AUC (f) in male mice (n = 13 and 12; *P = 0.243, ***P = 0.0008). g, A GSIS assay performed in male mice at 19 months of age (n = 8 and 7 mice per group). h,i, HOMA2-IR (h) and HOMA2 %B (i) calculated at 19 months of age in male mice (n = 7 and 6 mice per group; *P = 0.0257). j, A GTT AUC over time in female mice (n varies by month; maximum n = 12 mice per group; **P = 0.0017, 0.0081, ****P < 0.0001). k,l, A GTT (k) performed at 24 months of age and its GTT AUC (l) in female mice (n = 9 and 10; *P = 0.0386, 0.0113, **P = 0.0018). m, An ITT AUC over time in female mice (n varies by month; maximum n = 9 and 12 mice per group). n,o, An ITT (n) performed at 12 months of age and its ITT AUC (o) in female mice (n = 8 and 9 mice per group; **P = 0.0074). p, A GSIS assay performed at 19 months of age in female mice (n = 8 mice per group). q,r, HOMA2-IR (q) and HOMA2 %B (r) calculated at 19 months of age in female mice (n = 7 mice per group, *P = 0.0103). For a, b, d, e, g, j, k, m, n and p, statistics for the overall effects of time, diet and the interaction represent the P value from a two-way ANOVA analysis. For a–r, *P < 0.05, **P < 0.01, ***P < 0.001, ****P < 0.0001 from a (a, b, d, e, g, j, k, m, n and p) Sidak’s post-test examining the effect of parameters identified as significant in the two-way ANOVA or (c, f, h, i, l, o, q and r) two-tailed student’s t-test. The n values denote biologically independent animals and are listed in the order of CTL male mice, Val-R male mice, CTL female mice and Val-R female mice. Data are represented as mean ± s.e.m.
Source data
Female Val-R mice similarly showed improved glucose tolerance throughout most of their life (Fig. 3j–l and Supplementary Fig. 4c,d,g,h,k,l,o,p), but unlike male mice, showed no overall change in the response to intraperitoneal insulin (Fig. 3m–o). As in male mice, GSIS and HOMA2-IR were unchanged in Val-R-fed female mice while beta cell function (HOMA2 %B) increased (Fig. 3p–r), and alanine tolerance improved (Supplementary Fig. 4r). Overall, Val-R feeding improved glycemic control in both sexes.
Hepatic insulin sensitivity is influenced by hepatic lipid deposition. Val-R led to a reduction in hepatic lipid droplet size in 24-month-old mice of both sexes, which was significant in male mice (Extended Data Fig. 2a,b). Total lipid droplet area decreased (Extended Data Fig. 2c), while the total number of lipid droplets increased with Val-R feeding in both sexes (Extended Data Fig. 2d). There was an overall effect of diet on hepatic and plasma triglycerides in both sexes, with Val-R-fed male mice having significantly less hepatic triglycerides and significantly more plasma triglycerides than CTL-fed male mice (Extended Data Fig. 2e,f). This pattern is consistent with healthy hepatic lipid handling, in which the liver stores few triglycerides and exports fatty acids for utilization by other tissues, such as muscle and adipose tissue37.
Tissue- and sex-specific molecular effects of Val-R
To investigate the molecular impact of Val-R across tissues, we performed transcriptional profiling of BAT, liver and muscle of 24-month-old CTL-fed and Val-R-fed mice of both sexes. Principal component analysis (PCA) showed that gene expression profiles grouped strongly by tissue type (Fig. 4a). Visualizing the top 50 most variable genes across samples, we found that muscle and BAT shared more similar gene expression profiles than liver, with the exception of Ucp1, which was more highly expressed in BAT than in other tissues (Fig. 4b).
a, A PCA plot. b, The top 50 DEGs in the liver, muscle and adipose tissue. c, A Venn diagram of the number of gene changes by tissue in male and female mice. d, A KEGG pathway analysis in liver, muscle and BAT in male and female mice. e, Altered genes in the BCAA degradation pathway in the liver, muscle and BAT. a–e, n = 9, 6, 9 and 10 mice per group; *P < 0.05, moderated t-test. The n values denote biologically independent animals and are listed in the order of CTL male mice, Val-R male mice, CTL female mice and Val-R female mice.
Source data
Transcriptional responses to Val-R were highly tissue- and sex-specific. Liver exhibited the strongest response to Val-R, with over 2,500 differentially expressed genes (DEGs) in both sexes. In BAT, there were nearly 1,000 DEGs in female mice versus 196 in male mice, while muscle showed over 400 DEGs in female mice but only 6 DEGs in male mice. No DEGs were shared across all three tissues in male mice, and only seven DEGs were shared across tissues in female mice (Fig. 4c)
Pathway enrichment likewise showed strong tissue and sex specificity, with the greatest number of pathways altered by Val-R in the liver, fewer pathways altered in muscle and BAT, and a strongly sex-specific response (Fig. 4d). In female liver, Val-R upregulated the ‘valine, leucine and isoleucine degradation’ pathway; examination at the gene level showed BCAA degradation genes were broadly induced across both sexes in all tissues, with the strongest and most sex-specific changes occurring in the liver (Fig. 4e).
In the liver, Val-R upregulated ‘fatty acid degradation’ and ‘primary bile acid biosynthesis’ in both sexes, along with several pathways associated with neurological diseases. Multiple immune pathways were downregulated by Val-R in both sexes, as were ‘apoptosis’, ‘lipid and atherosclerosis’, ‘lysosome’, ‘necroptosis’ and ‘osteoclast differentiation’. Female livers upregulated metabolic pathways in response to Val-R, including ‘oxidative phosphorylation’, ‘thermogenesis’, ‘tryptophan metabolism’ and ‘reactive oxygen species’, with a downregulation of the ‘adipocytokine signaling pathway.’ Male livers upregulated ‘ribosome’ and ‘ribosome biogenesis in eukaryotes’ in response to Val-R, and downregulated ‘VEGF signaling’ and immune pathways (Fig. 4d). Most pathways altered in muscle and BAT were altered only in female mice. In the muscle, only ‘autophagy’ and ‘polycomb repressive complex’ were upregulated by Val-R in female mice. In BAT, metabolic pathways, including ‘steroid biosynthesis’ were upregulated in both sexes, and the ‘insulin signaling pathway’ was upregulated in female mice (Fig. 4d).
BCAAs activate mTORC1, and protein or BCAA restriction reduces mTORC1 signaling in multiple tissues12,15,20,38,39,40. Consistent with decreased mTORC1 signaling, we observed downregulation of ‘lysosome’ in the liver; however, in male mice, we also observed an increase in ‘ribosome and ribosome biogenesis in eukaryotes’ (Fig. 4d). Examining the genes in ribosome-related pathways, we found that Val-R induced most ribosomal genes in male liver as well as several genes in the livers of female mice (Extended Data Fig. 3a,b). At the protein level, Val-R increased mTORC1 signaling in the livers of both sexes, significantly increasing the phosphorylation of the mTORC1 substrate S6K1 T389 (Extended Data Fig. 3c,d,f,g). In male liver, Val-R significantly increased autophagy markers, with a nonsignificant increase in the level of LC3 and LC3 cleavage (P = 0.0987) (Extended Data Fig. 3e,h). These results collectively suggest that Val-R increased hepatic mTORC1 activity.
In the muscle, several ribosomal genes were upregulated in Val-R-fed female mice (Extended Data Fig. 3a,b). In contrast to the liver, Val-R did not significantly alter mTORC1 signaling or autophagy at the protein level in male muscle (Supplementary Fig. 5a–c). Female muscle showed a trend (P = 0.0594) toward reduced mTORC1 signaling and no significant difference in autophagy (Supplementary Fig. 5d–f), although LC3AB level was elevated nonsignificantly, potentially explaining our transcriptomic data.
Val-R reduces neuroinflammation in both sexes and improves short-term memory in female mice
To assess the effects of Val-R on cognitive function, we performed a novel object recognition (NOR) test at 27 months of age. We observed a diet–sex interaction (P = 0.0543) on short-term memory (STM), with Val-R-fed female mice, but not male mice, showing an improved ability to recognize a novel object (Fig. 5a). By contrast, Val-R did not improve long-term memory (LTM) in either sex (Fig. 5b)
a,b, The NOR test discrimination index in the STM test of male and female mice (a) and the LTM test in male and female mice (b) (n = 10, 11, 13 and 14 mice per group). c,e,g, Representative images of Iba1 staining in the Arc (c), CA3 (e) and DG (g) of the brain. Scale bar, 200 µm. d,f,h, Quantified staining of Iba1 in the Arc (d), CA3 (f) and DG (h) (n = 3, 4, 5 and 6 mice per group; *P = 0.0144, **P = 0.0019, ****P < 0.0001). For a, b, d, f and h, statistics for the overall effects of sex, diet and the interaction represent the P value from a two-way ANOVA analysis; P values from a Sidak’s post-test examining the effect of parameters were identified as significant in the two-way ANOVA. The n values denote biologically independent animals and are listed in the order of CTL male mice, Val-R male mice, CTL female mice and Val-R female mice. Data are represented as mean ± s.e.m.
Source data
Neuroinflammation increases with age and contributes to cognitive decline as well as Alzheimer’s disease41,42,43. We therefore quantified microglia and astrocytes by immunostaining brain sections with antiglial fibrillary acidic protein (GFAP), an astrocyte marker, or anti-ionized calcium-binding adapter molecule 1 (IBA-1), a microglia marker. We focused on the arcuate nucleus (Arc) of the hypothalamus, a region critical for energy homeostasis, as well as the subregions of the hippocampus, the CA3 region and the dentate gyrus (DG), which play a role in memory acquisition and memory retrieval. Val-R reduced IBA1 in all three regions of the brain (Fig. 5c–h), and it reduced GFAP in the Arc and CA3 (Supplementary Fig. 6a–f) in male mice. Val-R also reduced IBA1 in the Arc and significantly reduced GFAP in the DG of female mice (Fig. 5c,d and Supplementary Fig. 6c,d). We also observed a significant diet–sex interaction in IBA1 staining of the Arc, indicating a stronger suppression of inflammation by Val-R in male mice (Fig. 5c,h).
We analyzed skeletal morphology of hippocampal microglia and astrocytes as structural indicators of activation/reactivity44,45, as activation of these cells is associated with chronic, damaging neuroinflammation that disrupts neuronal homeostasis and impairs brain function46,47,48. Microglia skeletal analysis revealed a diet–sex interaction for process length and bounding circle diameter (Extended Data Fig. 4a–f), with Val-R increasing these in male mice only, and suggesting that Val-R promotes an overall ramified or resting state in male mice only. Female mice in general displayed shorter process lengths and reduced fractional dimension compared to male mice (Extended Data Fig. 4a–f), suggesting that female mice may have somewhat more activated microglia than male mice. Furthermore, female mice had increased lacunarity (greater structural gaps) in Val-R-fed conditions (Extended Data Fig. 4a–f), suggesting that female Val-R-fed mice may have somewhat more activated microglia than controls. Astrocyte skeletal analysis uncovered a diet–sex interaction for total number of endpoints and process lengths, with a Val-R diet reducing these in male but not female mice (Supplementary Fig. 6g–k), consistent with decreased astrocytic hypertrophy and reactivity in male mice.
Val-R improves healthspan and lifespan
We comprehensively assessed healthspan during aging. As both mice and humans become increasingly frail with age, we utilized a mouse frailty index49 to assess the impact of Val-R on frailty in both sexes starting at approximately 12 months of age. In both sexes, Val-R feeding resulted in a lower frailty index as compared to their CTL-fed counterparts at multiple time points across age (Fig. 6a,b), primarily owing to improvements in the ‘physical/musculoskeletal’ and ‘discomfort’ categories (Supplementary Fig. 7a–l).
a,b, Frailty index scoring of male (a) and female (b) mice from 12 to 32 months of age (n varies by month; maximum n = 25, 22, 25 and 24; *P = 0.0350, **P = 0.0060, 0.0029, 0.076). c, Rotarod latency to fall in seconds at 12, 18 and 24 months of age in male mice (n varies by month; maximum n = 20 mice per group). d, Inverted cling latency to fall in seconds at 12, 18 and 24 months of age in male mice (n varies by month; maximum n = 20 mice per group; ****P < 0.0001). e, Rotarod latency to fall in seconds at 12, 18 and 24 months of age in female mice (n varies by month; maximum n = 19, 20 mice per group). f, Inverted cling latency to fall in seconds at 12, 18 and 24 months of age in female mice (n varies by month; maximum n = 19, 20 mice per group). g, Void spot assay conducted in 27-month-old male and female mice (n = 8, 10, 12 and 11 mice per group; *P = 0.0080). h, Percentage of male and female mice with and without cancer observed at necropsy from lifespan in i–k (statistic from Fischer’s exact test). i, Left: Kaplan–Meier plot showing the survival of male and female mice (n = 37 biologically independent animals for both groups; log-rank test). Right: a table of median lifespans for mice on each diet, percentage change between Val-R-fed and CTL-fed mice of the same sex and the two-sided Gehan–Breslow–Wilcoxon P value between Val-R-fed and CTL-fed mice of the same sex. j, Kaplan–Meier plots showing the survival of male mice (n = 37 biologically independent animals for each diet; log-rank test). k, Kaplan–Meier plots showing the survival of female mice (n = 37 biologically independent animals for each diet; log-rank test). l, A table of maximum lifespan calculations was created by generating a cut-off of the top 25% longest-lived animals in each sex, coupled with Boschloo’s test (Wang–Allison) for significance testing between groups. x1 and n1 refer to the number of CTL mice in the longest-lived quartile and the total number of CTL mice of that sex, respectively, while x2 and n2 refer to the same proportion for Val-R mice of that sex. m, The maximum lifespan of the top ten longest-lived mice per group per sex (n = 10 mice per group; **P = 0.0016). n, FAMY in years was calculated using the survival and frailty data plotted in a, b, j and k (n = 25, 22, 24 and 23 mice per group; **P = 0.0083). o, GRAIL in years calculated using the survival and frailty data plotted in a, b, j and k (n = 25, 22, 24 and 23 mice per group; ***P = 0.0004, ****P < 0.0001). In a–g and m–o, statistics for the overall effects of time or sex, diet and the interaction represent the P value from a two-way ANOVA analysis; P values from a Sidak’s post-test examining the effect of parameters were identified as significant in the two-way ANOVA. The n values denote biologically independent animals and are listed in the order of CTL male mice, Val-R male mice, CTL female mice and Val-R female mice. Data are represented as mean ± s.e.m.
Source data
We performed rotarod and inverted cling assays to assess muscle coordination and grip strength, respectively. Val-R did not improve rotarod performance in either sex (Fig. 6c,e and Supplementary Fig. 8a–c,e,f), while age reduced performance regardless of diet. Male Val-R-fed mice had improved inverted cling performance at all ages tested (Fig. 6d); however, analysis of covariance (ANCOVA) suggests that this was primarily due to lower body weight (Supplementary Fig. 8a–f). Val-R-fed female mice showed an overall effect of diet on inverted cling performance that did not reach significance at any single age (Fig. 7f). When analyzed by ANCOVA, Val-R-fed female mice performed worse on the rotarod than CTL-fed female mice at all time points, reaching statistical significance at 12 and 24 months of age, and had slightly worse, though not significantly so, inverted cling performance than CTL-fed female mice at all ages (Supplementary Fig. 8g,l). We also normalized inverted cling time by body weight; using this approach, we found that there was an overall effect of diet in both sexes, and that Val-R-fed male mice, but not female mice, had increased cling time at every time point (Supplementary Fig. 8m,n).
a, Pearson correlation coefficient between the gene modules and selected phenotypic traits (numbers in brackets indicate the corresponding P values in male mice) (n = 9, 6, 9 and 10 mice per group; two-tailed t-test). b, Selected KEGG pathway enrichment of the turquoise module. The gray dots indicate no alterations in that pathway for that tissue. Statistical analysis was performed using a one-tailed t-test. c, Altered genes in the PI3K–AKT signaling pathway in the liver, muscle and BAT. The genes shown were significantly altered (Benjamini–Hochberg adjusted P < 0.05) by Val-R in at least one tissue in male or female mice (n = 9, 6, 9 and 10 mice per group). d, Western blots of the analyzed proteins in male livers. e, Phosphorylation of AKT S473 normalized to the expression of AKT; **P = 0.0019. f, Phosphorylation of FoxO1 and FoxO3a normalized to HSP90; **P = 0.0081. In e,f, n = 6 mice per group; *P < 0.05, t-test. The n values denote biologically independent animals and are listed in the order of CTL male mice, Val-R male mice, CTL female mice and Val-R female mice. Data are represented as mean ± s.e.m. ECM, extracellular matrix. STD, standard.
Source data
Lower urinary tract dysfunction increases with age50. Assessing urinary frequency, we found that Val-R-fed male mice had significantly less urinary spotting compared to their CTL-fed counterparts (Fig. 6g); no difference was observed in female mice (Fig. 6g)
Cancer is a major cause of death in C57BL6/J mice51,52. Gross necropsy at death or upon meeting criteria for euthanasia revealed an overall reduction in cancer observed at necropsy in Val-R-fed mice when we pooled male and female mice together (as there was no significant effect of sex). When analyzed separately, we found that Val-R reduced the prevalence of cancer in female mice, and nonsignificantly (P = 0.0559) in male mice (Fig. 6h). Most cancers observed were probably hepatocellular carcinoma, or lymphoma and leukemia as indicated by splenomegaly, but the cancers were not formally assessed by a pathologist.
Lifelong consumption of a Val-R diet significantly extended lifespan (P = 0.03, stratified log-rank test), and Cox regression likewise indicated a significant effect of diet on survival (hazard rate (HR) 0.0163) without a diet-by-sex interaction (Fig. 6i). When assessing the sexes separately, we found that a Val-R diet increased the median lifespan of male mice by 23.42% (log-rank, P = 0.0403), and significantly extended maximum lifespan (Wang–Allison, P = 0.02575), but did not significantly extend female lifespan (Fig. 6i–l). Investigating the survival of the top ten longest-lived animals in each group, the top ten Val-R male mice lived a statistically significant 14.5% longer than the top ten CTL-fed male mice; the top ten Val-R-fed female mice had a nonsignificant 7.07% increase in maximum lifespan (Fig. 6m).
Lastly, using the cumulative data on longevity, frailty, healthspan and hallmarks of aging collected during this study, we calculated frailty-adjusted mouse years (FAMY) and gauging robust aging when increasing lifespan (GRAIL), new summary statistics that are analogous to quality-adjusted life years in humans53. Val-R increased FAMY and GRAIL in male mice by 20.29% and 42.08%, respectively (Fig. 6n,o). In female mice, Val-R increased GRAIL by 29.85%, while the 11.89% increase in FAMY was not statistically significant (Fig. 6n,o). Overall, these data demonstrate that Val-R increases healthspan in both sexes.
We also assessed a key hallmark of aging: cellular senescence54. SA-β-Gal staining revealed a significant effect of diet in the liver, which was accompanied by reduced senescence-associated secretory phenotype (SASP) gene expression, including a reduction in Il6st and Ccl2 in male mice and Il1a in female mice, and a reduction in the senescence marker Lmnb1 in female mice (Extended Data Fig. 5a–c). Selected genes were based on CoreScence, a core senescence gene set that generalizes across species, tissues and senescence contexts, and uses senescence signatures that are expressed in at least five senescence datasets, such as SenMayo and SenSig55,56,57. Similarly, there was a significant effect of diet in the kidney, with a diet–sex interaction consistent with a reduction of cellular senescence by Val-R in female but not male mice as assessed by senescence-associated β-galactosidase (SA-β-Gal), as well as a downregulation of senescent and SASP genes (Extended Data Fig. 5d,f). Additional analyses showed overall reductions in senescence and SASP genes in iWAT and BAT of both sexes, and in male eWAT (Extended Data Fig. 5g–i). There was no consistent change in senescence and SASP genes in muscle (Extended Data Fig. 5j), possibly reflecting the small fraction of proliferation-competent cells in this tissue.
Val-R upregulates hepatic mitochondrial respiration
To gain more mechanistic insight into Val-R, we performed weighted gene co-expression network analysis (WGCNA). Selected traits and pathways are shown in Fig. 7 and Extended Data Fig. 6; full tables and pathways can be found in Supplementary Tables 9–12. In male mice, the turquoise module strongly correlated with body composition, valine intake, hepatic lipid droplet size and brain inflammation traits (Fig. 7a). Pathway enrichment identified an enrichment of processes related to metabolism and longevity pathways, including the ‘PI3K–AKT pathway’, ‘MAPK signaling’, ‘AGE–RAGE signaling pathway in diabetic complications’ and ‘metabolic pathways’ (Fig. 7b). As both the PI3K–AKT and MAPK signaling pathways regulate longevity, we examined the genes in these pathways in greater detail. There was no clear effect of Val-R on gene expression of MAPK signaling genes in any tissue, nor was there an effect on the phosphorylation of MAPK/ERK, in the livers of either sex (Supplementary Fig. 9a–f). By contrast, there was an overall downregulation of genes in the PI3K–AKT signaling pathway across tissues in male mice (Fig. 7c), suggesting a potential contribution to the long lifespan of Val-R-fed male mice.
In female mice, the blue module negatively correlated with autophagy and positively correlated with lean mass (Extended Data Fig. 6a). Pathway enrichment identified only three pathways altered in all three tissues (‘hematopoietic cell lineage’, ‘intestinal immune network for IgA production’ and ‘cytokine–cytokine receptor interaction’); none of these were clearly linked to aging (Extended Data Fig. 6b). The ‘PI3K–AKT signaling’ pathway was also enriched in female liver and muscle, though there was no clear effect on most individual genes in this pathway (Extended Data Fig. 6c).
Because the liver showed the greatest changes in the PI3K–AKT signaling pathway, we examined AKT signaling directly. Surprisingly, despite reduced expression of many pathway genes, the phosphorylation of AKT S473 was increased in Val-R male mice (Fig. 7d,e). The phosphorylation of the AKT substrates FOXO1 and FOXO3a were also increased in Val-R-fed male mice, consistent with increased AKT activity (Fig. 7d,f). The increased hepatic mTORC1 activity we observed may result from increased AKT activity, as mTORC1 is downstream of PI3K–AKT. In female mice, phosphorylation of AKT S473 increased nonsignificantly (P = 0.0749), with no change in phosphorylation of FOXO1 or FOXO3a (Extended Data Fig. 6d–f). Together, these data suggest that the longer lifespan of male mice is not the result of reduced PI3K–AKT signaling.
To gain additional mechanistic insight, we used WGCNA, correlating the module eigengene (ME) for each distinct gene module with other module MEs, and constructed an interaction network in Cytoscape (Fig. 8a). This analysis identified the ‘L.Yellow’ (that is, Liver yellow) module as a central hub connecting gene networks across tissues (Fig. 8a). Kyoto Encyclopedia of Genes and Genomes (KEGG) enrichment revealed that many L.Yellow module genes relate to the mitochondria (Fig. 8b). We therefore examined genes involved in mitochondrial regulation, electron transport chain (ETC), fatty acid metabolism and the TCA cycle (Supplementary Fig. 10). While β-oxidation and TCA-related genes changed in both sexes, ETC-related nuclear genes were increased specifically in female mice.
a, ME–ME correlations were used to construct a correlation network in Cytoscape. The color indicates the direction of correlation (red, positive; blue, negative), and thickness is proportional to the strength of correlation (|correlation| range, 0.37–1.0). b, KEGG pathway enrichment of the L.Yellow node using gene set enrichment analysis. c, CS enzyme activity. d, OCR of complex I-driven respiration using NADH and complex IV-driven respiration using ascorbate. e, OCR of complex II-driven respiration using succinate in the presence of rotenone and complex IV-driven respiration using ascorbate. f, OCR normalized to CS activity. c–f include data from male isolated liver mitochondria (n = 8, 7 mice per group). g, CS enzyme activity (*P = 0.0398). h, OCR of complex I-driven respiration using NADH and complex IV-driven respiration using ascorbate. i, OCR of complex II-driven respiration using succinate in the presence of rotenone and complex IV-driven respiration using ascorbate. j, OCR normalized to CS activity. g–j include data from female isolated liver mitochondria (n = 8 mice per group). For c and g, P values were obtained from a two-tailed student’s t-test. For d–f and h–j, statistics for the overall effects of time or complex, diet and the interaction represent the Pvalue from a two-way ANOVA analysis; P values from a Sidak’s post-test examining the effect of parameters were identified as significant in the two-way ANOVA. The n values denote biologically independent animals and are listed in the order of CTL male mice, Val-R male mice, CTL female mice and Val-R female mice. Data are represented as mean ± s.e.m.
Source data
To assess how Val-R affects mitochondrial function, we isolated liver mitochondria. Citrate synthase (CS) activity was unchanged by Val-R in male mice (Fig. 8c), suggesting that there was no diet-induced difference in mitochondrial abundance. However, we observed a significant effect of diet when assessing mitochondrial respiration using either NADH or succinate/rotenone as substrates (Fig. 8d,e). There was a significant effect of diet on the oxygen consumption rate (OCR), with a significant increase in CII and trending increase in succinate/rotenone-derived CIV-mediated (P = 0.0683) respiration in Val-R-fed male mice (Fig. 8f). Mitochondria isolated from the livers of female mice showed no effect of diet on citrate synthesis activity or OCR (Fig. 8g–j). OXPHOS protein abundance was not altered by Val-R in either sex (Extended Data Fig. 7), indicating that the altered mitochondrial complex activity of Val-R-fed male mice is not the result of changes in ETC complex abundance.
Discussion
Dietary protein is a key regulator of healthy aging. Restriction of protein, BCAAs or isoleucine alone promotes healthy aging and extends lifespan in mice, and blood levels of BCAAs are associated with diabetes, insulin resistance and mortality in humans15,17,18,19,21,58,59. Valine has also been linked to adverse metabolic effects, cancer and inflammation21,26,27,28,29. Here we tested whether Val-R improves healthspan and extends longevity. We find lifelong Val-R improves metabolic health in both sexes, extends male lifespan and reduces frailty in both sexes.
The response to Val-R was strongly sex-specific. Transcriptional analysis showed significant upregulation of ‘valine, leucine and isoleucine degradation’ in the livers of Val-R-fed female mice, but not in male mice. Sex difference in BCAA catabolism have been reported previously19,60,61,62, suggesting that female mice may retain greater valine availability during Val-R. Thus, 67% restriction of dietary valine may be insufficient to extend female lifespan; future studies should test if a greater degree of restriction is effective.
We found the strongest effect of Val-R on BCAA degradation genes in the liver. Val-R upregulated numerous genes involved in lipid and fatty acid metabolism, supporting the idea that valine influences fatty acid metabolism and fatty liver disease28,63,64,65. Val-R also altered hepatic lipid droplet size and number in both sexes. This was unexpected, as muscle is canonically the primary site of BCAA catabolism and is very sexually dimorphic. Understanding sex-specific differences in BCAA and AA metabolism may be important to understanding the basis for the beneficial and sex-specific impacts of Val-R and other diets on healthy aging.
Despite weight-normalized preservation of muscle mass, Val-R did not consistently improve functional performance. Improved inverted cling performance was largely explained by reduced body weight. We did not measure muscle strength, quality or fiber type, which will be critical to examine in future studies of valine and muscle function. Although frailty is closely correlated with longevity in both mice and humans66,67, Val-R reduced frailty in female mice without extending lifespan. We previously observed a similar uncoupling in isoleucine-restricted female mice19,53.
WGCNA analysis implicated PI3K–AKT, AGE–RAGE and MAPK signaling across liver, muscle and adipose tissue, with changes in male mice consistent with improved health and longevity68,69,70,71,72,73,74,75,76,77. In male mice, PI3K–AKT pathway genes were overall downregulated by Val-R, while MAPK genes were unchanged. In female mice, module–trait correlations were weaker, the blue module showed only a partial enrichment for PI3K–AKT and MAPK signaling, and there was no consistent pattern of gene expression in PI3K–AKT pathway genes. In contrast to this effect on gene expression, AKT signaling was upregulated at the protein level, with increased phosphorylation of AKT S473 and FOXOs. This may be due to increased insulin sensitivity, but as decreased—not increased—PI3K–AKT signaling is associated with lifespan69,78, it is unlikely that AKT activation is promoting longevity.
Transcriptomics data implicated liver mitochondria as a potential ‘hub’ driving multitissue responses to Val-R. We found a male-specific increase in CII-related respiration and a nonsignificant increase in CIV activity (P = 0.0683), with no changes in OCR in female mice, correlating with the male-specific lifespan extension. Increased CII activity promotes lifespan in Caenorhabditis elegans79, and is induced by rapamycin in flies80, consistent with evidence that altered mitochondrial function promotes lifespan via stress response pathways such as mitohormesis81,82. How Val-R drives these mitochondrial changes, and whether they are responsible for the male-specific effect of Val-R on lifespan remains to be determined. The effect of Val-R on mitochondrial function in other tissues, and the contributions of these effects to the overall effects of Val-R on health, remain to be determined.
There are several limitations of this work. We examined only a single level of restriction, and previous studies have found that different levels of dietary restriction or drugs can yield different effects on lifespan13,83,84,85. Different levels of Val-R may extend female lifespan, and examining the graded response to Val-R may provide new insights. The median lifespan of our CTL-fed male mice was slightly below the range of 810–900 days, which others have suggested as ideal for C57BL/6J male mice; however, it is longer than the CTL lifespan we previously reported15 that this study was based on. Our CTL-fed mice had a relatively high peak body weight; while consistent with prior work17,26, this may have influenced the metabolic baseline of our CTL-fed mice. Our lifespan cohort size (n = 25 per diet and sex) was at the lower end of commonly employed ranges, but provided over 95% power to detect a 20% change in lifespan86.
Longevity was assessed in a single inbred strain, C57BL/6J, with the study starting at 4 weeks of age. The strain used and age of onset were chosen to match conditions of our previous study where PR and BCAA restriction extend male lifespan by over 30%15; however, some of the benefits we observed may result from early life effects. As different strains of mice have distinct responses to lifespan interventions84,87, and interventions that begin later in life are more likely to be translatable, future studies of Val-R should be conducted in other strains of mice, including genetically heterogeneous UM-HET3 mice, and test restriction in fully adult animals.
Our omics analysis was limited to transcriptional profiling, and further unbiased molecular analysis techniques such as metabolomics would probably provide deeper mechanistic insight. We performed SA-β-Gal staining on lightly formalin-fixed tissue, which may reduce sensitivity, and future studies could use fresh tissues. While Val-R overall reduced senescence across tissues and sexes, we saw increased hepatic Cdkn1a (p21) in male mice and Il1b in female mice, suggesting that how Val-R affects senescence may be tissue and context dependent. Behavior analysis was also limited; NOR was the only cognitive assay performed. While Val-R reduced neuroinflammation, future studies should include a more complete array of behavioral phenotyping assays, including tasks that test spatial memory and hippocampal cognition.
Although the diets we used are extremely well-controlled, isocaloric and matched for macronutrient composition and nitrogen content, design choices still had to be made. The protein-to-carbohydrate ratio, the type and levels of dietary carbohydrates and fats consumed, or the ratio of different AAs to valine could all play a role in the responses we observed. The optimal level of protein may vary by age—it is generally believed that older people need to consume more protein —and restricting valine at different ages could lead to different results.
In conclusion, we have shown that dietary restriction of valine can promote healthy aging in both sexes, and extend the lifespan of male, but not female mice. Our results are consistent with a growing consensus showing that higher levels of valine are associated with negative impacts on healthy aging, including insulin resistance, cardiovascular disease and cancer. Additional research will be required to identify the optimal level of dietary valine, especially across mice of different sexes, ages and genetic background, and to identify whether there are negative consequences to Val-R. Our results highlight how protein quality, the specific AAs that make up the protein, is as important in mediating healthy aging as total protein or the number of calories. While additional tests are needed to fully understand how valine affects health in humans, our results support the idea that lowering the amount of dietary valine may promote healthy aging.
Methods
Animal care, housing and diet
All animal procedures were performed in accordance with institutional guidelines and approved by the Institutional Animal Care and Use Committee of the William S. Middleton Memorial Veterans Hospital, under institutional assurance no. D16-00403 (Madison, WI, USA). Male and female C57BL/6J mice were purchased from The Jackson Laboratory at 3 weeks of age. All mice were acclimated to the animal research facility for 1 week before entering studies, and housed in static microisolator cages in a specific pathogen-free facility with a 12:12 h light–dark cycle, maintained at approximately 22 °C and housed two to three mice per cage with ad libitum access to food and water except as specified below for specific procedures. Relative humidity of the animal room ranged between 30% and 70%, with an average of 42%.
Mice were fed AA-defined diets with either full valine (TD.140711; CTL) or a 67% restriction of valine (TD.160735; Val-R) (diet compositions are provided in Supplementary Table 1; Inotiv). Diets were started at 4 weeks of age and continued lifelong
Lifespan study
Mice were assigned to diet groups and enrolled in the survival study at 4 weeks of age (n = 25 mice/diet/sex), a group size that provides approximately 90% power to observe a 15% change in lifespan (α = 0.05)86. Mice were euthanized for humane reasons if moribund, if they developed other problems such as excessive tumor burden or upon the recommendation by the facility veterinarian. Mice found dead were noted during daily inspection and refrigerated. Gross necropsy was performed on euthanized mice and on found dead mice in suitable condition, during which the abdominal and thoracic cavities were examined for the presence of solid tumors, splenomegaly or infection. On the basis of this inspection, the presence or absence of cancer was noted. A second cohort of mice was euthanized at 24 months of age for cross-sectional analysis; all mice in this second cohort were also included in the lifespan analysis (n = 12 mice/diet/sex). We ended up with n = 7–10 mice per group per sex for organ analysis at 24 months of age. Mice were censored as of the date of death if removed for cross-sectional analysis, or if death was due to experimental error (n = 1). The lifespan of all mice can be found in Supplementary Table 6.
Metabolic phenotyping
Glucose, insulin and alanine tolerance tests were performed by fasting all mice for 4 or 16 h and then injecting either glucose (1 g kg−1), insulin (0.75 U kg−1) or alanine (2 g kg−1) intraperitoneally88. Blood glucose levels were determined every 15 min for a 90–120-min period using a Bayer Contour blood glucose meter (Bayer) and test strips. Body composition was determined using an EchoMRI Body Composition Analyzer. For assay of multiple metabolic parameters (O2, CO2, food consumption and activity tracking), mice were acclimatized to housing in a Columbus Instruments Oxymax/CLAMS-HC metabolic chamber system for ~24 h, and data from a continuous 24-h period were then recorded and analyzed.
Physical fitness testing
To assess motor coordination via a rotarod assay, mice were trained at a constant speed of 4 rpm the day before testing. On the day of testing, mice were placed on the rotarod for three rounds, at least 30 min apart, and the average time spent on the rotarod and the maximum speed were recorded. During testing, the rotarod started at a speed of 4 rpm with an acceleration of 0.5 rpm per second up to a maximum of 40 rpm. To assess grip strength via the inverted cling test, mice were placed on a wire frame and carefully inverted, and the time until the mouse fell was recorded. The average time of three rounds of testing conducted at least 30 min apart was calculated.
Frailty index scoring
Frailty was assessed longitudinally using a 30-item list frailty index whose measures are based on procedures outlined in ref. 49; only mice enrolled in the full lifespan study, and not those enrolled for cross-sectional euthanasia, were scored. The items are scored from 0 (no deficit) to 0.5 (mild deficit) to 1 (severe deficit). The 29 criteria scored throughout life include alopecia, body weight, loss of fur color, dermatitis, loss of whiskers, coat condition, tumors, distended abdomen, kyphosis, tail stiffening, gait disorders, tremor, body condition score, vestibular disturbance, cataracts, corneal opacity, eye discharge/swelling, microphthalmia, vision loss, menace reflex, nasal discharge, malocclusions, rectal prolapse, vaginal/uterine/penile prolapse, diarrhea, breathing rate/depth, mouse grimace score and piloerection. Grip strength (assessed by inverted cling time) was scored as a 30th criteria up to 24 months of age. The scores for all items are averaged to give the frailty score. These tests were conducted at 12–13, 18, 24, 28, 31–32 and 32–33 months of age. Complete frailty scores can be found in Supplementary Tables 7 and 8.
Void spot assay
Void spot assays were performed as described previously19,89. Mice were individually placed in standard mouse cages with thick chromatography paper (Ahlstrom). During the study period of 4 h, mice were restricted from water intake. Chromatography papers were imaged with a Bio-Rad ChemiDoc Imaging System (Bio-Rad) using an ethidium bromide filter set and 0.5-s exposure to ultraviolet light. Images were imported into ImageJ and total void spots analyzed with VoidWhizzard
NOR assay
A NOR was performed in an open field where the movements of the mouse were recorded using a camera mounted above the field12. Before each test, mice were acclimatized in the behavioral room for at least 30 min and were given a 5-min habituation trial with no objects on the field. This was followed by a STM test phase on the same day, consisting of one acquisition trial and one test trial. The next day, we conducted a LTM test consisting of only a test trial. In the acquisition trial, the mice were allowed to explore two identical objects placed diagonally on opposite sides of the field for 5 min. An hour after the acquisition trial, a STM test was performed, and 24 h later, a LTM test was performed. Both test trials were performed by replacing one of the identical objects of the acquisition trial with a novel object. The results were quantified using a discrimination index, which represents the ratio of the duration of exploration for the novel object to the duration of exploration of the old object.
Collection of tissues for molecular and histological analysis
Mice were euthanized in the fed state at 24 months of age, where they were fasted overnight starting the day before euthanasia; in the morning, mice were re-fed for 3 h and then euthanized. Following blood collection via submandibular bleeding, mice were euthanized by cervical dislocation, and tissues were rapidly collected, weighed and snap-frozen in liquid nitrogen. A portion of the liver was directly embedded into Tissue-Tek optimal cutting temperature (OCT) compound. It was sent to the University of Wisconsin–Madison Carbone Cancer Center (UWCCC) Experimental Animal Pathology Laboratory for cryosectioning and staining for Oil Red O. Portions of liver, kidney and spleen were fixed in 10% formalin for 4 h, transferred to 30% sucrose for 24 h, and then embedded in OCT, cryosectioned and stained for SA-β-Gal activity. The iWAT and BAT were fixed in 10% formalin for 24 h, switched to 70% ethanol and then paraffin-embedded before being cryosectioned and stained for hematoxylin and eosin (H&E). Images of the liver, kidney, iWAT and BAT were taken using an EVOS microscope (Thermo Fisher Scientific) at a magnification of 40× (refs. 90,91). Quantification fields were obtained for each tissue from each mouse and quantified using ImageJ (National Institutes of Health (NIH)).
For histological analysis, brains were fixed in 10% formalin for 24 h and transferred to 30% sucrose. Brains were postfixed, dehydrated and then sectioned coronally (30 μm) using a sliding microtome, followed by immunofluorescent analysis92. For immunohistochemistry, brain sections were washed with PBS six times and blocked with 0.3% Triton X-100 and 3% normal donkey serum in PBS for 2 h before staining was carried out overnight using rabbit anti-GFAP (1:1,000; Millipore, ab5804 primary antibody. For goat anti-Iba1 (1:1,000 Abcam, ab5076), immunostaining brain sections were pretreated with 0.5% NaOH and 0.5% H2O2 in PBS for 20 min. Then, the primary antibody brain sections were incubated with AlexaFluor-conjugated secondary antibodies for 2 h (Invitrogen). Microscopic images of the stained sections were obtained using an Olympus FluoView 500 and Zeiss LSM 800 laser scanning confocal microscope.
Astrocyte and microglia morphology analysis
Immunofluorescence images were taken using a multiphoton laser-scanning microscope (LSM 800, ZEISS) equipped with a 63× objective for the hippocampus. Stacked images along the optical axis (z axis), were reconstructed to three dimensions using Fiji-ImageJ. These were analyzed for cellular morphology, skeleton and fractal analyses using an established protocol44,45. Skeletal and fractal analysis parameters were exported into separate Excel files and used for data analysis. All images used for analysis were taken with the same confocal settings (pinhole, digital gain and digital offset). Image processing, three-dimensional reconstruction and data analysis were performed in a blinded manner with respect to the experimental conditions.
μCT
Right femurs from all animals were collected for μCT. Bones were fixed in 10% formalin, placed in 70% ethanol and stored at 4 °C. All bones were scanned using the same instrument under the same conditions, following the American Society for Bone and Mineral Research guidelines93. Using a high-resolution SkyScan μCT system (SkyScan 1172) with 10-MP digital detector, 10 W of energy (60 kV and 167 mA), and a pixel size of 9.7 microns, exposure of 925 ms per frame rotation step of 0.3° with ×10 frame averaging and 0.5-mm aluminum filter (to increase the transmission), samples were scanned in the air with scan rotation of 180°. Before morphometric analysis, global thresholding was applied. Image reconstruction was performed using NRecon software (version 1.7.3.0; Bruker microCT). Data analysis was carried out using CTAn software (version 1.17.7.2+; Bruker microCT). Three-dimensional images were constructed using CT Vox software (version 3.3.0 r1403; Bruker microCT).
Immunoblotting
Tissue samples from liver and muscle were lysed in cold RIPA buffer supplemented with phosphatase and protease inhibitor cocktail tablets (Thermo Fisher Scientific) using a FastPrep 24 (M.P. Biomedicals) with screw-cap microcentrifuge tubes (822-S) from Dot Scientific and ceramic oxide bulk beads (10158-552) from VWR15,94. Protein lysates were then centrifuged at 16,300g for 10 min, and the supernatant was collected. Protein concentration was determined by Bradford (Pierce Biotechnology). In addition, 10–20 μg protein was separated by sodium dodecyl sulfate–polyacrylamide gel electrophoresis on 10% and 16% resolving gels (Thermo Fisher Scientific) and transferred to a PVDF membrane (EMD Millipore). pT389-S6K1 (108D2) (9234), S6K1 (9202), pS240/244-S6 (2215), S6 (5G10) (2217), pThr37/46 4E-BP1 (236B4) (2855), 4E-BP1 (53H11) (9644), eIF2α (D7D3) (5324), pS51-eIF2α (119A11) (3597), AMPKα (D5A2) (5831), pAMPKα (D79.5E) (4188), Beclin-1 (D40C5) (3495), LC3A/B (D3U4C) (12741), AKT (pan) (C67E7) (4691), pAKT S473 (D9E) (4060 L), p44/42 MAPK (Erk1/2) (9102), p-p44/42 MAPK (Erk1/2) (Thr202/Tyr204) (9101), p-FoxO1 (Thr24)/FoxO3a (Thr32) (9464), VDAC (4866), GAPDH (14C10) (2118), and β-tubulin (2146) were purchased from Cell Signaling Technologies and used at a dilution of 1:1,000. p62 (American Research Products, 03-GP62-C) was also used at a dilution of 1:1,000. Total OXPHOS Rodent Antibody Cocktail (Abcam, ab110413) was also used at a dilution of 1:1,000. Imaging was performed using a Bio-Rad Chemidoc MP imaging station (Bio-Rad). Quantification was performed by densitometry using NIH ImageJ software.
Real-time quantitative PCR
Real-time quantitative PCR was carried out as previously described90 using TRI Reagent according to the manufacturer’s protocol. The concentration and purity of RNA were determined by absorbance at 260/280 nm using Nanodrop (Thermo Fisher Scientific). A total of 1 μg of RNA was used to generate cDNA (Superscript III; Invitrogen). Oligo dT primers and primers for real-time PCR were obtained from Integrated DNA Technologies. Reactions were run on a StepOne Plus machine (Applied Biosystems) with Sybr Green PCR Master Mix (Invitrogen). Actin was used to normalize gene-specific reaction results. The primers can be found in Supplementary Table 13.
SA-β-Gal staining
SA-β-Gal activity appears to be restricted to senescent cells at a low pH95,96. Fresh tissue from mice was collected and fixed in 10% neutral buffered formalin on ice for 3–4 h. The tissues were then transferred to 30% sucrose at 4 °C for 24 h before being embedded in OCT compound in a cryomold and stored at −80 °C. Before cryosectioning, the tissues were equilibrated at −20 °C and then cryosectioned into 5–7-µm sections before being attached to Superfrost Plus slides. Fresh SA-β-Gal staining solution at a pH of 6 was prepared97. The tissue slides were stained with SA-β-Gal staining solution for 18–24 h at 37 °C in a non-CO2 incubator and then rinsed with PBS three times. A parafilm Coplin jar was used to prevent evaporative loss of staining solution. Stained sections were imaged using the EVOS microscope (Thermo Fisher Scientific) at a magnification of 40×. The percentage of SA-β-Gal-positive areas for each sample was quantified using ImageJ.
ELISA assays and kits
Blood plasma for FGF21 and insulin was obtained at 19 months of age in the fasted state. Blood FGF21 levels were assayed by a mouse/rat FGF-21 quantikine enzyme-linked immunosorbent assay (ELISA) kit (MF2100) from R&D Systems. Plasma insulin was quantified using an ultrasensitive mouse insulin ELISA kit (90080) from Crystal Chem. Triglycerides were measured by Triglyceride Colorimetric Assay Kit (Cayman Chemical Company, item no. 10010303) using plasma and tissue collected at euthanasia
Transcriptomics
RNA was extracted from the liver, BAT and muscle using the PureLink RNA mini kit (Invitrogen, 12183025) with DNase (Invitrogen, 12185010) following the manufacturer’s instructions. The concentration and purity of RNA was determined using a NanoDrop 2000c spectrophotometer (Thermo Fisher Scientific), and RNA was diluted to 100–400 ng ml−1 for sequencing. Total RNA was submitted to the UW–Madison Biotechnology Center Gene Expression Center (RRID: SCR_017757) and DNA Sequencing Facility (RRID: SCR_017759) for RNA quality assessment on an Agilent Biomek Plate Reader (A260/A280) and Agilent 4200Tapestation (RIN). RNA libraries were prepared using the NEBNext Ultra II Directional RNA Library Prep Kit (Illumina, New England Biolabs GmbH) with a 500-ng total RNA input. Paired-end 150-base pair (bp) sequencing was carried out on an Illumina NovaSeq X Plus sequencer. Adapter-trimmed strand-specific 2× 150-bp Illumina reads were processed with Skewer version 0.1.123 (Jiang et al., 2014) to remove sequencing adapters and low-quality bases98. Reads were aligned to the Mus musculus GRCm39 reference genome (NCBI assembly accession no. GCA_000001635.9) using STAR version 2.7.11b (Dobin et al., 2013) with splice-aware alignment and transcript annotations from Ensembl release 110 (ref. 99). STAR was run with the options –twopassMode Basic to improve splice junction discovery and –outSAMtype BAM SortedByCoordinate to produce coordinate-sorted BAM files suitable for downstream analysis. Expression quantification at the gene and transcript levels was performed with RSEM version 1.3.1 (ref. 100) using the STAR-aligned BAM files as input. The RSEM reference was prepared using the corresponding Ensembl transcript annotations100.
Analysis of significantly DEGs was completed in R version 4.4.3 using edgeR and limma packages. Gene names were converted to gene symbol and Entrez ID formats using the mygenepackage. PCA plots were generated using the mixomics package. DEGs were used to identify enriched pathways, with both Gene Ontology- (for biological processes) and KEGG-enriched pathways using an adjusted P value cut-off of 0.05 (Supplementary Tables 2–5). All genes, log2 fold changes and corresponding unadjusted and Benjamini–Hochberg adjusted P values can be found in Supplementary Tables 2–5.
WGCNA analysis was conducted in R (version 4.4.3) using the WGCNA package. We analyzed male and female mice separately. First, we filtered by gene expression variance, keeping the top 50% variable genes for each tissue to remove ‘noisy’ genes. We combined genes from all three tissues, which were demarcated to indicate their tissue origin. We then checked that all genes had enough samples and that there were no clear outliers before running the analysis. We started with 25,197 genes for female mice and 22,928 for male mice. WGCNA analysis identifies significant gene modules and their correlations with phenotypes. Once gene modules were identified, they were enriched for KEGG pathways. We then separated out genes by their original tissue type and re-ran the KEGG enrichment analysis to identify tissue-specific pathways that were related to phenotypes of interest.
Cytoscape network
For the the intertissue network analysis, we first matched the mice used for transcriptomics in BAT, liver and muscle, yielding 28 total mice (6 and 6 for male mice on CTL and Val-R diets, and 7 and 9 female mice on CLT and Val-R diets, respectively). Co-expression gene modules were computed in R using the WGCNA package101 following rankz-transformation of gene expression data102. Among all sequenced transcripts, an average of ~94% were included in 18, 24 and 22 modules for BAT, liver and muscle, respectively. Gene expression and WGCNA module gene membership is available at https://connect.doit.wisc.edu/dlamming_valine_study/.
ME–ME correlations were used to construct a correlation network in Cytoscape (version 3.10.4) where the nodes are co-expression gene modules denoted by their ME.colorname. The color of each module reflects the tissue of origin, as indicated in the legend. Edges connecting nodes represent the correlation between the ME for the modules identified in BAT, liver and muscle. Edge color indicates direction of correlation (red, positive; blue, negative), thickness is controlled by the strength of correlation (|correlation | , range, 0.37–1.0) and transparency is set by the −log10P value (range, 1–9). The relative position of the nodes and curved edges were determined by the yFiles Radial Layout option in Cytoscape.
Mitochondrial respiratory analysis
Liver mitochondrial OCRs for respiratory complexes I, II and IV were measured in frozen liver samples using a Seahorse XFe96 Analyzer103,104. In brief, 50 mg of liver tissue was thawed in 3 ml of ice-cold 1× mitochondrial assay solution (MAS; 70 mM sucrose, 220 mM mannitol, 5 mM KH2PO4, 5 mM MgCl2, 1 mM EGTA and 2 mM HEPES, pH 7.4), finely minced with scissors and homogenized on ice using 15 strokes of a tight-fitting Dounce homogenizer. Homogenates were centrifuged at 1,000g for 10 min at 4 °C to remove debris, and the supernatant was subsequently centrifuged at 10,000g to isolate crude mitochondria. The mitochondrial pellet was washed twice in 1× MAS buffer and resuspended in 100 μl ice-cold MAS buffer with vortexing. A total of 3 μg of mitochondrial protein was loaded per well in triplicate.
Complex I-driven respiration was assessed using NADH (1 mM), and complex II-driven respiration was measured using succinate (5 mM) in the presence of rotenone (2 μM). Rotenone (2 μM) and antimycin A (4 μM) were subsequently injected to inhibit complexes I and III, respectively. Complex IV activity was stimulated with ascorbate (1 mM), and non-mitochondrial respiration was determined following the addition of sodium azide (40 mM)
To assess intrinsic mitochondrial capacity, OCR values were normalized to CS activity105. CS activity was measured as previously described106 and adapted to a 96-well format107. In duplicate, 10 μl of mitochondrial protein was added to 186 μl of assay buffer (50 mM potassium phosphate, pH 7.4, 100 μM DTNB and 115 μM acetyl-CoA), and baseline absorbance was recorded at 15-s intervals for 3 min. The reaction was initiated by addition of 4 μl of 5 mM oxaloacetate (final concentration of 100 μM), and absorbance was monitored for an additional 3 min. Enzyme activity (nmol min−1 mg−1) was calculated from absorbance values, corrected for pathlength, with a within-plate coefficient of variation of 3.6% across technical replicates.
Statistics and reproducibility
Data are presented as the mean ± s.e.m. unless otherwise specified. Statistical analyses were performed using one-way or two-way analysis of variance (ANOVA) followed by Tukey–Kramer post hoc test, as specified in the figure legends. Outliers were excluded using the robust regression outlier test in Graphpad Prism (version 10) (Q = 1%) and are indicated by an asterisk (*) and blue-colored font in the Source Data. Lifespan comparisons were calculated by a log-rank test. Maximum lifespan calculations were made by generating a cut-off of the top 25% longest-lived animals in each sex, coupled with Boschloo’s test (Wang–Allison) for significance testing between groups. FAMY and GRAIL were calculated as described53. Other statistical details are available in the figure legends. Energy expenditure differences were detected using ANCOVA. ANCOVA analysis assumes a linear relationship between the variables and their covariates; if the slope is equal between groups, then the regression lines are parallel, and elevation is then tested to determine any differences (that is, if slopes are statistically significantly different, elevation will not be determined). In all figures, n represents the number of biologically independent animals. Sample sizes were chosen on the basis of our previously published experimental results with the effects of dietary interventions. Data distribution was assumed to be normal, but this was not formally tested.
All studies were performed on animals or on tissues collected from animals. Young animals of each sex were assigned to groups of equivalent weight, and three animals were housed per cage, before the beginning of the in vivo studies. No formal method of randomization was used to assign young mice to groups
Investigators were blinded to diet groups during data collection whenever feasible, but this was not always possible or feasible as cages were clearly marked to indicate the diet provided, diets were color-coded to prevent feeding mistakes, and the size and body composition of the mice were altered by the diet. Researchers were blinded to group allocations during image analysis. During analysis of other datasets, the investigators were not blinded as the results are objective quantifications. Investigators were not blinded during necropsies.
Reporting summary
Further information on research design is available in the Nature Portfolio Reporting Summary linked to this article
Data availability
RNA sequencing data have been deposited with the Gene Expression Omnibus and are accessible through accession no. GSE298741
References
Moon, J. & Koh, G. Clinical evidence and mechanisms of high-protein diet-induced weight loss. J. Obes. Metab. Syndr.29, 166–173 (2020)
Paddon-Jones, D. et al. Protein, weight management, and satiety. Am. J. Clin. Nutr.87, 1558S–1561S (2008)
Coelho-Junior, H. J., Rodrigues, B., Uchida, M. & Marzetti, E. Low protein intake is associated with frailty in older adults: a systematic review and meta-analysis of observational studies. Nutrients10, 1334 (2018)
Levine, M. E. et al. Low protein intake is associated with a major reduction in IGF-1, cancer, and overall mortality in the 65 and younger but not older population. Cell Metab.19, 407–417 (2014)
Sluijs, I. et al. Dietary intake of total, animal, and vegetable protein and risk of type 2 diabetes in the European Prospective Investigation into Cancer and Nutrition (EPIC)-NL study. Diabetes Care33, 43–48 (2010)
van Nielen, M. et al. Dietary protein intake and incidence of type 2 diabetes in Europe: the EPIC-InterAct case-cohort study. Diabetes Care37, 1854–1862 (2014)
Lagiou, P. et al. Low carbohydrate-high protein diet and mortality in a cohort of Swedish women. J. Intern. Med.261, 366–374 (2007)
Ni Lochlainn, M., Bowyer, R. C. E., Welch, A. A., Whelan, K. & Steves, C. J. Higher dietary protein intake is associated with sarcopenia in older British twins. Age Ageing52, afad018 (2023)
Ferraz-Bannitz, R. et al. Dietary protein restriction improves metabolic dysfunction in patients with metabolic syndrome in a randomized, controlled trial. Nutrients14, 2670 (2022)
Fontana, L. et al. Decreased consumption of branched-chain amino acids improves metabolic health. Cell Rep.16, 520–530 (2016)
Nicolaisen, T. S. et al. Dietary protein restriction elevates FGF21 levels and energy requirements to maintain body weight in lean men. Nat. Metab.7, 602–616 (2025)
Babygirija, R. et al. Protein restriction slows the development and progression of pathology in a mouse model of Alzheimer’s disease. Nat. Commun.15, 5217 (2024)
Green, C. L. et al. Sex and genetic background define the metabolic, physiologic, and molecular response to protein restriction. Cell Metab.34, 209–226 (2022)
Hill, C. M. et al. FGF21 is required for protein restriction to extend lifespan and improve metabolic health in male mice. Nat. Commun.13, 1897 (2022)
Richardson, N. E. et al. Lifelong restriction of dietary branched-chain amino acids has sex-specific benefits for frailty and lifespan in mice. Nat. Aging1, 73–86 (2021)
Mair, W., Piper, M. D. & Partridge, L. Calories do not explain extension of life span by dietary restriction in Drosophila. PLoS Biol.3, e223 (2005)
Fulton, T. L., Wansbrough, M. R., Mirth, C. K. & Piper, M. D. W. Short-term fasting of a single amino acid extends lifespan. Geroscience46, 3607–3615 (2024)
Weaver, K. J., Holt, R. A., Henry, E., Lyu, Y. & Pletcher, S. D. Effects of hunger on neuronal histone modifications slow aging in Drosophila. Science380, 625–632 (2023)
Green, C. L. et al. Dietary restriction of isoleucine increases healthspan and lifespan of genetically heterogeneous mice. Cell Metab.35, 1976–1995 (2023)
Yeh, C. Y. et al. Late-life protein or isoleucine restriction impacts physiological and molecular signatures of aging. Nat. Aging4, 1760–1771 (2024)
Yu, D. et al. The adverse metabolic effects of branched-chain amino acids are mediated by isoleucine and valine. Cell Metab.33, 905–922 (2021)
Mannick, J. B. & Lamming, D. W. Targeting the biology of aging with mTOR inhibitors. Nat. Aging3, 642–660 (2023)
Simcox, J. & Lamming, D. W. The central moTOR of metabolism. Dev. Cell57, 691–706 (2022)
Strong, R. et al. Lifespan benefits for the combination of rapamycin plus acarbose and for captopril in genetically heterogeneous mice. Aging Cell21, e13724 (2022)
Calubag, M. F. et al. Tissue-specific effects of dietary protein on cellular senescence are mediated by branched-chain amino acids. Aging Cell24, e70176 (2025)
Bidgood, C. L. et al. Targeting valine catabolism to inhibit metabolic reprogramming in prostate cancer. Cell Death Dis.15, 513 (2024)
Bishop, C. A. et al. Detrimental effects of branched-chain amino acids in glucose tolerance can be attributed to valine induced glucotoxicity in skeletal muscle. Nutr. Diabetes12, 20 (2022)
Jang, C. et al. A branched-chain amino acid metabolite drives vascular fatty acid transport and causes insulin resistance. Nat. Med.22, 421–426 (2016)
Zheng, H. Y. et al. Valine induces inflammation and enhanced adipogenesis in lean mice by multi-omics analysis. Front. Nutr.11, 1379390 (2024)
Laeger, T. et al. FGF21 is an endocrine signal of protein restriction. J. Clin. Invest.124, 3913–3922 (2014)
Hill, C. M. et al. FGF21 signals protein status to the brain and adaptively regulates food choice and metabolism. Cell Rep.27, 2934–2947 (2019)
Fisher, F. M. et al. FGF21 regulates PGC-1α and browning of white adipose tissues in adaptive thermogenesis. Genes Dev.26, 271–281 (2012)
Hill, C. M. et al. Low protein-induced increases in FGF21 drive UCP1-dependent metabolic but not thermoregulatory endpoints. Sci. Rep.7, 8209 (2017)
Miyake, M. et al. Skeletal muscle-specific eukaryotic translation initiation factor 2α phosphorylation controls amino acid metabolism and fibroblast growth factor 21-mediated non-cell-autonomous energy metabolism. FASEB J.30, 798–812 (2016)
Schaap, F. G., Kremer, A. E., Lamers, W. H., Jansen, P. L. M. & Gaemers, I. C. Fibroblast growth factor 21 is induced by endoplasmic reticulum stress. Biochimie95, 692–699 (2013)
Zarei, M. et al. Heme-regulated eIF2α kinase modulates hepatic FGF21 and is activated by PPARβ/Δ deficiency. Diabetes65, 3185–3199 (2016)
Alves-Bezerra, M. & Cohen, D. E. Triglyceride metabolism in the liver. Compr. Physiol.8, 1–8 (2017)
Lamming, D. W. et al. Restriction of dietary protein decreases mTORC1 in tumors and somatic tissues of a tumor-bearing mouse xenograft model. Oncotarget6, 31233–31240 (2015)
Tournissac, M. et al. Dietary intake of branched-chain amino acids in a mouse model of Alzheimer’s disease: effects on survival, behavior, and neuropathology. Alzheimers Dement.4, 677–687 (2018)
Babygirija, R. et al. Restriction of individual branched-chain amino acids has distinct effects on the development and progression of Alzheimer’s disease in 3xTg mice. Adv. Sci.13, e15220 (2026)
Ritzel, R. M. et al. Old age increases microglial senescence, exacerbates secondary neuroinflammation, and worsens neurological outcomes after acute traumatic brain injury in mice. Neurobiol. Aging77, 194–206 (2019)
Sparkman, N. L. & Johnson, R. W. Neuroinflammation associated with aging sensitizes the brain to the effects of infection or stress. Neuroimmunomodulation15, 323–330 (2008)
Ownby, R. L. Neuroinflammation and cognitive aging. Curr. Psychiatry Rep.12, 39–45 (2010)
Marques, S. I., Carmo, H., Carvalho, F., Sa, S. I. & Silva, J. P. A semi-automatic method for the quantification of astrocyte number and branching in bulk immunohistochemistry images. Int. J. Mol. Sci.24, 4508 (2023)
Young, K. & Morrison, H. Quantifying microglia morphology from photomicrographs of immunohistochemistry prepared tissue using imageJ. J. Vis. Exp.136, e57648 (2018)
Di Benedetto, G. et al. Role of microglia and astrocytes in Alzheimer’s disease: from neuroinflammation to Ca2+ homeostasis dysregulation. Cells11, 2728 (2022)
Park, J. S. et al. Blocking microglial activation of reactive astrocytes is neuroprotective in models of Alzheimer’s disease. Acta Neuropathol. Commun.9, 78 (2021)
Wu, Y. & Eisel, U. L. M. Microglia–astrocyte communication in Alzheimer’s disease. J. Alzheimers Dis.95, 785–803 (2023)
Whitehead, J. C. et al. A clinical frailty index in aging mice: comparisons with frailty index data in humans. J. Gerontol. A69, 621–632 (2014)
Liu, T. T. et al. Prostate enlargement and altered urinary function are part of the aging process. Aging11, 2653–2669 (2019)
Brayton, C. F., Treuting, P. M. & Ward, J. M. Pathobiology of aging mice and GEM: background strains and experimental design. Vet. Pathol.49, 85–105 (2012)
Blackwell, B. N., Bucci, T. J., Hart, R. W. & Turturro, A. Longevity, body weight, and neoplasia in ad libitum-fed and diet-restricted C57BL6 mice fed NIH-31 open formula diet. Toxicol. Pathol.23, 570–582 (1995)
Lamming, D. W. Quantification of healthspan in aging mice: introducing FAMY and GRAIL. Geroscience46, 4203–4215 (2024)
Calubag, M. F., Robbins, P. D. & Lamming, D. W. A nutrigeroscience approach: dietary macronutrients and cellular senescence. Cell Metab.36, 1914–1944 (2024)
Qu, Y. et al. Single-cell and spatial detection of senescent cells using DeepScence. Cell Genom.5, 101035 (2025)
Cherry, C. et al. Transfer learning in a biomaterial fibrosis model identifies in vivo senescence heterogeneity and contributions to vascularization and matrix production across species and diverse pathologies. Geroscience45, 2559–2587 (2023)
Saul, D. et al. A new gene set identifies senescent cells and predicts senescence-associated pathways across tissues. Nat. Commun.13, 4827 (2022)
Newgard, C. B. et al. A branched-chain amino acid-related metabolic signature that differentiates obese and lean humans and contributes to insulin resistance. Cell Metab.9, 311–326 (2009)
Deelen, J. et al. A metabolic profile of all-cause mortality risk identified in an observational study of 44,168 individuals. Nat. Commun.10, 3346 (2019)
Hochmuth, L. et al. Sex-dependent dynamics of metabolism in primary mouse hepatocytes. Arch. Toxicol.95, 3001–3013 (2021)
Costanzo, M. et al. Sex differences in the human metabolome. Biol. Sex Differ.13, 30 (2022)
Mora, S., Mann, G. & Adegoke, O. A. J. Sex differences in cachexia and branched-chain amino acid metabolism following chemotherapy in mice. Physiol. Rep.12, e16003 (2024)
Bjune, M. S. et al. Metabolic role of the hepatic valine/3-hydroxyisobutyrate (3-HIB) pathway in fatty liver disease. eBioMedicine91, 104569 (2023)
Jian, H. et al. Dietary valine ameliorated gut health and accelerated the development of nonalcoholic fatty liver disease of laying hens. Oxid. Med. Cell. Longev.2021, 4704771 (2021)
Shi, X. et al. Circulating branch chain amino acids and improvement in liver fat content in response to exercise interventions in NAFLD. Sci. Rep.11, 13415 (2021)
Kane, A. E., Gregson, E., Theou, O., Rockwood, K. & Howlett, S. E. The association between frailty, the metabolic syndrome, and mortality over the lifespan. Geroscience39, 221–229 (2017)
Rockwood, K. et al. A frailty index based on deficit accumulation quantifies mortality risk in humans and in mice. Sci. Rep.7, 43068 (2017)
Abdellatif, M. et al. Cardiac PI3K p110α attenuation delays aging and extends lifespan. Cell Stress6, 72–75 (2022)
Hedges, C. P. et al. Dietary supplementation of clinically utilized PI3K p110α inhibitor extends the lifespan of male and female mice. Nat. Aging3, 162–172 (2023)
Liu, Y. et al. The regulatory role of PI3K in ageing-related diseases. Ageing Res. Rev.88, 101963 (2023)
Lopez-Guadamillas, E. et al. PI3Kα inhibition reduces obesity in mice. Aging8, 2747–2753 (2016)
Okuyama, T. et al. The ERK–MAPK pathway regulates longevity through SKN-1 and insulin-like signaling in Caenorhabditis elegans. J. Biol. Chem.285, 30274–30281 (2010)
Troemel, E. R. et al. p38 MAPK regulates expression of immune response genes and contributes to longevity in C. elegans. PLoS Genet.2, e183 (2006)
Yuan, W. et al. Modulating p38 MAPK signaling by proteostasis mechanisms supports tissue integrity during growth and aging. Nat. Commun.14, 4543 (2023)
Kennedy, B. K. & Lamming, D. W. The mechanistic target of rapamycin: the grand conducTOR of metabolism and aging. Cell Metab.23, 990–1003 (2016)
Dorman, J. B., Albinder, B., Shroyer, T. & Kenyon, C. The age-1 and daf-2 genes function in a common pathway to control the lifespan of Caenorhabditis elegans. Genetics141, 1399–1406 (1995)
Kenyon, C., Chang, J., Gensch, E., Rudner, A. & Tabtiang, R. A C. elegans mutant that lives twice as long as wild type. Nature366, 461–464 (1993)
Nojima, A. et al. Haploinsufficiency of akt1 prolongs the lifespan of mice. PLoS ONE8, e69178 (2013)
Mao, Z. et al. Anti-aging effects of chlorpropamide depend on mitochondrial complex-II and the production of mitochondrial reactive oxygen species. Acta Pharm. Sin. B12, 665–677 (2022)
Villa-Cuesta, E., Holmbeck, M. A. & Rand, D. M. Rapamycin increases mitochondrial efficiency by mtDNA-dependent reprogramming of mitochondrial metabolism in Drosophila. J. Cell Sci.127, 2282–2290 (2014)
Munkacsy, E. & Rea, S. L. The paradox of mitochondrial dysfunction and extended longevity. Exp. Gerontol.56, 221–233 (2014)
Schulz, T. J. et al. Glucose restriction extends Caenorhabditis elegans life span by inducing mitochondrial respiration and increasing oxidative stress. Cell Metab.6, 280–293 (2007)
Solon-Biet, S. M. et al. The ratio of macronutrients, not caloric intake, dictates cardiometabolic health, aging, and longevity in ad libitum-fed mice. Cell Metab.19, 418–430 (2014)
Mitchell, S. J. et al. Effects of sex, strain, and energy intake on hallmarks of aging in mice. Cell Metab.23, 1093–1112 (2016)
Miller, R. A. et al. Rapamycin-mediated lifespan increase in mice is dose and sex dependent and metabolically distinct from dietary restriction. Aging Cell13, 468–477 (2014)
Liang, H. et al. Genetic mouse models of extended lifespan. Exp. Gerontol.38, 1353–1364 (2003)
Liao, C. Y., Rikke, B. A., Johnson, T. E., Diaz, V. & Nelson, J. F. Genetic variation in the murine lifespan response to dietary restriction: from life extension to life shortening. Aging Cell9, 92–95 (2010)
Bellantuono, I. et al. A toolbox for the longitudinal assessment of healthspan in aging mice. Nat. Protoc.15, 540–574 (2020)
Keil, K. P. et al. Influence of animal husbandry practices on void spot assay outcomes in C57BL/6J male mice. Neurourol. Urodyn.35, 192–198 (2016)
Calubag, M. F. et al. FGF21 has a sex-specific role in calorie-restriction-induced beiging of white adipose tissue in mice. Aging Biol.1, e20230002 (2023)
Cummings, N. E. et al. Restoration of metabolic health by decreased consumption of branched-chain amino acids. J. Physiol.596, 623–645 (2018)
Jayarathne, H. S. M. et al. Neuroprotective effects of canagliflozin: lessons from aged genetically diverse UM-HET3 mice. Aging Cell21, e13653 (2022)
Bouxsein, M. L. et al. Guidelines for assessment of bone microstructure in rodents using micro-computed tomography. J. Bone Miner. Res.25, 1468–1486 (2010)
Pak, H. H. et al. Fasting drives the metabolic, molecular and geroprotective effects of a calorie-restricted diet in mice. Nat. Metab.3, 1327–1341 (2021)
Dimri, G. P. et al. A biomarker that identifies senescent human cells in culture and in aging skin in vivo. Proc. Natl Acad. Sci. USA92, 9363–9367 (1995)
Zhao, J. et al. Quantitative analysis of cellular senescence in culture and in vivo. Curr. Protoc. Cytom.79, 9 51 51–59 51 25 (2017)
Calubag, M. F. et al. Tissue-specific effects of dietary protein on cellular senescence are mediated by branched-chain amino acids. Aging Cell.24, e70176 (2025)
Jiang, H., Lei, R., Ding, S.-W. & Zhu, S. Skewer: a fast and accurate adapter trimmer for next-generation sequencing paired-end reads. BMCBioinformatics15, 182 (2014)
Dobin, A. et al. STAR: ultrafast universal RNA-seq aligner. Bioinformatics29, 15–21 (2013)
Li, B. & Dewey, C. N. RSEM: accurate transcript quantification from RNA-Seq data with or without a reference genome. BMCBioinformatics12, 323 (2011)
Langfelder, P. & Horvath, S. WGCNA: an R package for weighted correlation network analysis. BMC Bioinformatics9, 559 (2008)
Roy, G. et al. VDAC1 is a target for pharmacologically induced insulin hypersecretion in beta cells. Cell Rep.44, 115834 (2025)
Acin-Perez, R. et al. A novel approach to measure mitochondrial respiration in frozen biological samples. EMBO J.39, e104073 (2020)
Osto, C. et al. Measuring mitochondrial respiration in previously frozen biological samples. Curr. Protoc. Cell Biol.89, e116 (2020)
McLaughlin, K. L. et al. Novel approach to quantify mitochondrial content and intrinsic bioenergetic efficiency across organs. Sci. Rep.10, 17599 (2020)
Spinazzi, M., Casarin, A., Pertegato, V., Saly chain enzymatic activities on tissues and cultured cells. Nat. Protoc.7, 1235–1246 (2012)
Janssen, R. C. & Boyle, K. E. Microplate assays for spectrophotometric measurement of mitochondrial enzyme activity. Methods Mol. Biol.1978, 355–368 (2019)
Acknowledgments
We thank all members of the Lamming Laboratory for their assistance, and R. Anderson, D. Harris, A. Konopka, D. Moore and M. Yousefzadeh for their thoughtful questions, critiques and suggestions. We thank D. Davis for allowing us to use her EVOS FL inverted fluorescent microscope for imaging
Funding
The Lamming Laboratory is supported in part by the National Institutes on Aging (NIA; grant nos. AG056771, AG081482, AG084156, AG085898 and AG094153), the Wisconsin Partnership Program, and startup and other funds from UW–Madison. D.W.L. and W.A.R. are members of the Wisconsin Nathan Shock Center of Excellence in the Basic Biology of Aging, and this work was supported by facilities and resources within the Wisconsin Nathan Shock Center of Excellence in the Basic Biology of Aging (grant no. P30 AG092586). The Lamming Laboratory was supported in part by the US Department of Veterans Affairs (grant no. IS1-BX005524), and this work was supported using facilities and resources from the William S. Middleton Memorial Veterans Hospital. M.F.C. was supported by F31AG082504. C.L.G. was supported in part by Dalio Philanthropies, a Glenn Foundation Postdoctoral Fellowship, and by Hevolution Foundation award HF-AGE AGE-009. R.N.M. was supported by a Glenn Foundation Postdoctoral Fellowship and a Glenn Foundation Postdoctoral Fellowship Continuation Award. R.B. was supported by F31AG081115. C.-Y.Y. was supported in part by a NIA F32 postdoctoral fellowship (grant no. F32AG077916) and a NIA K99 award (grant no. K99AG084921). The Sadagurski Laboratory is supported in part by the National Institute of Environmental Health Sciences (grant no. R01ES033171) and NIA (grant no. RF1AG078170). T.T.L. was supported by K01 AG059899. The authors used the UW–Madison Biotechnology Center Gene Expression Center (RRID: SCR_017757), which is supported in part by the UWCCC (grant no. P30CA014520). The UWCCC Experimental Animal Pathology Laboratory is supported by P30 CA014520 from the NIH/National Cancer Institute. The content is solely the responsibility of the authors and does not necessarily represent the official views of the NIH. This work does not represent the views of the Department of Veterans Affairs or the US government.
Author information
Authors and Affiliations
Department of Medicine, University of Wisconsin–Madison, Madison, WI, USA
Mariah F. Calubag, Ismail Ademi, Cara L. Green, Ryan N. Marshall, Sandra M. Le, Penelope Lialios, Lucia E. Breuer, Reji Babygirija, Michelle M. Sonsalla, Isaac Grunow, Chung-Yang Yeh, Yang Liu, Bailey A. Knopf & Dudley W. Lamming
William S. Middleton Memorial Veterans Hospital, Madison, WI, USA
Mariah F. Calubag, Ismail Ademi, Cara L. Green, Ryan N. Marshall, Sandra M. Le, Penelope Lialios, Lucia E. Breuer, Reji Babygirija, Michelle M. Sonsalla, Isaac Grunow, Chung-Yang Yeh, Yang Liu, Bailey A. Knopf & Dudley W. Lamming
Graduate Program in Cellular and Molecular Biology, University of Wisconsin–Madison, Madison, WI, USA
Mariah F. Calubag, Reji Babygirija, Bailey A. Knopf & Dudley W. Lamming
Department for Health, University of Bath, Bath, UK
Cara L. Green
Department of Biological Sciences, Wayne State University, Detroit, MI, USA
Dulmalika N. H. Manchanayake, Hashan S. M. Jayarathne & Marianna Sadagurski
Institute of Environmental Health Sciences, Integrative Biosciences Center, Wayne State University, Detroit, MI, USA
Dulmalika N. H. Manchanayake, Hashan S. M. Jayarathne & Marianna Sadagurski
New York University College of Dentistry, New York, NY, USA
Shoshana Yakar
Comparative Biomedical Sciences Graduate Program, University of Wisconsin–Madison, Madison, WI, USA
Michelle M. Sonsalla & Dudley W. Lamming
Endocrinology and Reproductive Physiology Graduate Training Program, University of Wisconsin–Madison, Madison, WI, USA
Yang Liu & Dudley W. Lamming
Department of Biochemistry, University of Wisconsin–Madison, Madison, WI, USA
Sarah Yandell, Charles I. Opara, Mark P. Keller & Alan D. Attie
George M. O’Brien Center of Research Excellence, Department of Urology, University of Wisconsin, Madison, WI, USA
William A. Ricke & Teresa T. Liu
Wisconsin Nathan Shock Center of Excellence in the Basic Biology of Aging, Madison, WI, USA
William A. Ricke, Alan D. Attie & Dudley W. Lamming
Department of Pharmaceutical Sciences, St. John Fisher University, Rochester, NY, USA
Teresa T. Liu
University of Wisconsin–Madison Comprehensive Diabetes Center, Madison, WI, USA
Alan D. Attie & Dudley W. Lamming
University of Wisconsin Carbone Comprehensive Cancer Center, Madison, WI, USA
Dudley W. Lamming
Authors
- Mariah F. CalubagView author publications
Search author on:PubMed Google Scholar
- Ismail AdemiView author publications
Search author on:PubMed Google Scholar
- Cara L. GreenView author publications
Search author on:PubMed Google Scholar
- Dulmalika N. H. ManchanayakeView author publications
Search author on:PubMed Google Scholar
- Hashan S. M. JayarathneView author publications
Search author on:PubMed Google Scholar
- Ryan N. MarshallView author publications
Search author on:PubMed Google Scholar
- Sandra M. LeView author publications
Search author on:PubMed Google Scholar
- Penelope LialiosView author publications
Search author on:PubMed Google Scholar
- Lucia E. BreuerView author publications
Search author on:PubMed Google Scholar
- Shoshana YakarView author publications
Search author on:PubMed Google Scholar
- Reji BabygirijaView author publications
Search author on:PubMed Google Scholar
- Michelle M. SonsallaView author publications
Search author on:PubMed Google Scholar
- Isaac GrunowView author publications
Search author on:PubMed Google Scholar
- Chung-Yang YehView author publications
Search author on:PubMed Google Scholar
- Yang LiuView author publications
Search author on:PubMed Google Scholar
- Bailey A. KnopfView author publications
Search author on:PubMed Google Scholar
- Sarah YandellView author publications
Search author on:PubMed Google Scholar
- Charles I. OparaView author publications
Search author on:PubMed Google Scholar
- William A. RickeView author publications
Search author on:PubMed Google Scholar
- Teresa T. LiuView author publications
Search author on:PubMed Google Scholar
- Mark P. KellerView author publications
Search author on:PubMed Google Scholar
- Alan D. AttieView author publications
Search author on:PubMed Google Scholar
- Marianna SadagurskiView author publications
Search author on:PubMed Google Scholar
- Dudley W. LammingView author publications
Search author on:PubMed Google Scholar
Contributions
Experiments were performed in the Lamming Laboratory, except for the analysis of the brain immunochemistry, which was performed in the Sadagurski Laboratory and the μCT analysis on the femur bone, which was performed in the Yakar Laboratory. M.F.C., M.S., S. Yakar, W.A.R., A.D.A. and D.W.L. conceived the experiments and secured funding. M.F.C., I.A., P.L., S.M.L., L.E.B., R.N.M., H.S.M.J., D.N.H.M., S. Yandell, T.T.L., C.L.G., R.B., M.M.S., Y.L., I.G., C.Y.Y., Y.L. and B.A.K. performed the experiments. M.C., D.N.H.M., H.S.M.J., R.N.M., C.L.G., T.T.L., C.I.O., M.P.K., M.S. and D.W.L. analyzed the data. M.F.C., C.L.G., M.P.K., M.S. and D.W.L. wrote and edited the manuscript.
Ethics declarations
Competing interests
D.W.L. has received funding from, and is a scientific advisory board member of, AeoTOR inhibitors for the treatment of various diseases. The other authors declare no competing interests
Peer review
Peer review information
Nature Aging thanks Seung-Hoi Koo, Mark Mattson and the other, anonymous, reviewer(s) for their contribution to the peer review of this work. Peer reviewer reports are available
Additional information
Publisher’s note Springer Nature remains neutral with regard to jurisdictional claims in published maps and institutional affiliations
Extended data
Extended Data Fig. 1 FGF21-UCP1 axis in the iWAT of Val-R-fed mice
(A) Circulating FGF21 at 19 months of age (n = 9, 10, 10, 10 mice/group). (B) Hematoxylin and eosin (HE) staining (representative images; scale bar=100 µm, 40X magnification) from iWAT of male and female mice. (C) Quantified adipocyte size (µm2) from HE-stained iWAT images from male and female mice (n = 8, 6, 9, 9 mice/group). (D-E) The mRNA expression of thermogenic genes was quantified in the iWAT of male (D) and female (E) mice (n = 7, 7, 7, 8 mice/group; **p = 0.0071, ***p = 0.0009). (F-G) Western blots of UCP1 protein normalized to GAPDH in male and female iWAT (F) and their quantification with analysis via two-way ANOVA (G) (n = 6 mice/group, *p = 0.0128). (A, C-E, G) statistics for the overall effects of sex, diet, and the interaction represent the p value from a two-way ANOVA; p vales from a Sidak’s post-test examining the effect of parameters identified as significant in the two-way ANOVA. The n values denote biologically independent animals and are listed in the order of CTL Male Mice, Val-R Male Mice, CTL Female Mice, and Val-R Female Mice. Data represented as mean ± SEM.
Source data
Extended Data Fig. 2 Val-R protects from hepatic steatosis
(A) Oil-Red-O (ORO) staining (representative images; scale bar=100 µm, 40X magnification) from the liver of male and female mice. (B-D) Quantified lipid droplet size (µm2) (B), percent of area of lipid droplets (C) and lipid droplet count (D) calculated from ORO-stained liver images (n = 8, 7, 8, 8 mice/group; *p = 0.0470, **p = 0.0022). (E) Liver triglycerides normalized to protein at 24 months of age (n = 8, 7, 8, 8 mice/group; *p = 0.0164). (F) Circulating triglycerides at 24 months of age (n = 9, 7, 9, 10 mice/group; *p = 0.0342, **p = 0.0084, ****p < 0.0001). (B-F) statistics for the overall effects of sex, diet, and the interaction represent the p value from a two-way ANOVA; Sidak’s post-test examining the effect of parameters identified as significant in the two-way ANOVA. The n values denote biologically independent animals and are listed in the order of CTL Male Mice, Val-R Male Mice, CTL Female Mice, and Val-R Female Mice. Data represented as mean ± SEM.
Source data
Extended Data Fig. 3 Val-R induced hepatic mTORC1 signaling
(A-B) Altered genes in the ‘Ribosome’ (A) and ‘Ribosome biogenesis in eukaryotes’ (B) pathways in the liver, muscle and BAT. n = 9, 6, 9, 10 mice/group. *p < 0.05. (C) Western blots of the analyzed proteins in male livers. (D) Phosphorylation of S6K1 T389, S6 S240/S244 and 4E-BP1 T37/S46, normalized to the expression of the respective protein (n = 6 mice/group; ***p = 0.0004). (E) Phosphorylation of AMPKα normalized to the expression of AMPKα and protein expression of LC3AB, Beclin-1 and p62 normalized to expression of β-tubulin (n = 6 mice/group; **p = 0.0047). (F) Western blots of the analyzed proteins in female livers. (G) Phosphorylation of S6K1 T389, S6 S240/S244 and 4E-BP1 T37/S46 normalized to their total protein (n = 6 mice/group; ***p = 0.0006). (H) Phosphorylation of AMPKα normalized to the expression of AMPKα and protein expression of LC3AB, Beclin-1 and p62 normalized to expression of β-tubulin (n = 6 mice/group). (D-E, G-H) statistics for the overall effects of gene or sex, diet, and the interaction represent the p value from a two-way ANOVA analysis; p values from a Sidak’s post-test examining the effect of parameters identified as significant in the two-way ANOVA. The n values denote biologically independent animals and are listed in the order of CTL Male Mice, Val-R Male Mice, CTL Female Mice, and Val-R Female Mice. Data represented as mean ± SEM.
Source data
Extended Data Fig. 4 Val-R reduces activation of microglia in the hippocampus
(A) Representative images of immunofluorescent microglia with their stacked and reconstructed 3D images. Scale bar represents 10 µm. (B-F) Quantified total endpoints per cell (B), process length (C), bounding circle diameter (D), lacunarity (E) and fractional dimension (F). n = 4, 4, 3, 3 mice/group; statistics for the overall effects of sex, diet, and the interaction represent the p value from a two-way ANOVA analysis; *p = 0.0238, 0.0472, **p = 0.0010, 0.0036, ***p = 0.0004 ****p < 0.0001 from a Sidak’s post-test examining the effect of parameters identified as significant in the two-way ANOVA. The n values denote biologically independent animals and are listed in the order of CTL Male Mice, Val-R Male Mice, CTL Female Mice, and Val-R Female Mice. Data represented as mean ± SEM.
Source data
Extended Data Fig. 5 Val-R reduces senescence in multiple tissues
(A–C) Hepatic SA-β-Gal staining at 40X magnification (scale bar = 100 µm) (A) with quantification of SA-βGal-positive cells (B) (n = 8, 7, 7, 10 mice/group) and log2 fold-change from RNA sequencing analysis of pre-selected senescence and SASP related genes (C). (D-F) Kidney SA-β-Gal staining at 40X magnification (scale bar = 100 µm) (D) with quantification of SA-βGal-positive cells (E) and log2 fold-change of mRNA expression of senescence and SASP genes of kidney (F). (G-H) Log2 fold-change of mRNA expression of senescence genes in the iWAT (G) and eWAT (H). (I-J) Log2 fold-change from RNA sequencing analysis of pre-selected senescence and SASP related genes in the BAT (I) and muscle(J). (C, I-J)) n = 9, 6, 9, 10 mice/group. (F-H) n = 8, 7, 8, 8 mice/group. (B, E) statistics for the overall effects of sex, diet, and the interaction represent the p value from a two-way ANOVA analysis; ***p = 0.001 from a Sidak’s post-test examining the effect of parameters identified as significant in the two-way ANOVA. (F-H) *p < 0.05, two-tailed student’s t-test. (C, I-J) *p < 0.05, moderated t-test. The n values denote biologically independent animals and are listed in the order of CTL Male Mice, Val-R Male Mice, CTL Female Mice, and Val-R Female Mice. Data represented as mean ± SEM.
Source data
Extended Data Fig. 6 WGCNA analysis of selected modules and pathways in female mice
(A) Pearson correlation coefficient between the gene modules and selected phenotypic traits, numbers in brackets indicate the corresponding p values in female mice (n = 9, 6, 9,10 mice/group; two-tailed t-test). (B) Selected KEGG pathway enrichment of the blue module. Gray dots indicate no alterations in that pathway for that tissue. Statistics by one-tailed t-test. (C) Altered genes in the PI3K-Akt signaling pathway in the liver, muscle and BAT. Genes shown were significantly altered (Benjamini-Hochberg (BH) adjusted p < 0.05) by Val-R in at least one tissue in male or female mice. (D) Western blots of the analyzed proteins in female livers. (E) Phosphorylation of AKT S473 normalized to the expression of AKT. (F) Phosphorylation of FoxO1 and FoxO3a normalized to HSP90. (E-F) n = 6 mice/group; two-tailed t-test. (F) Statistics for the overall effect of diet represent the p-value from a two-way ANOVA analysis. The n values denote biologically independent animals and are listed in the order of CTL Male Mice, Val-R Male Mice, CTL Female Mice, and Val-R Female Mice. Data represented as mean ± SEM.
Source data
Extended Data Fig. 7 Val-R does not change OXPHOS protein abundance in male liver mitochondria
(A) Western blots of the analyzed proteins in male liver mitochondria. (B) Total OXPHOS normalized to VDAC. (C) Expression of CI, CII, CIII/CIV and CV normalized to VDAC. (D) Western blots of the analyzed proteins in female liver mitochondria. (E) Total OXPHOS normalized to VDAC. (F) Expression of CI, CII, CIII/CIV and CV normalized to VDAC. (B, E) n = 6 mice/group; two-tailed student’s t-test. (C, F) n = 6 mice/group; statistics for the overall effects of complex, diet, and the interaction represent the p value from a two-way ANOVA analysis; *p < 0.05 from a Sidak’s post-test examining the effect of parameters identified as significant in the two-way ANOVA. Data represented as mean ± SEM.
Source data
Supplementary information
Supplementary Information (download PDF )
Supplementary Figs. 1–11 and associated figure legends, Table legends and
Reporting Summary (download PDF )
Peer Review File (download PDF )
Supplementary Tables (download XLSX )
Supplementary Tables 1–13
Supplementary Source Data (download XLSX )
Supplementary
Source data
Source Data Fig. 1 (download XLSX )
Statistical
Source Data Fig. 2 (download XLSX )
Statistical
Source Data Fig. 2 (download PDF )
BAT H&E staining images
Source Data Fig. 3 (download XLSX )
Statistical
Source Data Fig. 4 (download XLSX )
Statistical
Source Data Fig. 5 (download XLSX )
Statistical
Source Data Fig. 5 (download PDF )
Iba1 staining images of the brain
Source Data Fig. 6 (download XLSX )
Statistical
Source Data Fig. 7 (download XLSX )
Statistical
Source Data Fig. 7 (download PDF )
AKT and Foxo western blots in male liver (unprocessed)
Source Data Fig. 8 (download XLSX )
Statistical
Source Data Extended Data Fig. 1 (download XLSX )
Statistical
Source Data Extended Data Fig. 1 (download PDF )
iWAT H&E staining images and iWAT western blots (unprocessed)
Source Data Extended Data Fig. 2 (download XLSX )
Statistical
Source Data Extended Data Fig. 2 (download PDF )
Liver ORO staining images
Source Data Extended Data Fig. 3 (download XLSX )
Statistical
Source Data Extended Data Fig. 3 (download PDF )
mTOR and autophagy western blots in liver (unprocessed)
Source Data Extended Data Fig. 4 (download XLSX )
Statistical
Source Data Extended Data Fig. 4 (download PDF )
Microglial skeletal images
Source Data Extended Data Fig. 5 (download XLSX )
Statistical
Source Data Extended Data Fig. 5 (download PDF )
Liver and kidney SA-β-Gal images
Source Data Extended Data Fig. 6 (download XLSX )
Statistical
Source Data Extended Data Fig. 6 (download PDF )
AKT and Foxo western blots in female liver (unprocessed)
Source Data Extended Data Fig. 7 (download XLSX )
Statistical
Source Data Extended Data Fig. 7 (download PDF )
OXPHOS and VDAC western blots in liver mitochondria (unprocessed)
Rights and permissions
Open Access This article is licensed under a Creative Commons Attribution-NonCommercial-NoDerivatives 4.0 International License, which permits any non-commercial use, sharing, distribution and reproduction in any medium or format, as long as you give appropriate credit to the original author(s) and the source, provide a link to the Creative Commons licence, and indicate if you modified the licensed material. You do not have permission under this licence to share adapted material derived from this article or parts of it. The images or other third party material in this article are included in the article’s Creative Commons licence, unless indicated otherwise in a credit line to the material. If material is not included in the article’s Creative Commons licence and your intended use is not permitted by statutory regulation or exceeds the permitted use, you will need to obtain permission directly from the copyright holder. To view a copy of this licence, visit http://creativecommons.org/licenses/by-nc-nd/4.0/.
About this article
Cite this article
Calubag, M.F., Ademi, I., Green, C.L. et al. Lifelong restriction of dietary valine has sex-specific benefits for health and lifespan in mice.
Nat Aging (2026). https://doi.org/10.1038/s43587-026-01169-0
Received:04 September 2025
Accepted:16 June 2026
Published:24 July 2026
Version of record:24 July 2026
DOI
:https://doi.org/10.1038/s43587-026-01169-0
