


Download PDF
Abstract
Mood disorders are highly prevalent in society, often disabling, and can lead to a reduced healthspan and lifespan, including by suicide. Depression and bipolar disorders are currently deemed to be chronic and/or treatment-refractory in up to half the patients treated. Additionally, depression and bipolar disorders need to be better distinguished, especially upon initial depressive presentations, as treatments can be quite different. Lack of widespread use of objective and/or quantitative information has hampered treatment and prevention efforts. We sought to uncover the underlying genomic and biological basis of mood disorders in a way that is reliable, comprehensive, and actionable. Blood biomarkers that track mood state can provide a window into the biology of mood, as well as could help with assessment and treatment of mood disorders. Previous studies by us were encouraging. Here we describe new studies we conducted trans-diagnostically in psychiatric patients, starting with the whole transcriptome, to expand the identification, prioritization, validation and testing of blood gene expression biomarkers for mood disorders, and their practical application. We first studied separately the two diametrical phenotypes, low mood/depression and high mood/mania. For each of the phenotypes, we carried out two separate studies, each of them on two different platforms, microarrays and RNA sequencing, using for each platform and study a multiple independent cohorts design. This was done to ensure both the biological and technical reproducibility of the final findings. We focused on biomarkers that were convergent and reproducible between the platforms in each study, for each phenotype. We found new as well as previously known biomarkers that were predictive of depression and of mania states, and of future hospitalizations related to them. We then compared and integrated the findings from the studies on the two phenotypes at the end, identifying bipolar biomarkers, that were changed in expression in opposite direction in the two phenotypes. Using a polyevidence score, the overall top gene expression blood biomarkers for depression were FKBP1A and FOSL2, for bipolar CTSB, and for mania ATP6V1C2. The top biological pathways for depression were related to immune response, for bipolar apoptosis, and for mania necroptosis. Top therapeutic matches for depression were omega-3 fatty acids, lithium, and vortioxetine; for bipolar depression lithium, valproate, and clozapine; and for mania lithium, valproate, and omega-3 fatty acids. Drug repurposing also identified the natural compounds curcumin and berberine as potential treatments for depression. We also illustrate how personalized patient reports for doctors based on gender- specific panels of top blood biomarkers would look like, which can aid with diagnosis and match patients in a personalized way to potential suggested treatments. Using such reports in n = 569 patients clinically diagnosed with depression or bipolar disorder, we distinguish 8 subtypes (depressive disorder, bipolar 2, bipolar 1, bipolar 3, and manic disorder, as well as the milder forms- dysthymia, cyclothymia, hyperthymia, and no mood disorder). Up to half of the patients were classified differently by our reports compared to their clinical diagnosis. Moreover, we demonstrate the clinical utility of our reports by showing that a mismatch between clinical diagnosis and biomarker- based assessment can lead to worse future hospitalizations outcomes. Specifically, patients who were (mis)diagnosed clinically as depression and were in fact on the bipolar spectrum based on biomarkers had increased future hospitalizations, not only for mood disorders exacerbation but also for suicidality and alcoholism. The converse was not true, patients who were (mis)diagnosed clinically as bipolar and were in fact on the depressive spectrum based on biomarkers fared well. Taken together, our results suggest that mood stabilizers, such as low-dose lithium, could be considered more often empirically first line in mood disorders patients, without or with the use of antidepressants, especially given the anti-suicidal properties. As mood disorders are highly prevalent, can severely affect quality of life, and lead to shortened lifespans, there is an urgent need for such insights, and for the added precision and personalization that biomarker tests can offer, to be applied to and improve clinical diagnosis, treatment, and prevention.
Subjects
- Diagnostic markers
- Genetics
Introduction
“The life you have led doesn’t need to be the only life you have.”
Mood is in essence the synchronization of organismal levels of activity with environmental resources. Mood disorders (depression, bipolar disorders) represent a lack of synchronization, and are on a spectrum of severity, from transient (over)reactions to environmental events to chronic endogenously-driven incapacitation. Mood disorders are common and oftentimes disabling conditions. Approximately 20.9 million American adults aged 18 and older have a mood disorder each year, based on estimates from the National Comorbidity Survey [1]. This includes conditions like major depressive disorder, bipolar disorder, dysthymia, and cyclothymia. Up to half of them do not fully respond to treatment, or have adverse reactions, leading to suboptimal quality of life, incapacitation, and in some cases, suicidality [2, 3].
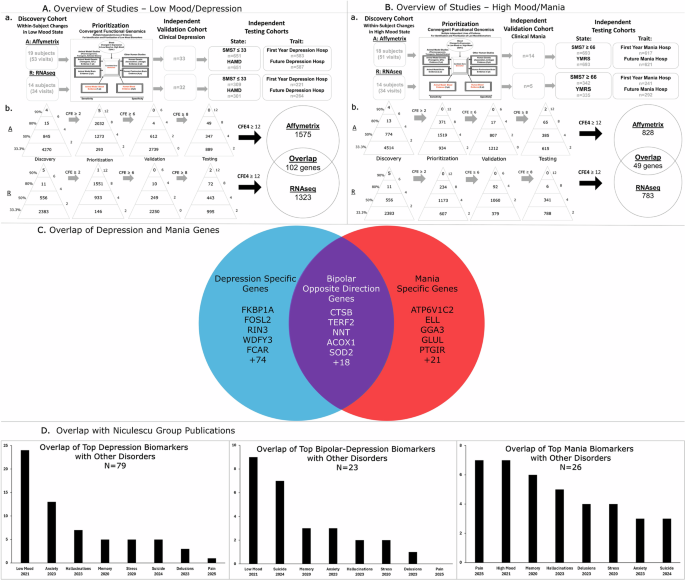
Our previous studies had pioneered the identification of blood gene expression biomarkers for mood disorders [4, 5], and other groups have validated blood-based approaches as well [6]. Other approaches involve imaging [7,8,9], EEG [10] and genetics [11, 12]. Some understanding of the neurobiology has been emerging [13], but is incomplete. Our gene expression studies are complementary to other genetic studies in the field, and in fact we integrate these different lines of work into our approach, as convergent evidence and prioritization second step. We wanted to expand upon our previous studies, as a way of deriving future scientific and practical insights, that would move these precision medicine approaches towards widespread utilization in clinical practice. We focused on reproducibility and convergence, across four different studies: two phenotypes, low mood and high mood; for each, phenotype, studies on two different platforms, microarrays and RNAseq; for each platform, multiple independent non-overlapping cohorts. For each phenotype and platform, our Convergent Functional Evidence (CFE) process had 4 steps- discovery, prioritization, validation, testing. Then we focused on convergence of findings from the two platforms for technical and biological reproducibility. Moreover, at the end, we also examined the overlap between biomarkers involved in low mood and high mood in opposite directions, i.e. bipolar biomarkers (Fig. 1).
Discovery, Prioritization, Validation and Testing of Biomarkers. A Low Mood/Depression and B. for High Mood/Mania. C. Overlap of Top Biomarkers for Low Mood and High Mood. D Mood Top Biomarkers Overlap with Biomarkers for Other Disorders from Our Previous Studies
Compared to our most recent previous work on mood disorders [5], we used larger cohorts of psychiatric patients, larger literature-derived databases for our prioritization step, and longer duration follow-up on subjects, as well as a newer technology platform, RNAseq. With this comprehensive series of studies, we derived a deeper biological, clinical, and therapeutic understanding of mood disorders
On the practical side, we identified therapeutic options. We also show examples of how a biomarker-based report for clinicians looks like. We substantiated, using the reports different subtypes of mood disorders based on biomarkers, beyond the classic depression, bipolar 1, and bipolar 2. Most importantly, we demonstrate the clinical utility of the reports for the cases where there is a mismatch between a clinical diagnosis of depressive disorders and a biomarker-based classification of bipolar disorders.
We propose that these precision medicine approaches can and should be used in clinical practice, to stem and reverse the prevalence of mood disorders
Materials and methods
Cohorts
Consistent with our previous studies [5, 14,15,16,17,18], the psychiatric subjects were part of a longitudinal cohort collected over 20 years by us (2004–2024), the Indy 500+ cohort. Subjects were recruited from the patient population at the Indianapolis VA Medical Center and Indiana University School of Medicine. All subjects understood and signed informed consent forms outlining the research goals, procedure, caveats, utilization of data, and safeguards, per IRB approved protocol. Subjects underwent diagnostic assessments via a comprehensive, structured clinical interview—Diagnostic Interview for Genetic Studies—at a baseline visit, followed by up to ten testing visits, 3–6 months apart or whenever a new hospitalization occurred. At each testing visit, subjects received a series of rating scales, including the Simplified Mood Scale (SMS7), the Hamilton Depression Rating Scale (HAMD), and the Young Mania Rating Scale (YMRS), and their blood was drawn. We collected whole blood (5 ml) in two RNAstabilizing PAXgene tubes, labeled with an anonymized ID number, and stored at −80 degrees C in a locked freezer until further processing. Whole-blood RNA was extracted for microarray and RNA sequencing gene expression studies from the PAXgene tubes, as detailed below.
We conducted four separate studies: for low mood and for high mood, using two different platforms, microarrays and RNAseq, with different independent and non-overlapping cohorts, and then looked at reproducibility and convergence of findings across the studies
For the low mood microarray study, the longitudinal within-subject discovery cohort consisted of 19 subjects with n = 53 testing visits. The subjects had various psychiatric disorders and multiple testing visits with at least one diametric change in SMS7 mood scores from high mood (SMS7 ≥ 66) to low mood (SMS7 ≤ 33) between visits. There was 1 subject with 5 visits, 3 subjects with 4 visits, 6 subjects with 3 visits, and 9 subjects with 2 visits. For validation, there were n = 33 testing visits with clinically severe depression (HAMD ≥ 22). For the independent testing cohort for predicting state, there were n = 651 testing visits. The cohort for predicting future hospitalizations for depression consisted of n = 587 testing visits, on which we had longitudinal follow-up with electronic medical records (Fig. 1, Table S1).
For the low mood RNAseq study, the longitudinal within-subject discovery cohort consisted of 14 subjects with n = 34 testing visits. The subjects had various psychiatric disorders and multiple testing visits with at least one diametric change in SMS7 mood scores from high mood (SMS7 ≥ 66) to low mood (SMS7 ≤ 33) between visits. There was 1 subject with 5 visits, 3 subjects with 3 visits, and 10 subjects with 2 visits. For validation, there were with n = 32 testing visits with clinically severe depression (HAMD ≥ 22). For the independent testing cohort for predicting state, there were n = 309 testing visits. The cohort for predicting future hospitalizations for depression consisted of n = 264 testing visits, on which we had longitudinal follow-up with electronic medical records (Fig. 1, Table S1).
For the high mood microarray study, the longitudinal within-subject discovery cohort consisted of 18 subjects with n = 51 testing visits. The subjects had various psychiatric disorders and multiple testing visits with at least one diametric change in SMS7 mood scores from low mood (SMS7 ≤ 33) to high mood (SMS7 ≥ 66) between visits. For validation, there were n = 14 testing visits with clinically severe mania (YMRS ≥ 20). For the independent testing cohort for predicting state, there were n = 693 testing visits. The cohort for predicting future hospitalizations for mania consisted of n = 621 testing visits, on which we had longitudinal follow-up with electronic medical records (Fig. 1, Table S1).
For the high mood RNAseq study, the longitudinal within-subject discovery cohort consisted of 14 subjects, with n = 34 testing visits. The subjects had various psychiatric disorders and multiple testing visits with at least one diametric change in SMS7 mood scores from low mood (SMS7 ≤ 33) to high mood (SMS7 ≥ 66) between visits. For validation, there were n = 5 testing visits with clinically severe mania (YMRS ≥ 20). For the independent testing cohort for predicting state, there were n = 343 testing visits. The cohort for predicting future hospitalizations for mania consisted of n = 292 testing visits, on which we had longitudinal follow-up with electronic medical records (Fig. 1, Table S1).
Medications
Subjects within the different cohorts had various psychiatric diagnoses and medical co-morbidities. Their medications were listed in their electronic medical records and documented at each testing visit. Subjects were on a wide variety of medications, psychiatric and non-psychiatric, however, there was no pattern of a particular class of medication. Additionally, subjects may be non-compliant with their treatment or have changes in medications or drugs of abuse not listed in their medical records. Our goal is to identify biomarkers that track mood regardless of whether the cause is due to internal biology or prompted by exogenous substances/medications. Some of the biomarkers shown in this paper are in fact targets of medications, and could be used to track response to treatment. Our design allows for discovery, validation, and replication via testing in independent cohorts of the biomarkers to occur despite differences in gender, diagnoses, medications, and other variables in the subjects.
Blood gene expression experiments
RNA extraction
Whole blood (2.5 ml) was collected via routine venipuncture and stored in PaxGene tubes containing proprietary reagents for RNA stabilization. Total RNA was then extracted and processed as previously described [5, 14,15,16,17,18]. In brief, total RNA was isolated using the PAXgene Blood RNA Kit on an automated platform to ensure consistency. The procedure includes a Proteinase K digestion step to remove proteins and an on-column DNase I treatment to eliminate genomic DNA contamination, resulting in high-purity RNA suitable for sensitive downstream applications. To maximize the detection of low-abundance transcripts, the GLOBINclear™ method was utilized to specifically deplete alpha and beta-globin mRNA. This involves the hybridization of biotinylated DNA oligonucleotides to the globin transcripts, which are then physically removed from the total RNA pool using streptavidin-coupled magnetic beads through a non-enzymatic capture process.
Microarrays
Microarray work was completed on a subset of subjects (n = 794) using previously described methodology [5, 14,15,16,17,18]
All genomic data was RMA normalized by gender before being combined and analyzed
RNA sequencing
Next-generation RNA sequencing studies were completed on a separate more recent subject cohort (n = 392). In brief, libraries were constructed using the TruSeq Stranded mRNA protocol, which begins with Oligo(dT) magnetic bead capture to isolate polyadenylated coding transcripts. The methodology utilizes dUTP incorporation during second-strand cDNA synthesis to achieve high strand specificity ( > 99%), allowing for accurate quantification of sense and antisense transcript expression levels. The resulting libraries were pooled and sequenced on an Illumina platform (NovaSeq) using a 50 bp Paired-End (PE) configuration. This dual-end reading approach provides superior alignment to the reference genome and enhances the ability to resolve complex transcript structures compared to single-read methods, targeting a depth of 15 million reads per sample. An Illumina Partek Genomics RNAseq pipeline was then used, with standard QCs, to generate TPMs.
In all RNAseq subjects, transcripts were required to have a minimum TPM count of 0.1 to be carried further into analyses. Transcripts that did not meet that criteria were discarded
Annotation
Ensembl111 was used to map probesets and transcripts to their corresponding genes
Biomarker analyses
For each phenotype, low mood and high mood, the following analyses were performed separately for the microarray and RNAseq studies, and independent candidate biomarkers were identified. For each phenotype, we then focused on top biomarkers that were reproducibly identified on both platforms. Our approach has built-in reproducibility at every step: across multiple independent and non-overlapping cohorts, cross-validated with other studies in the field, and then across platforms. Our approach is also pre-designed and pre-determined, and has been used for other studies we published [18]. We do not adjust parameters until we get a better result. That would lead to overfitting and diminish reproducibility and generalizability.
Step 0: housekeeping gene identification and additional normalization
After the standard, state-of-the-art microarray and RNAseq processing and normalization pipelines, as an innovative step to further normalize and account for any technical variance between samples, a housekeeping gene was selected to use for additional normalization. Not all classic housekeeping genes are “housekeeping”, i.e. invariant or biologically not involved in the disorder, depending on the phenotype. An example of that is GAPDH [19]. So an empirical approach for each disease is best. First, we compiled a list of the most used candidate housekeeping genes in the literature and all their corresponding probesets and transcripts. A mini-Discovery step for tracking mood state was first run on the corresponding housekeeping probesets and transcripts. ALDOA (214687_x_at – ENST00000569798) was the gene with the lowest scoring probeset and transcript (indicating the most invariance with mood). Microarray and RNAseq data was then further normalized in each subject by dividing probeset/transcript expression levels by the expression of ALDOA. All subsequent work described was done using housekeeping gene normalized data. This additional housekeeping gene step also facilitates future translations to qPCR platforms.
Step 1: discovery
For the Microarray studies, a differential expression analysis was run at the probeset level, generating a raw score for each biomarker. Points were given when the probeset expression accurately corresponded to changes in mood (low to high, or high to low). The analysis scores and prioritizes probesets that track changes in mood within subjects, and then across subjects
For the RNAseq cohort, the differential expression analysis was done at the transcript level
Biomarkers decreased in expression had negative scores, and those that increased in expression had positive scores. A value percentile (separate for increased and decreased biomarkers) was assigned to each probeset or transcript based on its final score. The percentiles were assigned by total points: ≥80%-6pts, ≥50%-4pts, <33.3%-0pts (Fig. 1). Biomarkers in the upper 2/3 of the score range, with a score of ≥33.3%-2pt, moved on to the next step, Prioritization
Step 2: prioritization
Databases
In our laboratory we have created databases of human gene expression/protein expression studies (postmortem brain, peripheral tissue/fluids: CSF, blood and cell cultures), human genetic studies (association, copy number variations, and linkage), and animal model gene expression and genetic studies, published to date on psychiatric disorders
Only findings deemed significant in the primary publication by the study authors, using their experimental design and thresholds, are included in the databases. Additionally, our databases only include primary literature data instead of review papers or other secondary data integration analyses to avoid redundancy. Unbiased discovery studies are favored over candidate genes hypothesis-driven studies. Our extensive databases, which are continuously updated, are used in the Convergent Functional Genomics (CFG) prioritization step (Fig. 1).
We performed a search to identify evidence for genes involved in low mood/depression using the keywords: MDD, depression, antidepressant, mood. The search yielded 123 human genetic studies, 136 human brain studies, 232 human peripheral tissue/fluids studies, 12 non-human genetic studies, 390 non-human brain studies, and 69 non-human peripheral tissue/fluids studies
Similarly, we performed a search to identify evidence for genes involved in high mood/mania using the keywords: BP, bipolar, mania, stimulants, mood. This search yielded 227 human genetic studies, 107 human brain studies, 190 human peripheral tissue/fluids studies, 6 non-human genetic studies, 87 non-human brain studies, and 40 non-human peripheral tissue/fluids studies
We have also developed a computerized CFG Wizard to automate and score large lists of genes by integrating evidence from our databases. Analyses were performed as previously detailed. Each gene was assigned points (Human Brain Expression Evidence – 4pts, Human Peripheral Expression Evidence – 2pts, Human Genetic Evidence – 2pts, Non-Human Brain Expression Evidence – 2pts, Non-Human Peripheral Expression Evidence – 1 pt, Non-Human Genetic Evidence – 1 pt). Maximum possible score is 12.
Points were then summed with the Discovery score (0–6). Probesets/transcripts with a combined CFE2 score (prioritization and discovery of at least 6 (upper 2/3 of the distribution) moved on to the next step, Validation (Fig. 1). For low mood: Microarray n = 7,653 probesets, and RNAseq n = 5,013 transcripts. For high mood: Microarray n = 4,094 probesets and RNAseq n = 2,765 transcripts
Step 3: validation
For each of the separate studies, three groups were used for Validation Analyses: the Low Mood (SMS7 ≤ 33) and High Mood (SMS7 ≥ 66) groups from the Discovery cohort, along with the independent cohorts of clinically severe subjects (HAMD ≥ 22 for the low mood/depression studies, YMRS ≥ 20 for high mood/mania studies)
Expression levels were z-scored by gender. We carried out an ANOVA in the biomarkers that were stepwise changed in expression (from high mood to low mood to clinically severe depression; from low mood to high mood to clinically severe mania). Biomarkers that survived Bonferroni correction for number of biomarkers tested received 6 points, those nominally significant 4 points, and those that were just stepwise 2 points. The rest were 0 points
Top candidate biomarkers (after the first 3 steps)
Adding the scores from the first three steps into an overall convergent functional evidence (CFE3) score (Fig. 1) resulted in list of top candidate biomarkers for low mood and for high mood that had a CFE score greater than 8 (upper 2/3 of the possible maximum score of 24 after Step 3). These top candidate biomarkers were carried forward for additional testing in independent cohorts (Step 4)
Step 4: testing
Testing for clinical validity in independent cohorts
For low mood, we tested in independent cohorts of patients the ability of each of the top candidate biomarkers to properly predict low mood state (SMS7 ≤ 33, HAMD ≥ 22) and predict trait risk (future hospitalizations for depression in the first year of follow-up, and in all future years of follow-up). We conducted our analyses across all patients, as well as separately by gender. We did the same for high mood, where we tested in independent cohorts of patients the ability of each of the top candidate biomarkers to assess state severity (SMS7 ≥ 66, YMRS ≥ 20) and predict trait risk (future hospitalizations for mania in the first year of follow-up, and in all future years of follow-up) for patients. We conducted our analyses across all patients, as well as by gender.
For each phenotype and platform, the test cohorts for predicting low mood state and for predicting future hospitalizations with depression, as well as the cohorts for predicting high mood state and for predicting future hospitalizations with mania, were independent from the discovery and validation cohorts. Predictions were performed using R-studio. For cross-sectional analyses, we used biomarker expression levels. For longitudinal analyses, we combined four measures: biomarker expression levels, slope (defined as the ratio of levels at current testing visit vs. previous visit, divided by time between visits), maximum levels (at any of the current or past visits), and maximum slope (between any adjacent current or past visits), as described in previous studies. For decreased biomarkers, we used the minimum rather than the maximum for level calculations.
Predicting state-low mood severity
Receiver-operating characteristic (ROC) analyses SMS7 score≤ 33 in the low mood category vs. the remaining subjects in this independent test cohort. The Microarray cohort consisted of 253 subjects with 651 visits, and the RNAseq cohort consisted of 220 subjects with 309 visits. Additional low mood state predictions were done similarly using the HAMD scores of ≥22. The Microarray cohort for these predictions consisted of 253 subjects with 651 visits, and the RNAseq cohort consisted of 214 subjects with 301 visits. We used the pROC package of R (Table 1 and Fig. 1A).
Predicting state-high mood severity
Similarly, receiver-operating characteristic (ROC) analyses between marker levels and high mood state were performed by assigning subjects’ visits with a SMS7 score≥66 in the high mood category vs. the remaining subjects in this independent test cohort. The Microarray cohort consisted of 269 subjects with 693 visits, and the RNAseq cohort consisted of 244 subjects with 342 visits. Additional high mood state predictions were done in a similar manner using YMRS scores≥20. The Microarray cohort for these predictions consisted of 269 subjects with 693 visits, and the RNAseq cohort consisted of 240 subjects with 335 visits.
Predicting trait- future hospitalizations for depression
We conducted analyses for predicting future hospitalizations with depression as a symptom/reason for admission in the first year following each testing visit in subjects that had at least one year of follow-up, based on electronic medical records. For the Microarray study there were 221 subjects with 586 visits, and for the RNAseq study 147 subjects with 196 visits. ROC analyses between biomarkers measures (cross-sectional, longitudinal) at a testing visit and future hospitalizations were performed.
We also conducted Cox regression analyses for all future hospitalizations with depression (Microarray: 222 subjects, 586 visits, RNAseq: 199 subjects, 262 visits), including those occurring beyond one year of follow-up (Microarray: up to 18.2 years, average: 10.8 years; RNAseq up to 14.4 years, average: 2.9 years). The Cox regression was performed using the time in days from the visit date to the first hospitalization date in the case of patients who had hospitalizations with depression or from the visit date to the last note date in the electronic medical records for those who did not. These calculations account for the actual length of follow-up, which varied from subject to subject. The hazard ratio was calculated such that a value greater than 1 always indicates an increased risk for hospitalizations, regardless of whether the biomarker has increased or decreased expression.
Predicting trait- future hospitalizations for mania
Similarly to low mood, we conducted analyses for predicting future hospitalizations with mania as a symptom/reason for admission in the first year following each testing visit in subjects that had at least one year of follow-up. For the Microarray study we had 234 subjects with 617 visits, and for the RNAseq study 162 subjects with 216 visits. ROC analyses between biomarkers measures (cross-sectional, longitudinal) at a specific testing visit and future hospitalizations were performed
Similarly to low mood, we did the a Cox regression for all future hospitalizations with mania (Microarray: 235 subjects, 620 visits, RNAseq: 220 subjects, 290 visits), including those occurring beyond one year of follow-up (Microarray: up to 18.2 years, average: 10.6 years; RNAseq up to 14.4 years, average: 2.9 years)
Scoring
Biomarkers that are nominally significant (for ROC AUC for State and First Year Hospitalization predictions, Cox Regression Hazard Ratio for All Future Hospitalization predictions) receive 3 points if they were predictive in all subjects in the cohort and 2 points if they are only predictive within a gender. Scores are capped at 3, and the maximum score between cross-sectional and longitudinal predictions for each biomarker is taken moving forward
Overall CFE score after steps 1–4
These points are then added to each biomarker’s CFE score to create a final score (discovery + prioritization + validation + state predictions + trait predictions) indicative of each marker’s ability to track and predict depression or mania (Table 1). The maximum possible CFE4 score is 36 (6 + 12 + 6 + 12) on each platform. Final CFE4 scores for these markers were the sum of the microarray studies discovery score, RNAseq studies discovery score, prioritization score, microarray studies validation score, RNAseq studies validation score, microarray studies testing score, and RNAseq studies testing score.
Overlap between low and high mood
After independently finding the top biomarkers for low and high mood, we examined the overlap between the two phenotypes, with 23 genes in the opposite directions in low and high mood. We summed each gene’s low and high mood CFE4 scores to get an overall bipolar score
Biological understanding
Pathway analyses
We performed the pathway analyses for the 79 biomarkers for depression, 23 for bipolar, and 26 for mania. We conducted standard analyses using Ingenuity Pathway Analyses (IPA) and DAVID Functional Annotation Analysis (National Institute of Allergy and Infectious Diseases) (v2024q2). We also used AI (Grok, by xAI) and the prompt: “What are the top 5 biological pathways in which these genes are involved (rank by enrichment/overrepresentation)?”
CFG beyond mood: evidence for involvement in other psychiatric and related disorders
We also used a CFG approach to examine evidence from other psychiatric and related disorders, as exemplified by the list of top biomarkers after Steps 1–4 (Table S3). This was not used to prioritize genes but rather to understand the molecular basis of co-morbidities
Therapeutics
Pharmacogenomics
We analyzed which of the top biomarkers after Steps 1–4 are known to be changed in expression by existing drugs in a direction opposite to the one in the disease, using our CFG databases (Table 1 and S4). Drugs are also listed individually by biomarker affected
Drug repurposing
Candidate repurposed drugs were identified in an exploratory fashion by using AI (Grok, by xAI) and the prompt: “What are the FDA approved compounds or nutraceuticals that have an opposite effect on the gene expression signature (for depression, bipolar depression, mania)? Provide an estimated match score and p-value.” We also used the CFG databases to find best therapeutic matches for the biomarker signatures (Table 3). These drugs and nutraceuticals are potential treatments and preventatives for patients with depression, bipolar depression, or mania, and are used in the prototype reports (described below) to illustrate personalized medicine.
Report generation
Step 5 – Generalizability
Top biomarkers for low mood (n = 102) and high mood (n = 49) were retested for stepwise changes from low to high mood in the whole dataset of patients (n = 1186), In an additional Step 5, all the nominally significant biomarkers were tested for generalizability/being stepwise between low risk and high risk populations, by gender, in the combined dataset of all the samples (n = 1186), consisting of male (n = 942) and female (n = 244) groups. Out of these generalizable stepwise biomarkers for each gender, male and female, the ones with the top overall CFE score were combined in panels for state and one year risk to generate reports for doctors, as shown in Fig. 3.
We selected as case studies two patients, a man and a woman, with clinical diagnoses of depression, who subsequently died by suicide. We used panels of top biomarkers by gender for each disorder after Step 5, for state and for one year risk of future hospitalizations
Score generation
For low and high mood, the raw expression values of the biomarkers in our whole gene expression dataset (n = 1186) were Z-scored by gender and platform (e.g., RNAseq or microarray). For low mood state scores, the Z-scored expression value of each increased biomarker was compared to the average value for the biomarker in the low mood group in the database, resulting in scores of 1 or 0, respectively, and 0.5 if it is in between. The reverse was done for decreased biomarkers. For high mood state scores, the Z-scored expression value of each increased biomarker was compared to the average value for the biomarker in the high mood group in the database, resulting in scores of 1 or 0, respectively, and 0.5 if it is in between. The reverse was done for decreased biomarkers.
For the one year risk score for depression, we calculated the average expression value for a biomarker in the first-year hospitalizations for the depression group, and in subjects with no hospitalizations for depression in the first-year. We then compared the biomarkers for the subject of interest to these reference levels. If a biomarker was higher than the average of the hospitalization group, it got a 1; if it was below the average of the no hospitalizations group, it got a 0, and if it was in between, it got a 0.5 for increased biomarkers. For decreased biomarkers, if it was lower than the average of the hospitalizations group, it got a 1. If it was higher than the average of the no hospitalizations group, it got a 0, and if it was in between, it got a 0.5.
Similarly, for the one year risk score for mania, we calculated the average expression value for a biomarker in the first-year hospitalizations for the mania group and in subjects with no hospitalizations for mania in the first-year. We then compared the biomarkers for the subject of interest to these reference levels. If a biomarker was higher than the average of the hospitalization group, it got a 1. If it was below the average of the no group, it got a 0, and if it was in between, it got a 0.5 for increased biomarkers. For decreased biomarkers, if it was lower than the average of the hospitalization group, it got a 1. If it was higher than the average of the no hospitalization group, it got a 0, and if it was in between, it got a 0.5.
The digitized scores for each biomarker are multiplied by the CFE4 score of each biomarker as a weight to account for the totality of the evidence, then summed into a polygenic risk score, and then divided by a sum of all CFE4 scores and multiplied by 100, generating 3 risk categories: high (red), intermediate (yellow), and low (green)
Additionally, the biomarkers can also be used to match patients to existing psychiatric medications and alternative treatments (nutraceuticals and others). We use our large datasets and literature databases to match biomarkers to medications that have effects on gene expression opposite to their expression in low or high moods. The gene expression data is from human and animal model studies. Each medication match to a high risk biomarker (that had a score of 1) gets a score of 1. The scores for a medication matching to the panel of biomarkers are added, and then divided by the number of high risk biomarkers in the panel, and multiplied by 100, resulting in a percentile match. Their CFE4 scores are used as weights for each biomarker. Thus, medications are matched to the patient’s biology, and ranked in order of impact on the panel of biomarkers.
The separate analyses of treatment matching on panels for low mood and high mood were then integrated, displaying a patient’s medication match scores and suggested top individualized treatments given their low mood and high mood risks
Results
In Step 1 Discovery, we used a powerful within –subject and then across-subject design in a longitudinally followed cohort of subjects who displayed a diametric change in the SMS7 visual-analog scale mood measure (from the lower tertile <33 to the upper tertile >66, and vice-versa) between at least two consecutive testing visits, to identify differentially expressed genes that track mood state
In Step 2 Prioritization, we used a Convergent Functional Genomics (CFG) approach to prioritize the candidate biomarkers identified in the discovery step (score of ≥2 pt.) by using prior published literature evidence (genetic, gene expression and proteomic), from human and animal model studies, for involvement in mood disorders (Fig. 1 and Table S2). Probesets/ transcripts that had a total score (combined discovery score and prioritization score) of ≥6 (upper 2/3 of the distribution) were carried forward to the validation step.
In Step 3 Validation, we validated the prioritized candidate biomarkers for change in an independent cohort of patients with clinically severe depression as measured by HAMD for the low mood biomarkers, and clinically severe mania as measured by YMRS for the high mood biomarkers. We assessed which biomarkers were stepwise changed in expression from the discovery cohort to the clinically severe cohort (Fig. 1)
In Step 4, Testing for Clinical Utility, for each platform (Microarray, RNAseq), we examined in independent cohorts from the ones used for discovery or validation whether the top candidate biomarkers after the first three steps can assess mood states, as well as predict future hospitalizations due to mood disorders (Fig. 1 and Table S1), using electronic medical records follow-up data of our study subjects (up to 18.2 years from initial visit at the time of the analyses). Similar to what we did for the validation step, the gene expression data in the test cohorts was normalized (Z-scored) by gender, before those groups were combined for predictions. We used as predictors biomarker levels information cross-sectionally, as well as expanded longitudinal information about biomarker levels and slope at multiple visits. We tested the biomarkers in all subjects in the independent test cohort, as well as by gender (Fig. 1).
For the top biomarkers, we computed into a convergent functional evidence (CFE) score all the evidence from discovery (up to 6 points), CFG prioritization (up to 12 points), validation (up to 6 points), and testing (predicting mood state, first year hospitalizations, all future hospitalizations for mood disorders- up to 3 points each if it significantly predicts in all subjects, 2 points if in gender). The total score can be up to 36 points: 24 from our own new data, and 12 from literature data used for CFG. We weigh our new data more than the literature data, as it is functionally related to mood in 6 independent cohorts (discovery, validation, testing x 2 platforms, microarrays and RNAseq). The goal is to highlight, based on the totality of our data and of the evidence in the field to date, biomarkers that have all around evidence: track mood, have convergent evidence for involvement in mood, as well as predict mood state and future clinical events (Table 1).
Adding the scores from the four steps into an overall convergent functional evidence (CFE) score (Fig. 1), we ended up with a list of 102 top candidate biomarkers for low mood, and 49 candidate biomarkers for high mood in common between the microarray samples cohorts and the RNAseq samples cohorts, that had a CFE4 score ≥12, better than 33% of the maximum possible score of 24 after the four steps, which we used as an empirical cutoff (Fig. 1 and Table 1)
The top 5 blood biomarkers with the strongest overall convergent functional evidence (CFE) for tracking and predicting depression, on two separate platforms, in multiple independent cohorts, (Table 1A) were, in descending order of combined CFE scores were: FKBP1A (FKBP Prolyl Isomerase 1A), FOSL2 (FOS Like 2, AP-1 Transcription Factor Subunit), RIN3 (Ras And Rab Interactor 3), WDFY3 (WD Repeat And FYVE Domain Containing 3), and FCAR (Fc Alpha Receptor)
The top 5 blood biomarkers with the strongest overall convergent functional evidence (CFE) for bipolar disorder (tracking and predicting depression and mania with gene expression in opposite direction) (Table 1B) were, in descending order of combined CFE4 score: CTSB (Cathepsin B), TERF2 (Telomeric Repeat Binding Factor 2), NNT (Nicotinamide Nucleotide Transhydrogenase), ACOX1 (Acyl-CoA Oxidase 1), and SOD2 (Superoxide Dismutase 2)
The top 5 blood biomarkers with the strongest overall convergent functional evidence (CFE) for tracking and predicting mania, after all four steps, on independent cohorts run on two separate platforms (Table 1C) were, in descending order of combined CFE4 score: ATP6V1C2 (ATPase H+ Transporting V1 Subunit C2), ELL (Elongation Factor For RNA Polymerase II), GGA3 (Golgi Associated, Gamma Adaptin Ear Containing, ARF Binding Protein 3), HSP90AB1 (Heat Shock Protein 90 Alpha Family Class B Member 1), and PTGIR (Prostaglandin I2 Receptor).
FKBP1A (FKBP Prolyl Isomerase 1A), an overall top biomarker for depression in this study, functions primarily as a peptidyl-prolyl cis-trans isomerase (PPIase), which accelerates protein folding by catalyzing the isomerization of proline imidic peptide bonds in oligopeptides. This enzymatic activity helps in the proper folding and stabilization of various proteins. Beyond its isomerase role, FKBP1A is involved in immunoregulation. It binds to immunosuppressive drugs like FK506 (tacrolimus) and rapamycin (sirolimus). When complexed with FK506, it inhibits the phosphatase activity of calcineurin, which suppresses T-cell activation and is key to its role in preventing organ transplant rejection. With rapamycin, the complex inhibits mTOR signaling, affecting cell growth and proliferation. It is decreased in expression in low mood states in our study, consistent with increased immune activation and mTOR signaling. FKBP1A has previous convergent evidence for involvement in mood disorders (Table S2). It is also decreased in expression in aging, alcoholism, dementia, and stress (Table S3). It is normalized (increased in expression) by fluoxetine, vortioxetine, lithium, valproate, clozapine, diazepam, as well as the nutraceutical magnesium.
FOSL2 (FOS Like 2, AP-1 Transcription Factor Subunit), another overall top biomarker for depression in this study, is a versatile transcription factor that helps cells adapt to their environment by modulating gene expression to influence diverse cellular processes such as cell growth and differentiation, as well as inflammation and immune response. FOSL2 expression is tightly controlled by external signals like growth factors, cytokines, and stress, often via MAPK signaling pathways. It is increased in expression in low mood states in our study, which is consistent with the fact that chronic stress, a key contributor to depression, can upregulate AP-1 activity, including FOSL2, in brain regions like the hippocampus and prefrontal cortex, which are critical for mood regulation. FOSL2 has previous convergent evidence for involvement in mood (Table S2). It is also increased in expression in alcoholism, anxiety, dementia, pain, psychosis, sleep disorders, stress, and suicidality (Table S3). It is normalized (decreased in expression) by the nutraceutical omega-3 fatty acids (Table S4).
CTSB (Cathepsin B), the top overall biomarker for bipolar, is a lysosomal cysteine protease enzyme with diverse roles in cellular processes, including apoptosis and inflammation and immune response. It is increased in expression in low mood states. Consistent with this, CTSB is involved in processing inflammatory molecules, and elevated inflammation is implicated in neuroinflammatory states that worsen mood episodes. CTSB has previous convergent evidence for involvement in mood (Table S2). It is also increased in expression in aging, alcoholism, anxiety, dementia, pain, schizophrenia and stress (Table S3). It is normalized (decreased in expression) by fluoxetine, clozapine, and the nutraceuticals curcumin, N-Acetyl-L-Cysteine, Rutin and Zinc, as well as by running (Table S4).
ATP6V1C2 (ATPase H+ Transporting V1 Subunit C2), is a subunit of a multi-subunit enzyme complex responsible for ATP-dependent proton transport across membranes (V-ATPase), which plays a key role in acidifying and maintaining the pH of intracellular organelles, which is critical for processes like protein sorting, degradation, and vesicular trafficking. It is decreased in expression in high mood states. Consistent with this, there is evidence from magnetic resonance spectroscopy (MRS) studies suggesting that altered intracellular pH—specifically, a less acidic (higher) pH, which can be interpreted as decreased intracellular acidification—is associated with manic states in bipolar disorder. Systematic reviews of brain pH in bipolar disorder indicate that overall, patients tend to have lower intracellular pH compared to healthy controls, but this is state-dependent: during manic (and depressive) episodes, pH is less acidic (higher) than during euthymia. ATP6V1C2 has previous convergent evidence for involvement in mood (Table S2). It is also decreased in expression in aging and alcoholism (Table S3). It is normalized (increased in expression) by valproate (Table S4).
Biological understanding
Biological pathways
We carried out biological pathway analyses using the list of top biomarkers for depression (n = 79 genes), bipolar disorder (n = 23 genes), and mania (n = 26 genes) (Table 2). The top pathways for depression were related to immune response and transcription, for bipolar related to apoptosis, and for mania necroptosis and apoptosis. Asthma was the top disease identified by the pathway analyses program for depression and bipolar, pointing out to a molecular underpinning for a known but less appreciated clinical co-morbidity [20].
Therapeutics (Table 3)
For depression, omega-3 fatty acids (18.6%), lithium (17.9%) and vortioxetine (16.8%) were the top matches. In terms of drug repurposing, dexamethasone was a top hit, along with curcumin and berberine
For bipolar depression, lithium (38.9%), valproate (27%) and clozapine (22.8%) were the top matches. For drug repurposing, mifepristone was a top hit, along with berberine
For mania, lithium (45.8%), valproate (42%) and omega-3 fatty acids (23.2%) were the top matches. For drug repurposing, interferon-alpha was a top hit
Omega-3 fatty acids may be a widely deployable preventive treatment, with minimal side-effects, including in women who are or may become pregnant
Reports
In Step 4, we identified best predictive biomarkers for mood state and trait (first year, and all future years risk), using cross-sectional and longitudinal methodology (Fig. 2)
Top cross-sectional and longitudinal biomarkers are shown in all subjects, males, and females. * Nominally significant. ** Bonferroni significant after correcting for number of biomarkers tested
In an additional Step 5, all the nominally significant biomarkers were tested for generalizability/being stepwise between low risk and high risk populations, by gender, in the combined dataset of all the samples (n = 1186). Out of these generalizable stepwise biomarkers for each gender, male and female, the ones with the top overall CFE score were combined in panels for state and one year risk to generate reports for doctors, as shown in Fig. 3
A Female patient. B Male patient. Reports based on panels of top predictive biomarkers for that gender. At the bottom is the biomarker based diagnostic classification key
Biomarker diagnosis
The reports scores and risk category (high, intermediate, low) for one year risk, for low mood and high mood, can be used combinatorially to generate 8 types of mood disorders diagnostic suggestions: dysthymic disorder, cyclothymic disorder, hyperthymic disorder, depressive disorder, bipolar 2, bipolar 1, bipolar 3, and manic disorder (Figs. 3, 4). The scores and risk category for state (high, intermediate, low) can be used as qualifiers for the mood disorders: likely, probable, possible (Figure S3).
Impact of mismatch on future hospitalizations. Odds Ratios are calculated as the average future hospitalization frequency of the group divided by the average future hospitalization frequency of the match group. Number of subjects in each group are depicted in the figure
Using such reports in n = 569 patients clinically diagnosed with depression or bipolar disorder (Table 4), we show that almost half of the patients are classified differently by the biomarkers assessments than by their clinical diagnosis (Table 4). Moreover, we demonstrate the clinical utility of our reports by showing that a mismatch between clinical diagnosis and biomarker- based assessment (with the 8 subtypes-depressive disorder, bipolar 2, bipolar 1, bipolar 3, and manic disorder, as well as the milder forms- dysthymia, cyclothymia, hyperthymia, and no mood disorder) can lead to worse future hospitalizations outcomes (Fig. 4). Specifically, patients who were diagnosed clinically as depression and were in fact on the bipolar spectrum based on biomarkers had increased future hospitalizations, not only for mood disorders exacerbation but also for suicidality and alcoholism. The converse was not true, patients who were diagnosed clinically as bipolar and were in fact on the depressive spectrum based on biomarkers fared well. This, and our other results, suggest that mood stabilizers used in bipolar, such as low-dose lithium, could be considered empirically first line in all mood disorders patients, without or with the use of antidepressants, especially given the anti-suicidal properties.
Discussion
We describe novel and comprehensive efforts to advance precision medicine approaches for mood disorders using biomarkers. The top blood biomarkers were discovered, validated and tested in multiple independent cohorts, on two different platforms, to ensure biological and technical reproducibility, and to evaluate predictive ability and clinical validity. They led to distinguishing 8 types of mood disorders. These biomarkers also open a window into understanding the biology of mood disorders, and to new therapeutic approaches.
Current clinical practice and the need for biomarkers
Assessing a persons’ internal subjective perceptions and thoughts, along with more objective external ratings of actions and behaviors, are used in clinical practice to assess mood. Such an approach is insufficient, and lagging those used in other medical disorders. Moreover, individuals do not always report accurately their mood, or the clinician does not take them seriously, leading to missed opportunities to intervene and help. A critical area is distinguishing between depression and bipolar disorders, especially on initial presentation, as the two can have quite different treatments. Blood biomarkers related to mood, if used as part of mental health clinical visits and even routine primary care annual exams, would provide a critical objective measurement to inform clinical assessments and treatment decisions. We show that almost half of the patients are classified differently by the biomarkers assessments than by their clinical diagnosis (Table 4).
Advantages of biomarkers
Blood biomarkers offer real-world clinical practice advantages. As the brain cannot be readily biopsied in live individuals, and CSF is less easily accessible than blood, we have endeavored over the years to identify blood biomarkers for neuropsychiatric disorders and for pain. A whole –blood approach facilitates field deployment of sample collection. The assessment of gene expression changes focuses our approach on immune cells. The ability to identify peripheral gene expression changes that reflect brain activities is likely due to the fact that the brain and immune system have developmental commonalities, marked by shared reactivity and ensuing gene expression patterns. There is also a bi-directional interaction between the brain and immune system. Not all changes in expression in peripheral cells are reflective of or germane to brain activity. By carefully tracking a phenotype with our within-subject design in the discovery step, and then using convergent functional genomics prioritization, we are able to extract the peripheral changes that do track and are relevant to the brain activity studied, in this case mood. Subsequent validation and testing in independent cohorts narrow the list to the best markers. In the end, we do not expect to recapitulate in the blood all that happens in the brain. We just want to have good accessible peripheral biomarkers- “liquid biopsies”, as they are called in cancer.
Comprehensiveness
In this current work, we carried out extensive blood gene expression studies in male and female subjects with major psychiatric disorders, an enriched population in terms of co-morbidity with mood disorders. The potential molecular-level co-morbidity between other psychiatric disorders and mood is underlined by the fact that medications for mood disorders (antidepressants, mood stabilizers) are also used to treat stress, anxiety, even pain. Our primary goal was to discover and validate biomarkers for mood, that are transdiagnostic. Secondarily, we aimed to understand their universality vs. their specificity by gender.
Our studies were arranged in a stepwise fashion. For each phenotype, low mood and high mood, on each of the two platforms, microarray and RNAseq, we took the same systematic 4-step Convergent Functional Evidence approach. First, in Discovery, we endeavored to discover blood gene expression biomarkers for mood using a longitudinal design, looking at differential expression of genes in the blood of male and female subjects with major psychiatric disorders (bipolar disorder, major depressive disorder, schizophrenia/schizoaffective, and post-traumatic stress disorder (PTSD)), high risk populations prone to mood abnormalities, which constitute an enriched pool in which to look for biomarkers. We compared low mood states to high mood states using a powerful within-subject design [21,22,23,24], to generate a list of differentially expressed genes. Second, in Prioritization, we used a comprehensive Convergent Functional Genomics (CFG) approach with the whole body of knowledge in the field to prioritize from the list of differentially expressed genes/biomarkers of relevance to mood disorders. CFG integrates multiple independent lines of evidence- genetic, gene expression, and protein data, from brain and periphery, from human and animal model studies, as a Bayesian strategy for identifying and prioritizing findings, reducing the false-positives and false-negatives inherent in each individual approach. Third, in Validation, we examined if the expression levels of the top biomarkers identified by us as tracking mood state are changed even more strongly in blood samples from an independent cohort of subjects who had severe clinical depression or severe clinical mania, to validate these biomarkers. Fourth, in Testing, the top candidate biomarkers thus discovered, prioritized, and validated were tested for predictive ability in corresponding independent cohorts of psychiatric subjects. Fifth, Generalizability, for each phenotype, the top biomarkers that converged between the microarray and RNAseq studies were tested for overall generalizability in the whole mothership of samples from the two studies. Lastly we exemplified the use of panels of top biomarkers after Step 5 in reports for physicians, to predict state and one-year risk, and to match patients to medications and nutraceuticals (Fig. 3). This series of studies was a systematic and comprehensive approach to move the field forward towards precision medicine.
Power
We used a systematic discovery, prioritization, validation, and testing in multiple independent cohorts approach, as we have done over the years for other disorders [5, 15, 25,26,27,28]. For discovery, we used a hard to accomplish but powerful within-subject design. A within-subject design factors out genetic variability, as well as some medications, lifestyle, and demographic effects on gene expression, permitting identification of relevant signal with Ns as small as 1 [21]. Another benefit of a within-subject design may be accuracy/consistency of psychiatric symptoms (“phene expression”), as it is the same person reporting different states. This is similar in rationale to the signal detection benefits it provides in gene expression.
Based on our work of over two decades in genetics and gene expression, along with the results of others in the field, we estimate that using a quantitative phenotype is up to 1 order of magnitude more powerful than using a categorical diagnosis. The within-subject longitudinal design, by factoring out all genetic and some environmental variability, is up to 3 orders of magnitude more powerful than an inter-subject case-control cross-sectional design. Moreover, gene expression, by integrating the effects of many SNPs and environment, is up to 3 orders of magnitude more powerful than a genetic study. Combined, our approach may be up to 6 orders of magnitude more powerful than a GWAS (Genome-Wide Association Study), even prior to the CFG literature-based prioritization step, which encompasses all the independent work in the field prior to our studies, which may add up to 1 order of magnitude as well. In addition, the Validation and the Testing in independent cohorts steps add additional 1 order of magnitude power each. As such, our approach might be up to 10 orders of magnitude more powered to detect signal than most current genetic study designs used in GWAS.
Reproducibility
We reproduced and expanded our earlier biomarker findings [28]. 32% of our top biomarkers for low mood (n = 102) and for high mood (n = 49) from the current work (Fig. 1) were identified in the Discovery step of our 2021 study, that was smaller and was done on a single platform, microarrays
Additionally, there is reproducibility of our candidate biomarkers from Discovery with findings generated by other independent studies as part of the Step 2 Prioritization using Convergent Functional Genomics (see Table S2). This independent reproducibility of findings between our studies and these other studies, which are done in independent cohorts from ours, with independent methodologies, is reassuring, and provides strong convergent evidence for the validity and relevance of our approach and of their approaches. Our work also provides functional evidence for some of their top genetic hits.
After our analyses were completed, a new GWAS for bipolar disorder was published [29]. Of note, none of their top 36 genes were among our top biomarkers for low mood (n = 102) or high mood (n = 49). However, more than a third of them (14 out of the 36, – 39%) were present as blood biomarkers with lower levels of evidence in our work (ARHGAP15, FURIN, THRA, MED24, HTT, RBFOX1, EXD3, MLEC, OLFM1, SPEF1, BCL11B, SHISA9, SP4, MSANTD1- See Table S6). OLFM1 was also a top biomarker in a previous mood biomarker study of ours [5].
Pathophysiology
The majority of top blood biomarkers we have identified have some prior evidence in human brain and genetic data from mood disorders studies, which indicates their relevance to the pathophysiology of mood (Table S2). The co-directionality of blood changes in our work and brain changes reported in the literature needs to be interpreted with caution, as it may depend on brain region
The top biomarkers also had prior evidence of involvement in other psychiatric and related disorders (Table 1 and S3, Fig. 1D), providing a molecular basis for co-morbidity, and the possible predisposing effects of some these disorders on mood. In particular, direct comparisons with our previous blood biomarkers studies for other disorders (Fig. 1D) revealed the top overlap for depression to be with anxiety, besides the overlap with our previous work on mood disorders. That is consistent with what is seen clinically, and the widespread use of SSRIs that target both. The top overlap for bipolar depression was with suicidality, consistent with the very high known clinical risk in that population. The top overlap for mania was with pain, suggesting some degree of sensory excess/neuronal excitability occurs, and consistent with the use of anticonvulsant medications for both these disorders. There was also a significant degree of molecular co-morbidity with aging and longevity (Table S7), consistent with the idea that mood may not only affect health span but also lifespan.
The top biological pathways (Table 2A) for depression were related to immune response, and some of the top therapeutic matches (Table 3) were immune suppressing (dexamethasone, ruxolitinib, rapamycin) and anti-inflammatory drugs (omega-3 fatty acids, indomethacin, minocycline). For bipolar and mania the pathways were related to apoptosis, and the top match lithium has known anti-apoptotic and cell survival effects through BCL2. Mood may be a whole-body adaptation, survival and thriving in response to whether the environment is favorable or hostile.
More granularly, 7 of the 15 top genes depicted in Table 1 had evidence for involvement in dopaminergic signaling (FKBP1A, FOSL2, RIN3 for depression genes, CTSB, NNT, SOD2 for bipolar genes, and GLUL for mania genes). 7 had evidence for involvement in mitochondrial function (FKBP1A, RIN3, WDFY3 for depression, and CTSB, TERF2, NNT and SOD2 for bipolar). 3 had evidence for involvement in circadian clock mechanisms (FOSL2 for depression, SOD2 for bipolar, and GLUL for mania). That is a 20% rate, compared to the 7% rate in the genome, resulting in a 3-fold enrichment. Overall there is an enrichment in clock genes among our biomarkers for mood disorders. 13.9% of the biomarkers for depression (n = 79), 13% of the top biomarkers for bipolar (n = 23), and 11.5% of the top biomarkers for mania (n = 26) are circadian genes.
Phenomenology
We have also looked in an exploratory fashion at possible phenotypical subtypes of depression in the subjects from the discovery cohort while they were in a low mood state. We identified 16 possible subtypes, based on two-way unsupervised hierarchical clustering on measures of stress, anxiety and suicidality (Figure S2A). The subtypes with the most subsequent hospitalizations in the year following testing tended to have high suicidality as a common factor (Figure S2B)
Biomarkers vs. scales
In general, the best predictive biomarkers were better than the rating scales at predicting future hospitalizations for depression and for mania (Table S5). This reinforces the need for using objective blood biomarkers to assess mood
Diagnostics
For the biomarkers identified by us, combining all the available evidence from this current work into a convergent functional evidence (CFE) score, brings to the fore biomarkers that have clinical utility for objective assessment and risk prediction for mood disorders (Table 1). These biomarkers can be used as polygenic panels of biomarkers in future clinical studies and practical clinical applications in the field. They may permit to distinguish, upon an initial clinical presentation of a mood disorder, whether the person is in fact severely so, and at chronic risk, as well as which possible type of mood disorder they have (Figs. 3, 4 and S3). The use of phenomic data, such as repeated measures of a visual-analog scale for mood such as SMS7, via a phone app, in a daily fashion, can further substantiate and elucidate depression phenotypic types and risk (Figure S3).
The predictive ability of the biomarkers were clinically informative, and certainly better than the current alternative, which is no objective information. For longitudinal predictions, individual biomarkers were in general stronger in women than in men (Table 1 and Fig. 2), by an order of 10–20% points on AUCs. While some of it may be biological, in terms of immune system reactivity and brain-blood interplay being perhaps higher in women, it is also possible that men are not as accurate as women in terms of reporting mood symptoms (affecting our results on state predictions), and may seek help less (affecting our results on future hospitalizations predictions). If so, this misreporting makes the use of objective biomarker tests in men even more necessary.
In regard to how our biomarker discoveries might be applied in clinical laboratory settings, we suggest that panels of top biomarkers for mood by gender be used (Fig. 3). In practice, every new patient tested would be normalized against the database of similar patients already tested, and compared to them for ranking and risk prediction purposes, regardless if a platform like microarrays, RNA sequencing, or a more targeted one like qPCR is used in the end clinically. As databases get larger, normative population levels can and should be established, similar to any other laboratory measures. Moreover, longitudinal monitoring of changes in biomarkers within an individual, measuring most recent slope of change, maximum levels attained, and maximum slope of change attained in the past, may be even more informative than simple cross-sectional comparisons of levels within an individual with normative populational levels, as we have shown in our studies. For future point of care approaches, research and development should focus on top individual biomarkers, including at a protein level. One might look at a combination of the best universal biomarkers (that are predictive in all), for reliability, and of the best personalized biomarkers (that are predictive by gender), for higher accuracy.
Treatment
Biomarkers may also be useful for empirically matching patients to suggested medications and measuring response to treatment (pharmacogenomics) (Fig. 3, Table 3 and S4), as well as new drug discovery clinical trials, and drug repositioning. From the pharmacogenomics analyses, for depression, the nutraceutical omega-3 fatty acids were the top hit, second was the mood stabilizer lithium, and third the antidepressant vortioxetine. Other interesting matches were indomethacin, minocycline, and carvedilol, as well as the nutraceuticals vitamin D3, ginseng, and magnesium. For bipolar depression, lithium was the top hit, second was the mood stabilizer valproate, and third was the antipsychotic clozapine. Other interesting matches were dapagliflozin, doxycycline, and carvedilol, as well as the nutraceuticals curcumin, ginseng, and omega-3 fatty acids. For mania, lithium was the top hit, second was valproate, and third were omega-3 fatty acids. Other interesting matches were indomethacin and estrogen, as well as the nutraceuticals magnesium and CBD. All these drugs and nutraceuticals are relatively safe if used appropriately, and have been used in clinical practice for decades, which facilitates the direct translation to clinical practice of our findings. In particular, there has been a longstanding interest to find biomarkers that match people to lithium and can be used to track response, given its clinical utility in mood disorders and suicide prevention [30].
Conclusions
Overall, this work is a major step forward towards better understanding, diagnosing, and treating mood disorders. Taken together, our data supports the possibility that biologically, mood disorders are disorders of adaptation to the environment
In terms of co-morbidity with other psychiatric disorders, anxiety needs to be actively addressed and mitigated in depression, suicidality in bipolar, and pain in mania
For objective assessment, our biomarkers may help with making the crucial distinction between depression and bipolar disorders, especially upon an initial depressive presentation. Our data suggests it may be missed clinically in up to half the cases. We hope that our trait biomarkers for future risk and suggestions for medication matches may be useful in preventive approaches, before full-blown clinical episode manifest (or re-occur). Prevention in general can be accomplished with biological interventions (i.e., early targeted use of medications or nutraceuticals), lifestyle changes, and psychological therapies. The two cases of subjects we generated reports on illustrates the power of our approach to identify risk (Fig. 3). Our biomarker testing identified in both of them as a top suggested medication match lithium, which is FDA approved for suicide prevention. Neither of them was on that medication when the blood samples were collected, or on other medications recommended by the reports. Moreover, in the case of the female patient, there was also a diagnostic mismatch between her clinical diagnosis of depression, and the bipolar 2 diagnosis suggested by our report. The subjects went on to die by suicide one year (the female patient), respectively five years (the male patient), after the blood samples had been collected.
Given the fact that mood disorders are highly prevalent and on the increase in the US and worldwide, that mood disorders can severely affect quality of life and lead to shortened lifespans, that not all patients are diagnosed and classified correctly and/or are on the right treatments, there is an urgent need for biomarker tests such as the ones we have developed to be applied to and help improve clinical diagnosis, treatment, and prevention
Data availability
The data that support the findings of this study are not openly available due to reasons of privacy and sensitivity. They are available from the corresponding author upon reasonable request. Please send correspondence to A.B. Niculescu (aniculescu@arizona.edu)
References
Kessler RC, Chiu WT, Demler O, Merikangas KR, Walters EE. Prevalence, severity, and comorbidity of 12-month DSM-IV disorders in the National Comorbidity Survey Replication. Arch Gen Psychiatry. 2005;62:617–27
Rush AJ, Trivedi MH, Wisniewski SR, Nierenberg AA, Stewart JW, Warden D, et al. Acute and longer-term outcomes in depressed outpatients requiring one or several treatment steps: a STAR*D report. Am J Psychiatry. 2006;163:1905–17
Geddes JR, Miklowitz DJ. Treatment of bipolar disorder. Lancet. 2013;381:1672–82
Le-Niculescu H, Kurian SM, Yehyawi N, Dike C, Patel SD, Edenberg HJ, et al. Identifying blood biomarkers for mood disorders using convergent functional genomics. Mol Psychiatry. 2009;14:156–74
Le-Niculescu H, Roseberry K, Gill SS, Levey DF, Phalen PL, Mullen J, et al. Precision medicine for mood disorders: objective assessment, risk prediction, pharmacogenomics, and repurposed drugs. Mol Psychiatry. 2021;26:2776–804
Fundaun J, Kolski M, Molina-Alvarez M, Baskozos G, Schmid AB. Types and concentrations of blood-based biomarkers in adults with peripheral neuropathies: a systematic review and meta-analysis. JAMA Netw Open. 2022;5:e2248593
Colic L, Sankar A, Goldman DA, Kim JA, Blumberg HP. Towards a neurodevelopmental model of bipolar disorder: a critical review of trait- and state-related functional neuroimaging in adolescents and young adults. Mol Psychiatry. 2025;30:1089–101
Lynch CJ, Elbau IG, Ng T, Ayaz A, Zhu S, Wolk D, et al. Frontostriatal salience network expansion in individuals in depression. Nature. 2024;633:624–33
Tozzi L, Zhang X, Pines A, Olmsted AM, Zhai ES, Anene ET, et al. Personalized brain circuit scores identify clinically distinct biotypes in depression and anxiety. Nat Med. 2024;30:2076–87
Chen H, Lei Y, Li R, Xia X, Cui N, Chen X, et al. Resting-state EEG dynamic functional connectivity distinguishes non-psychotic major depression, psychotic major depression and schizophrenia. Mol Psychiatry. 2024;29:1088–98
Yamamoto H, Lee-Okada HC, Ikeda M, Nakamura T, Saito T, Takata A, et al. GWAS-identified bipolar disorder risk allele in the FADS1/2 gene region links mood episodes and unsaturated fatty acid metabolism in mutant mice. Mol Psychiatry. 2023;28:2848–56
Yu C, Bakshi A, Agustini B, Walker A, Lin T, Lotfaliany M, et al. Genomic risk prediction for depression in a large prospective study of older adults of European descent. Mol Psychiatry. 2025;30:5865–72
Gold PW, Wong ML. Advances in discerning the mechanisms underlying depression and resiliency: relation to the neurobiology of stress and the effects of antidepressants. Mol Psychiatry. 2025;30:3226–39
Niculescu AB, Le-Niculescu H. Precision medicine in psychiatry: biomarkers to the forefront. Neuropsychopharmacology. 2022;47:422–3
Roseberry K, Le-Niculescu H, Levey DF, Bhagar R, Soe K, Rogers J, et al. Towards precision medicine for anxiety disorders: objective assessment, risk prediction, pharmacogenomics, and repurposed drugs. Mol Psychiatry. 2023;28:2894–912
Bhagar R, Gill SS, Le-Niculescu H, Yin C, Roseberry K, Mullen J, et al. Next-generation precision medicine for suicidality prevention. Transl Psychiatry. 2024;14:362
Hill MD, Gill SS, Le-Niculescu H, MacKie O, Bhagar R, Roseberry K, et al. Precision medicine for psychotic disorders: objective assessment, risk prediction, and pharmacogenomics. Mol Psychiatry. 2024;9:1528–49
Bhagar R, Le-Niculescu H, Corey SC, Gettelfinger AS, Schmitz M, Ebushi A, et al. Next-generation precision medicine for pain. Mol Psychiatry. 2026;31:869–94
Ramos A, Ishizuka K, Hayashida A, Namkung H, Hayes LN, Srivastava R, et al. Nuclear GAPDH in cortical microglia mediates cellular stress-induced cognitive inflexibility. Mol Psychiatry. 2025;30:363
Duchene B, Dixon AE Bidirectional relationships between depression and asthma. Expert Rev Respir Med. 2026;20:523–33
Chen R, Mias GI, Li-Pook-Than J, Jiang L, Lam HY, Miriami E, et al. Personal omics profiling reveals dynamic molecular and medical phenotypes. Cell. 2012;148:1293–307
Le-Niculescu H, Levey DF, Ayalew M, Palmer L, Gavrin LM, Jain N, et al. Discovery and validation of blood biomarkers for suicidality. Mol Psychiatry. 2013;18:1249–64
Niculescu AB, Levey DF, Phalen PL, Le-Niculescu H, Dainton HD, Jain N, et al. Understanding and predicting suicidality using a combined genomic and clinical risk assessment approach. Mol Psychiatry. 2015;20:1266–85
Levey DF, Niculescu EM, Le-Niculescu H, Dainton HL, Phalen PL, Ladd TB, et al. Towards understanding and predicting suicidality in women: biomarkers and clinical risk assessment. Mol Psychiatry. 2016;21:768–85
Niculescu AB, Le-Niculescu H, Levey DF, Roseberry K, Soe KC, Rogers J, et al. Towards precision medicine for pain: diagnostic biomarkers and repurposed drugs. Mol Psychiatry. 2019;24:501–22
Le-Niculescu H, Roseberry K, Levey DF, Rogers J, Kosary K, Prabha S, et al. Towards precision medicine for stress disorders: diagnostic biomarkers and targeted drugs. Mol Psychiatry. 2020;25:918–38
Niculescu AB, Le-Niculescu H, Roseberry K, Wang S, Hart J, Kaur A, et al. Blood biomarkers for memory: toward early detection of risk for Alzheimer disease, pharmacogenomics, and repurposed drugs. Mol Psychiatry. 2020;25:1651–72
Niculescu AB, Le-Niculescu H, Levey DF, Phalen PL, Dainton HL, Roseberry K, et al. Precision medicine for suicidality: from universality to subtypes and personalization. Mol Psychiatry. 2017;22:1250–73
O’Connell KS, Koromina M, van der Veen T, Boltz T, David FS, Yang JMK, et al. Genomics yields biological and phenotypic insights into bipolar disorder. Nature. 2025;639:968–75
Fornaro M, De Berardis D, Anastasia A, Novello S, Fusco A, Cattaneo CI, et al. The identification of biomarkers predicting acute and maintenance lithium treatment response in bipolar disorder: A plea for further research attention. Psychiatry Res. 2018;269:658–72
Acknowledgements
We would like to acknowledge our gratitude for the work and results of the many other groups, cited in our paper, who have conducted and published studies (clinical, genetic, and biological) in mood and related disorders. Combining their work with ours makes a convergent approach possible. We also would particularly like to thank the subjects in these studies and their families. Without their contribution, such work to advance the understanding of suicidality would not be possible. This work was supported by NIH grants (R01MH117431) and a VA Merit Award (2I01CX000139) to ABN.
Author information
Author notes
These authors contributed equally: J. Balducci, E. Gobel, M. Schmitz
Authors and Affiliations
Department of Psychiatry, University of Arizona College of Medicine, Phoenix, AZ, USA
J. Balducci, E. Gobel, A. Germanos, R. Bhagar, H. Le-Niculescu & AB Niculescu
MindX Sciences, Indianapolis, IN, USA
M. Schmitz, J. French, SM Kurian, A. Shekhar & AB Niculescu
Case Western Reserve University, Cleveland, OH, USA
SC Corey
Scripps Health, La Jolla, CA, USA
SM Kurian
Office of the Dean, University of Pittsburgh School of Medicine, Pittsburgh, PA, USA
A. Shekhar
VA Medical Center, Phoenix, AZ, USA
AB Niculescu
Authors
- J. BalducciView author publications
Search author on:PubMed Google Scholar
- E. GobelView author publications
Search author on:PubMed Google Scholar
- M. SchmitzView author publications
Search author on:PubMed Google Scholar
- J. FrenchView author publications
Search author on:PubMed Google Scholar
- A. GermanosView author publications
Search author on:PubMed Google Scholar
- SC CoreyView author publications
Search author on:PubMed Google Scholar
- R. BhagarView author publications
Search author on:PubMed Google Scholar
- SM KurianView author publications
Search author on:PubMed Google Scholar
- A. ShekharView author publications
Search author on:PubMed Google Scholar
- H. Le-NiculescuView author publications
Search author on:PubMed Google Scholar
- AB NiculescuView author publications
Search author on:PubMed Google Scholar
Contributions
ABN designed the study and wrote the manuscript. HLN, JB, EG, MS, JF, AG, SC, RB analyzed the data. MS and JF assisted with biomarker reports generation. SMK oversaw microarray and RNA sequencing experiments and analyses. AS assisted with data interpretation. All authors discussed the results and commented on the manuscript
Ethics declarations
Competing interests
ABN is listed as inventor on patent applications licensed by MindX Sciences. ABN and AS are co-founders, SMK is a consultant, and MS and JF are full-time employee of MindX Sciences
Additional information
Publisher’s note Springer Nature remains neutral with regard to jurisdictional claims in published maps and institutional affiliations
Supplementary information
Supplementary Information (download DOCX )
Rights and permissions
Open Access This article is licensed under a Creative Commons Attribution-NonCommercial-NoDerivatives 4.0 International License, which permits any non-commercial use, sharing, distribution and reproduction in any medium or format, as long as you give appropriate credit to the original author(s) and the source, provide a link to the Creative Commons licence, and indicate if you modified the licensed material. You do not have permission under this licence to share adapted material derived from this article or parts of it. The images or other third party material in this article are included in the article’s Creative Commons licence, unless indicated otherwise in a credit line to the material. If material is not included in the article’s Creative Commons licence and your intended use is not permitted by statutory regulation or exceeds the permitted use, you will need to obtain permission directly from the copyright holder. To view a copy of this licence, visit http://creativecommons.org/licenses/by-nc-nd/4.0/.
About this article
Cite this article
Balducci, J., Gobel, E., Schmitz, M. et al. Next-generation precision medicine for mood disorders: reproducible blood biomarkers enable objective diagnostics, subtyping, and targeted therapeutics.
Mol Psychiatry (2026). https://doi.org/10.1038/s41380-026-03736-8
Received:15 January 2026
Revised:23 June 2026
Accepted:25 June 2026
Published:04 August 2026
Version of record:04 August 2026
DOI
:https://doi.org/10.1038/s41380-026-03736-8
