


Download PDF
Abstract
Background
Growing recognition that social determinants of health (SDoH) strongly influence health outcomes has expanded their inclusion in biomedical research, underscoring the need to evaluate how best to incorporate these data into disease prediction models
Methods
The All of Us (AoU) Research Program is a large, diverse biomedical research dataset that includes participants from across the United States and links electronic health records (EHRs) with extensive survey data covering a wide range of health, lifestyle, and social factors. We assessed selection bias in the SDoH surveys by comparing demographic characteristics across cohorts with varying EHR and survey completion requirements. We additionally used a series of logistic regression models to evaluate the predictive utility of SDoH for nine chronic conditions, compared these results to models using only socioeconomic status (SES), self-reported race and ethnicity, or additional area-level SDoH factors, and discussed the associated trade-offs.
Results
Here we show that requiring sufficient individual-level SDoH survey data results in significant selection bias and sample reduction in AoU. We also show that SES alone captures a substantial proportion of the predictive signal from individual-level SDoH data while preserving sample size and mitigating selection bias. Moreover, SES measures provide greater predictive utility than self-reported race and ethnicity, without excluding underrepresented groups. We find disease-specific patterns of association with SDoH and that area-level SDoH metrics contribute to disease prediction independently of individual-level measures.
Conclusions
Altogether, we emphasize key analytical considerations and disease-specific trade-offs for the integration of SDoH data into disease prediction models in AoU and similar cohorts
View this article’s peer review reports
Introduction
A growing body of evidence highlights the substantial role of social determinants of health (SDoH) in shaping disease risk and progression1,2,3,4,5,6,7. Healthy People 2030 (HP2030) is a United States (US) initiative focused on improving health and well-being that defines SDoH as “the conditions in the environment where people are born, learn, work, play, worship, and age” and organizes these determinants into five domains which provide a framework for analysis and interpretation: economic stability, education access and quality, social and community context, neighborhood and built environment, and health care access and quality8. Some studies have begun directly incorporating socioeconomic status (SES) metrics, such as income and education or area-level SES metrics, such as the Social Deprivation Index, into disease prediction models, particularly as a replacement for race and ethnicity, which have historically served as imprecise and often misinterpreted proxies capturing social and structural phenomena9,10,11,12,13,14. As more comprehensive SDoH data become available, optimal analysis and interpretation of these measures in complex health data sets is critical. However, large-scale integration of SDoH across domains in disease risk modeling and clinical research remains challenging due to the use of disparate measures across healthcare systems and research studies, the absence of defined gold standard measures and best practices for transforming or combining variables and limited understanding of how individual-level and area-level factors contribute to disease risk across populations and for different pathologies, resulting in limited reproducibility and generalizability of results15,16.
To address this gap, we utilized the All of Us (AoU) Research Program. AoU is one of the first cohorts to collect robust SDoH data across a large and diverse segment of the US population that also has linked electronic healthcare records (EHRs)17. Given the strong interest in studying SDoH effects and the exponentially increasing number of analyses in the AoU cohort, we aimed to identify considerations and best practices for working with these SDoH measures in this important data set8
First, we review the selection bias created by the requirement for the availability of sufficient EHR data for health-related analyses and in-depth SDoH survey measures. We next compare the ability of these measures to predict disease prevalence with simpler SES metrics as well as self-identified race and ethnicity (SIRE). Moreover, we explore the comparative predictive value of individual-level and area-level SDoH metrics in disease prediction for nine chronic conditions. We then use the diverse measures included in individual-level SDoH surveys to construct five domain-specific SDoH scores aligned with the HP2030 framework and an overall composite SDoH score to illuminate how these domains contribute to overall social risk. Next, we use these domain scores to better understand how SDoH affects disease. Lastly, to highlight the breadth of SDoH-disease associations which researchers may explore in AoU, and thus the scope of analyses which may be impacted by SDoH-related analytic decisions, we perform a phenome-wide association study demonstrating the scope of SDoH-disease associations in All of Us. Our approach explores the strengths, limitations, and interrelatedness of a variety of SDoH measures, especially as they relate to the inherent trade-offs between sample size, introduction of selection bias, and optimal utilization of granular individual-level SDoH information. We also highlight how considering both individual-level and area-level SDoH can enhance disease risk modeling across a diverse cohort, and we investigate disease-specific patterns of SDoH associations.
Methods
All of us research program
The All of Us (AoU) Research Program – a National Institutes of Health (NIH)-funded initiative designed to increase the scale and diversity of biomedical research participants and to reduce health disparities – began enrolling participants in May 201818. The program implements multiple strategies to ensure adequate representation of individuals historically underrepresented in biomedical research and collects a wide range of data, including demographic characteristics, individual- and area-level SDoH, participant-reported health outcomes and behaviors, electronic health records (EHRs), and genetic information. Version release 8 (V8) includes 633,547 individuals.
SDoH instruments
As part of its diverse data collection to advance precision health, AoU administers surveys to its participants. The Basics survey was among the first three surveys developed by All of Us and is administered at enrollment19. It collects core demographic and socioeconomic information, including self-reported race, ethnicity, income, and education. 633,532 participants completed the Basics survey in V8 (the Full Cohort), although with variable degrees of item non-response (17.3% for race and ethnicity, 2.3% for educational attainment, 18.1% for income). AoU also employed a SDoH Task Force of subject matter experts, who developed a scientifically valid and reliable survey to collect self-reported data on key dimensions of SDoH17. At the time of V8, 259,189 participants had completed at least some questions on the SDoH survey, but non-response and non-random item missingness associated with educational attainment, racial and ethnic identity, and survey language have been reported17. AoU also has a Health Care Access & Utilization (HCAU) survey, which 305,857 participants have completed. Overall, there are 24 unique SDoH survey items (Supplementary Fig. 1). Income and household size were used to calculate the percentage of the poverty threshold using U.S. federal poverty guidelines, wherein annual household income was divided by the corresponding poverty threshold based on location (contiguous state vs Alaska vs Hawaii), size of household, and date of survey completion. This value was then multiplied by 100, coded such that higher values indicate lower income and higher risk, z-score normalized, and reported as a percentage of the poverty threshold.
AoU currently provides area-level SDoH measures at the three-digit ZIP code level through linkage with the 2017 American Community Survey (ACS). These include measures related to each HP2030 domain except social and community context (SCC), including economic stability (ES; median household income, percent receiving assisted income, percent living below the poverty limit), education access and quality (Education; percent of adults over 25 with a high school diploma), neighborhood and built environment (NBE; percent vacant housing), and health care access and utilization (HCAU; percent without health insurance). Additionally, AoU includes the Nationwide Community Deprivation Index (NCDI), the first principal component from the six different ACS measures, which explains over 60% of the total variance in census-tract-level measurements from the ACS20. To facilitate comparability, we transformed high school education and median household income to be in the direction of risk, along with the rest of the measures. Due to their high correlation (0.66–0.86), leading to model convergence issues, and conceptual overlap, percent receiving assisted income and percent living below the poverty line were not used in our analyses, while median household income within a three-digit zip code was.
All continuous SDoH variables were z-score normalized for comparability
Cohorts
We included all study participants who completed the Basics survey and had adequate EHR completeness for determination of case/control status across multiple chronic conditions, defined as having at least three distinct clinical encounters over a span of three or more years (n = 162,193). Among these, 125,295 had linked area-level SDoH data along with individual-level education, income, and household size data (“SES Cohort”), and 54,313 completed the individual-level SDoH and HCAU surveys with at least a 60% response rate across all five Healthy People 2030 domains, including income data for the economic stability domain (the “Individual SDoH Cohort”; Supplementary Fig. 2).
Some analyses incorporated self-identified race and ethnicity (SIRE), which was categorized into three groups: non-Hispanic Black (NHB), non-Hispanic White (NHW; used as the reference category due to sample size), and Hispanic (HS). These were the only groups with sufficient sample sizes across all disease outcomes; therefore, individuals who self-identified as Middle Eastern or North African, multiracial, Native Hawaiian or Other Pacific Islander, Asian, or who skipped or declined to answer the demographic question were excluded from these analyses. This filtering resulted in the creation of two additional sub-cohorts derived from the SES and Individual SDoH Cohorts – limited to individuals identifying as NHW, NHB, or HS – the “SES-SIRE Cohort” (n = 117,535) and the “Individual SDoH-SIRE Cohort” (n = 51,265).
SDoH domain development
SDoH survey scores were derived from items included in the Basics, SDoH, and HCAU surveys (https://www.researchallofus.org/data-tools/survey-explorer/). Within each SDoH survey, there are multiple questions for conceptually related items that come from validated survey instruments. For example, there are eight questions related to loneliness that come from the validated UCLA loneliness scale21. These eight questions were averaged to obtain a single score for the loneliness construct. As with loneliness, each item was transformed and scored according to its validated use following the mapping strategy outlined by the AoU SDOH Task Force and hosted on AoU as a demonstration workspace (“Demo – SDoH”)17. This framework was applied to the SDoH survey, and a similar approach, with additional guidance from the PhenX Toolkit (a web-based catalog of recommended measurement protocols of phenotypes and exposures for inclusion in translational human research studies), was used to construct survey scales from the HCAU survey22. We calculated Cronbach’s alpha to ensure internal consistency of each scale of related survey items within our cohort. In total, there were 24 unique individual-level SDoH constructs obtained from these surveys (supplementary data 1) with various degrees of missingness (supplementary data 2). Further methodological details, including transformation of survey items and scale development information, are provided in Appendix I.
Disease definition algorithms
To evaluate how these latent SDoH constructs relate to health outcomes, we analyzed nine chronic conditions previously selected for their high prevalence, cost, and medical actionability23,24,25. Disease definitions were adapted from validated EHR-based algorithms from the Electronic Medical Records and Genomics (eMERGE) network. These algorithms are for asthma, atrial fibrillation (Afib), breast cancer, chronic kidney disease (CKD), coronary heart disease (CHD), hypercholesterolemia (HCL), prostate cancer, type 1 diabetes (T1D), and type 2 diabetes (T2D).
Covariates
Age was recorded at the last event in the EHR record. Sex at birth and gender (henceforth “Sex/Gender”) were self-reported and categorized as cisgender female, cisgender male, or a collapsed sexual or gender minority (SGM) categorization (aggregated due to limited sample size). We approximated record depth by adding the number of unique visits in which the EHR record contained an observation or condition code. We then calculated visit frequency by dividing record depth by EHR length (max–min date in the record).
For breast cancer and prostate cancer models, we excluded participants identifying as cisgender males or cisgender females, respectively. Additionally, individuals identifying as SGM were excluded from CKD and T1D models due to insufficient case counts (<20)
Imputation
After filtering the SDoH cohort to individuals with income and education data as well as a 60% response rate across all five Healthy People 2030 domains, we performed missing data imputation for variables input into logistic regression models. Missing data was imputed with ten imputations (ridge = 0.001) using the mice package in R (v.3.17.0). All 24 SDoH variables, covariates (age, age2, Sex/Gender, visit frequency, record depth), and SIRE (Asian American, Native Hawaiian, or Other Pacific Islander; Black; Middle Eastern or North African (MENA); Multiple; White; Hispanic; PNA or Skip) were used as predictive variables.
Evaluation of the performance of SIRE, SES, and SDoH measures in disease prediction models
To evaluate the disease-specific predictive value of SIRE, SES, and individual- and area-level SDoH measures, standard logistic regression models were fitted for the prevalence of each of the nine chronic conditions, using a sequential modeling approach with four sets of predictors in the Individual SDoH-SIRE Cohort (n = 51,265):
- 1.
Base model: age (at last EHR entry) + age2 + Sex/Gender + visit frequency, + record depth
- 2.
SIRE model: base model + NHB + HS
- a.
SIRE + SES model: SIRE model + percent of poverty threshold + education
- b.
SIRE + SDoH model: SIRE model + Individual-level SDoH survey items (n = 24)
- 1.
SES model: base model + percent of poverty threshold + education
- 2.
Individual SDoH model: base model + Individual-level SDoH survey items (n = 24)
Similarly, five models were fit in the SES-SIRE Cohort (n = 117,535):
- 1.
Base model: age (at last EHR entry), age2, Sex/Gender, visit frequency, + record depth
- 2.
SIRE model: base model + NHB + HS
- 3.
SES model: base model + percent of poverty threshold + education
- 4.
Area PsRS model: base model + Area-level SDoH data (n = 7)
- 5.
Combined model: SES model + Area-level SDoH data
Model performance was evaluated using the area under the curve (AUC), with 95% confidence intervals and pairwise differences between models assessed using DeLong’s test (two-sided) implemented with the pROC package (version 1.19.0.1) in R. A Bonferroni threshold of P < 3.70 ×10⁻⁴ (0.05/135) was used to adjust for the number of comparisons across models and conditions in the Individual SDoH-SIRE Cohort and P < 9.26 ×10⁻⁴ (0.05/54) in the SES-SIRE Cohort
Construction and Evaluation of Composite SDoH Scores using Structural Equation Modeling (SEM):
SDoH constructs instrument scales were then grouped into domains following the HP2030 framework, and single latent domain scores were derived for each domain using Confirmatory Factor Analysis (CFA) with the lavaan package (missing = “fiml”) (version 0.6–19) in R (version 4.5.0). Full Information Maximum Likelihood (FIML) was used to handle missing data. Additionally, CFA was used to derive an overall composite SDoH metric from the five SDoH domains. For the composite metric, social cohesion was cross-loaded between SCC and NBE, as it comes from a social cohesion among neighbors survey. Employment-related items were excluded from the financial security domain, as they did not adequately capture this construct in our Individual SDoH Cohort (reduced model fit). A combination of theory (conceptually related items) and modification indices (residual variance >0.09) was used to determine whether to include error correlations among related items. Model fit was assessed using comparative fit index (CFI), Root mean square error of approximation (RMSEA), and standardized root mean square residual (SRMR), where CFI > 0.95, RMSEA < 0.06, and SRMR < 0.10 constitute good model fit26,27.
Each disease outcome was modeled using Structural Equation Modeling (SEM) with imputed data and a Maximum Likelihood with Robust Standard Errors (MLR) estimator using the lavaan package (version 0.6–19). SEM allows for latent variables to be modeled as predictors in regression models while accounting for measurement error and allowing correlations among predictors. To obtain effect estimates for SDoH variables, separate models were run for each individual-level and area-level SDoH domain with disease outcome, adjusting for age, age-squared, Sex/Gender, record depth, and visit frequency, and allowing errors for age and age2 to covary with the SDoH latent domain. Standardized estimates were used to enable direct comparison of coefficients. Statistical significance was assessed using the p-value output from the parameterEstimates() function (two-sided) and was adjusted using a Bonferroni-corrected threshold of P < 4.27 ×10⁻⁴ (0.05/90), accounting for 10 SDoH domains across nine disease outcomes in the Individual SDoH Cohort.
Phenome-wide association study (PheWAS)
PheWAS can be used to scan for associations with groups of International Classification of Diseases (ICD) codes (phecodes) to capture meaningful relationships between predictors and disease28. We adapted the PheWAS pipeline hosted by AoU as a demonstration workspace (“Demo – PheWAS Smoking”), using phecode v1.2; setting the minimum number of cases to 100 to ensure sufficient sample size and statistical power; and using age at most recent phecode, Sex/Gender, record depth, and visit frequency as covariates29. Disease status was defined by the presence of at least two instances of the same phecode; individuals with only one instance were considered neither a case nor a control and were excluded from analysis for that disease. Phecode groupings were restricted to circulatory system, endocrine/metabolic, genitourinary, neoplasms, and respiratory, groupings also represented in our nine chronic conditions from the main models.
A targeted PheWAS was conducted in each cohort. In the Individual SDoH Cohort, associations were tested across the five domains and the area-level metrics for a total of ten predictors. Five hundred and thirteen unique diseases were tested, resulting in a Bonferroni-corrected threshold of 9.750 ×10⁻⁶ (0.05/5130). In the SES Cohort, associations were tested across the percent of poverty threshold, education, and the area-level metrics for a total of seven predictors. 621 unique diseases were tested, resulting in a Bonferroni-corrected threshold of 1.15 ×10⁻⁵ (0.05/4347).
Ethical approval and data access
This study used data from the AoU Research Program Researcher Workbench. All participants provided informed consent at enrollment in the program. Access to Registered and Controlled Tier data was limited to authorized researchers who completed required ethics and data use training and agreed to the AoU Data User Code of Conduct and related data access policies. All analyses were conducted within the secure AoU Researcher Workbench environment in accordance with program policies designed to protect participant privacy and confidentiality. Researchers complied with the AoU Data and Statistics Dissemination Policy, including suppression of small cell counts. Institutional review board (IRB) requirements were followed in accordance with local institutional policies.
Results
Participant characteristics
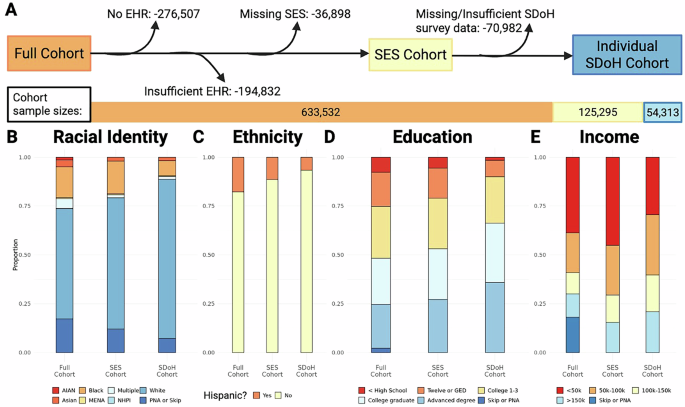
Among 633,547 participants in AoU V8 (the Full Cohort), 162,193 had sufficient electronic health records (EHRs). Among these, 125,295 had individual-level income and household size (to calculate the percentage of the poverty threshold), individual-level educational attainment, and linked area-level SDoH data (SES Cohort). 54,313 had sufficient individual-level SDoH (Individual SDoH Cohort; Supplementary Fig. 2). Requiring both sufficient EHR (at least 3 visits over at least 3 years) and SDoH (completion of at least 60% of survey items) resulted in extreme selection bias, excluding 91.4% of the sample and increasing the proportion of White individuals from 56.5% to 81.3% of the remaining sample, as well as selecting a sample with higher income, higher education, and higher rates of privately, VA or military, or Medicare-insured individuals (Table 1, Fig. 1). In the Individual SDoH Cohort, a substantial 66.2% held at least a four-year college degree, compared to 37.7% of the US population in 202230. Moreover, analysis of participant characteristics across SIRE groups reveals key patterns of demographic intersectionality, with non-Hispanic Black (NHB) and Hispanic (HS) individuals being younger and having shorter record depth, lower educational attainment, and lower income compared to non-Hispanic White (NHW) individuals (supplementary data 3). Participants identifying as NHB and HS were consistently younger than other groups, while NHW participants were the oldest across all cohorts. Demographic information for case and control groups in each cohort can be found in supplementary data 4–7.
A Cohort(s) flow diagram with exclusions and sample sizes. Insufficient EHR denotes EHRs with fewer than three entries and/or fewer than three years long. 100% stacked bar charts illustrating the proportional shifts of demographic characteristics across cohorts for B Racial identity, C Hispanic ethnicity D Education levels, and E Income levels. Exact sample sizes can be found in Table 1. Abbreviations: EHR electronic health records, SES socioeconomic status, SDoH social determinants of health, AIAN American Indian or Alaska Native, MENA Middle Eastern or North African, NHPI Native Hawaiian or Other Pacific Islander, PNA prefer not to answer, GED general educational development
Performance of SIRE, SES, and SDoH measures in disease prediction models
We compared logistic regression models predicting disease prevalence for nine clinically relevant diseases using SIRE to those using SES (Fig. 2A). We found that SES aids in the prediction of more health outcomes than SIRE does (six vs three traits). Moreover, we found that even for diseases where SIRE does add predictive value (i.e., type 2 diabetes), SES outperforms SIRE. The only exception was CKD, which may be partly attributable to the historical incorporation of race into estimated glomerular filtration rate (eGFR) calculations and CKD diagnostic practices31. Moreover, using SIRE resulted in the exclusion of self-identified racial groups with insufficient sample sizes, reinforcing minoritization and further excluding individuals whose identity does not fit neatly into predetermined categories.
A Dot plot showing the mean AUC and corresponding 95% confidence intervals from logistic regression models predicting disease prevalence in the Individual-SIRE Cohort. The x-axis is organized by disease with the case size in parentheses. Each dot is color-coded by model type. The Base model includes age, age2, and Sex/Gender, visit frequency, and record depth. Additional models are color-coded and add SIRE (orange) or percent of poverty threshold and education individual-level SES metrics (percent of poverty threshold and education; light blue) to the covariates included in the Base model. One star indicates nominal significance, two stars indicate Bonferroni corrected significance (p < 3.7 ×10⁻⁴ (0.05/135)), while three stars indicate p < 5 ×10-11. Comparisons were made using a two-sided DeLong test and exact p-values (Base + SIRE vs Base | Base + SES vs Base + SIRE | Base + SES vs Base) are as follows: Afib (0.02, 0.4, 0.1), asthma (0.5, 0.1, 0.1), breast cancer (0.03, 0.04, 3.8 ×10⁻³), CHD (0.2, 8.1 ×10⁻¹¹, 9.7 ×10⁻¹²), CKD (1.5 ×10⁻²⁴, 6.4 ×10⁻⁴, 2.4 ×10⁻¹⁹), HCL (5.4 ×10⁻³, 5.9 ×10⁻⁴, 1.5 ×10⁻⁵), prostate cancer (1.6 ×10⁻³, 3.8 ×10-13,1.0 ×10-20), T1D (3.4 ×10⁻⁵, 5.3 ×10⁻³, 2.0 ×10⁻⁸), T2D (1.2 ×10-71, 2.2 ×10⁻¹², 2.0 ×10-105). Case sizes for each disease are listed on the chart and case and control sizes are as follows: Afib (cases n = 3865 | controls n = 7226), asthma (5245 | 13,708), breast cancer (2664 | 29,767), CHD (5957 | 43,455), CKD (3617 | 12,897), HCL (12,205 | 4640), prostate cancer (1821 | 3470), T1D (686 | 18,887), T2D (8169 | 18,887). B Bar chart comparing the gain in model accuracy (AUC) between models that add the two individual-level SES metrics vs models that add the set of 24 Individual-level SDoH variables. The x-axis is organized by disease with the case size in parenthesis, as in (A). Percentages indicate the proportion of delta AUC from the Base + Individual SDoH model captured by the Base + SES model. Exact odds ratios and 95% confidence intervals can be found in supplementary data 8. Case and control sample sizes are the same as in A. Abbreviations: SIRE self-identified race and ethnicity, SES socioeconomic status, SDoH social determinants of health, Afib atrial fibrillation, CHD coronary heart disease, CKD chronic kidney disease, HCL hypercholesterolemia, T1D type 1 diabetes, T2D, type 2 diabetes
While individual SES alone (two measures) improved disease prediction for six out of nine conditions tested here, complete individual SDoH data (24 measures) improved prediction for all traits (supplementary data 8). For traits in which SES improved AUC by at least .05 AUC (prostate cancer, T1D, and T2D), SES captured approximately 75% of the signal of all Individual-level SDoH in the Individual SDoH-SIRE Cohort (Fig. 2B). Results were similar in the Individual SDoH Cohort in which small SIRE groups were not excluded (Supplementary Fig. 3). On the other hand, for asthma and Afib, SES only captured 8% and 7% of the signal respectively, suggesting that for these traits, SDoH beyond SES contribute more heavily to disease. For all other traits, SES captured 35% to 65% of the signal from the full individual-level SDoH data, highlighting disease-specific trade-offs and analytical considerations.
For traits in which SIRE improved disease prediction compared to the base model– CKD, T1D, T2D– we were interested in whether adding SDoH in the same model attenuated the association between SIRE and disease (Fig. 3). Adjusting for SES and SDoH partially attenuated the associations between indicator variables for NHB and HS SIRE (versus NHW reference group) and these disease outcomes, but did not fully eliminate them (supplementary data 9). This suggests that for a subset of our tested traits, racialization and ethnoracialization contribute to disease risk beyond the SDoH measures captured in AoU (Fig. 3). Notably, inclusion of the full set of individual-level SDoH variables did not significantly attenuate associations beyond adjustment for SES alone.
Forest plot of odds ratios (ORs) for significant associations between SIRE and disease outcomes among non-Hispanic Black (NHB; triangle) and Hispanic (HS; circle) individuals, with non-Hispanic White (NHW) as the reference group. Central points represent estimated ORs and error bars (horizontal lines) indicate 95% confidence intervals. Models are shown without adjustment for SES or SDoH (orange), adjusted for SES (light blue), and adjusted for individual-level SDoH measures (dark blue). The sample sizes for disease | SIRE pairs are as follows: T1D | NHB (cases n = 94 | controls n = 895), T1D | HS (63 | 1152), T1D | NHW (529 | 16840), T2D | NHB (1213 | 895), T2D | HS (813 | 1152), T2D | NHW (6143 | 16840), CKD | NHB (537 | 778), CKD | HS (150 | 1325), CKD | NHW (2930 | 10794). Abbreviations: SIRE self-identified race and ethnicity, SES socioeconomic status, SDoH social determinants of health, NHB non-Hispanic Black, HS Hispanic, NHW non-Hispanic White, T1D type 1 diabetes, T2D type 2 diabetes, CKD chronic kidney disease.
Given the trade-offs with a decrease in sample size and diversity and the ability of the more widely available and simpler SES metrics to largely capture SDoH, we decided to proceed with an analysis in the larger SES Cohort looking at the contributions of area-level SDoH data and the potential gain in predictive power combining individual-level and area-level data (Fig. 4, supplementary data 10). We find that 3-digit zip code-derived data enhanced disease prediction for many traits. Diseases showed variation in whether individual-level or area-level metrics were more predictive. For example, prostate cancer models had better predictions from area-level metrics compared to individual-level metrics. On the other hand, individual-level metrics outperformed area-level metrics for both type 1 and type 2 diabetes. Moreover, combining individual-level SES and area-level data further aided in disease prediction for all traits except Afib and asthma. This complementary signal may be in part due to the limited correlation of individual-level and area-level metrics (Supplementary Fig. 4).
Dot plot showing the mean AUC and corresponding 95% confidence intervals from logistic regression models predicting disease prevalence in the SES-SIRE Cohort. The x-axis is organized by disease. Each dot is color coded by model type. The Base model includes age, age2, and Sex/Gender, visit frequency, and record depth. Additional models are color coded and include SES metrics, Area-level metrics, or both individual-level SES and Area-level metrics (Combined model). Blue stars indicate Bonferroni significance of the Combined model relative to the SES model, and orange stars indicate Bonferroni significance of the Combined model relative to the area-level model, assessed using a two-sided DeLong test. One star indicates nominal significance, two stars indicate Bonferroni corrected significance (p < 9.3 ×10⁻⁴ (0.05/54)), while three stars indicate p < 5 ×10-11. Exact odds ratios and 95% confidence intervals can be found in supplementary data 10. Case sizes for each disease are indicated on the x-axis and case and control sizes are as follows: Afib (cases n = 8220 | controls n = 17,693), asthma (12,314 | 38679), breast cancer (5325 | 73,041), CHD (14,868 | 105,837), CKD (9260 | 31,087), HCL (26,709 | 11,018), prostate cancer (3585 | 6230), T1D (1289 | 42,092), T2D (21,209 | 42,092). The exact p-values for DeLong’s test of significance comparing the Combined model to the SES and Area models are as follows: Afib | SES p = 9.0 ×10⁻²⁰, Afib | Area p = 0.3, asthma | SES p = 0.6, asthma | Area p = 0.2, breast cancer | SES p = 1.9 ×10⁻⁶, breast cancer | Area p = 1.3 ×10⁻¹⁴, CHD | SES p = 2.9 ×10⁻¹⁷, CHD | Area p = 3.8 ×10⁻³⁴, CKD | SES p = 3.9 ×10⁻³⁵, CKD | Area p = 2.5 ×10-45, HCL | SES p = 2.9 ×10⁻⁷, HCL | Area p = 1.4 ×10⁻⁷, prostate cancer | SES p = 1.4 ×10-51, prostate cancer | Area p = 8.0 ×10⁻⁹, T1D | SES p = 0.1, T1D | Area p = 1.0 ×10⁻⁵, T2D | SES p = 1.4 ×10-41, T2D | Area p = 2.1 ×10-222. Abbreviations: SES socioeconomic status, Afib atrial fibrillation, CHD coronary heart disease, CKD chronic kidney disease, HCL hypercholesterolemia, T1D type 1 diabetes, T2D type 2 diabetes
Creation of SDoH domain scores
To create summary SDoH measures which could subsequently be used for disease prediction, we performed Confirmatory Factor Analysis (CFA) to conceptually align survey items with the HP2030 framework. CFA was used to generate a single latent score for four of the five SDoH domains—Health Care Access and Utilization (HCAU), Economic Stability (ES), Social and Community Context (SCC), and Neighborhood and Built Environment (NBE)—using 23 survey items (Fig. 5). Education only had one measure, so it was maintained as an individual-level variable. CFA allows for estimation of “latent” (unobserved) constructs by identifying the weighted combination of observed survey responses that best explains their shared variation. These weights, called factor loadings (λ), are estimated from the covariance structure of the data and are interpreted similar to regression coefficients, where the standardized loadings represent the expected change in standard deviation units for the latent variable (ex: SDoH) given a 1 SD increase in the item (ex: education). This latent variable approach allows for estimation of latent constructs consistent with the HP2030 framework while accounting for measurement error and reducing multicollinearity arising from modest correlations among items within domains (Supplementary Fig. 5). Most SDoH domain models demonstrated good model fit (CFI > 0.95, RMSEA < 0.06, and SRMR < 0.10), except for the overall SDoH model, which had an acceptable CFI of 0.92 and therefore was not carried forward into future disease prediction analyses (supplementary data 11-16)26,27.
CFA models for four SDoH domains identified by HP2030, alongside a higher-order model representing overall social advantage using the whole Individual SDoH Cohort (n = 54,313). Constructs are grouped and color-coded by domain. Gray single-headed arrows indicate standardized factor loadings, pointing left toward the observed variables, which serve as indicators of their respective latent constructs (HP2030 domains). Gray dashed double-headed arrows denote residual correlations, while brown arrows indicate covariances between item errors for closely related constructs.
The latent SDoH construct was most strongly explained by the Economic Stability (ES) domain (factor loading (λ) = 0.93), followed by the HCAU (λ = 0.89) and Social and Community Context (SCC; λ = 0.86) domains. The smaller loading for Education indicates that it shares less variance with the common SDoH factor defined by the multi-item domains, likely reflecting both its measurement as a single observed variable and its conceptual distinctness from more proximal social risk indicators. Within ES, food insecurity emerged as the most prominent indicator (λ = -0.66). For HCAU, key drivers included difficulty affording care (λ = -0.57), concerns about medical costs (λ = -0.59), and delays in receiving care (λ = -0.61; e.g., due to financial constraints, being unable to get off work, or discomfort with the healthcare system). In the SCC domain, perceived stress and loneliness showed the strongest factor loadings (λ = -0.76, λ = -0.74, respectively), followed by everyday discrimination (λ = -0.62). The distributions of these normalized SDoH domains in the direction of increased social risk are available in Supplementary Fig. 6.
Evaluation of the association between SDoH domains vs. component measures with disease prevalence
To assess the utility of latent SDoH domains for predicting disease prevalence, we quantified their associations with nine chronic conditions and compared their predictive performance to that of the corresponding individual survey components. Both individual survey components and latent SDoH domains were Z-score normalized to facilitate direct comparisons, wherein the effect size represents the change in disease liability per one standard-unit increase in the predictor. Overall, latent SDoH constructs demonstrated stronger or comparable associations with disease outcomes compared to individual items, as reflected by median effect sizes across conditions (Supplementary Figs. 7-8). Overlapping confidence intervals suggest that specific components may, in some cases and for some diseases, perform as well or better than their broader domain construct. For example, the individual measure of income as a percentage of the poverty threshold (“percent of poverty threshold”) outperformed the ES construct in predicting T2D, with a larger absolute effect size (1.89 [1.83, 1.95] vs 1.31 [1.28, 1.35] for ES)(Supplementary Fig. 9; supplementary data 17). Moreover, although SCC is not significantly associated with Breast Cancer, “Social Cohesion” and “Social Support” are.
Evaluation of the association between SDoH domains and area-level SDoH measures with disease prevalence
To evaluate the influence of individual- and area-level SDoH on nine chronic conditions, we analyzed estimates from SEMs assessing the associations between SDoH variables and disease prevalence in the Individual SDoH Cohort (Fig. 6). SEM offers key modeling advantages over logistic regression modeling in that it controls for measurement error in the latent domains derived above and takes into account the correlation structure among covariates, which together can reduce estimate bias with complicated real-world data. Estimates obtained from standard logistic regressions are reported in the supplement and are inflated relative to those obtained from SEM (supplementary data 17-20; Supplementary Fig. 10).
A Heatmap displaying the standardized estimates from SEMs on the odds ratio scale assessing the relationship between individual-level SDoH domains and nine chronic conditions in the Individual SDoH Cohort. Only statistically significant associations are annotated with effect sizes. Case and control sizes are as follows: Afib (cases n = 4043 | controls n = 7627), asthma (5560 | 14566), breast cancer (2806 | 31559), CHD (6277 | 46083), CKD (3800 | 13818), HCL (12893 | 4977), prostate cancer (1915 | 3658), T1D (719 | 19939), T2D (8688 | 19939). B Heatmap illustrating the estimates from SEMs evaluating area-level SDoH domains in the SES Cohort. Case and control sizes are as follows: Afib (cases n = 8220 | controls n = 17693), asthma (12314 | 38679), breast cancer (5325 | 73041), CHD (14868 | 105837), CKD (9260 | 31087), HCL (26709 | 11018), prostate cancer (3585 | 6230), T1D (1289 | 42092), T2D (21209 | 42092). For both heatmaps, SDoH variables were run in independent models and values below one indicate that higher levels in a specific SDoH risk are associated with reduced probability of disease. Both heatmaps are on the same scale to facilitate direct comparison between individual-level and area-level SDoH associations, though the order of disease outcomes varies. Abbreviations: SCC social and community context, NBE neighborhood and built environment, ES economic stability, HCAU healthcare access and utilization
Distinct patterns of association emerged at each level, suggesting that individual- and area-level measures capture different aspects of the social environment (Fig. 6). For example, while prostate cancer was inversely associated with individual-level SDoH metrics, this was not true for all area-level measures. Moreover, asthma showed opposite directions of effect between the two levels of measurement
At the individual level, no single domain consistently outperformed the others across all conditions, although ES showed the largest absolute average effect (distance from 1) of 1.12, followed by HCAU and Education with average effects of 1.08 (supplementary data 20). (Fig. 6A). Similarly, across all diseases, the composite area-level deprivation index did not have a stronger magnitude of effect than the more specific indices, with vacant housing showing the strongest and most consistent effects (absolute average: 1.06; Fig. 6B). Averaging across diseases, individual-level predictors had stronger associations with an overall mean effect of 1.08 per SD compared to 1.03 for area-level predictors.
Targeted phenome-wide association study
To determine the potential scope of SDoH-disease analysis in AoU, and thus to illustrate the breadth of analyses for which choice of SDoH measure may impact study results, we conducted a targeted Phenome-Wide Association Study looking at the broader disease groupings of the nine chronic conditions explored in depth above (Supplementary Fig. 11; supplementary data 21). Across all five disease groups and 513 phecodes, approximately 58% of phecodes showed significant associations with at least one SDoH in the Individual SDoH Cohort. The larger SES cohort allowed for the investigation of associations with more traits that meet the case threshold of 100 (N = 621 phecodes; Supplementary Fig. 12; supplementary data 22). In the SES Cohort, 69% of phecodes showed significant associations with at least one SDoH (supplementary data 23). Consistent with the Individual SDoH Cohort, this proportion was lowest for neoplasms (44%), with some inverse associations, and highest for respiratory disorders (83%).
Discussion
This study demonstrates the power and complexity of incorporating individual-level and area-level SDoH into disease risk models using the expansive data from the All of Us Research Program. In particular, we highlight the inherent analytic tension between optimizing sample size and avoiding selection bias vs maximally leveraging the rich, granular SDoH survey data available in this data set (Box 1). We demonstrate that while SDoH data, including less granular SES data, is equivalently or more predictive than SIRE for the nine diseases assessed here, it does not fully explain racial health disparities for a subset of conditions (though for others, effects are fully attenuated). Given the limitations with the individual-level data, we next examined area-level measures and found that they, in many cases, contributed distinct signals that improved disease prediction. To better understand how these individual and area-level factors contribute to disease, we utilized CFA and SEM. These analyses revealed disease-specific social architectures in which both the magnitude and direction of associations of SDoH measures differ by disease. Lastly, we perform a PheWAS to demonstrate the scope of analyses that may be impacted by these SDoH-related analytic choices in AoU.
While AoU offers the richest individual-level SDoH data, and in the largest population, of any national health-related study within the US, to our knowledge, there are still some limitations with this data. Most notably, there is significant non-random missingness (>90% with insufficient EHR and/or SDoH survey completion), which reduces the size and representativeness of the cohort, introduces selection bias, and may limit the generalizability of findings. More specifically, participants who filled out at least 60% of the surveys were more likely to be non-Hispanic, White, older, born in the United States, of higher income and education, and military active duty (past or present). Moreover, proportions of insurance type differed by survey completion, with those insured privately, through the VA or military, or through Medicare more likely to fill out the survey, while those with Medicaid or not insured were less likely. Despite being a major advance in the availability of detailed individual-level SDoH and health data, the subset of participants who filled out these surveys and have linked EHR data with sufficient information is not representative of the US population. Selection bias with respect to socioeconomic status in research studies is common and well-documented32,33. Accordingly, this selection bias should be considered when interpreting findings derived from this (and other) cohorts, with careful attention to how it may shape observed associations, and concerted efforts are needed to make sure that the survey data more closely reflects the demographic composition of the broader U.S. population. However, all population cohorts have their own biases, limitations, and considerations, and ultimately meta-analyses across diverse cohorts, with population-specific considerations, will be needed for gaining robust evidence of how SDoH impacts disease. However, as one of the largest ever NIH-funded studies of the US population, it is important to understand and catalog such issues in the All of Us dataset.
A 2022 review by the National Academies of Sciences, Engineering, and Medicine (NASEM) found that SIRE was included in approximately 30% of pediatric clinical guidelines. In their 2025 report, Rethinking Race and Ethnicity in Biomedical Research, they urge that SIRE should not be used as a proxy for true variables of interest like SDoH34. In the subset of AoU with SDoH survey data, we find that rich individual-level SDoH survey data contribute to disease prediction for all nine conditions tested here, while SIRE does not. Using SDoH data instead of SIRE has three main benefits: it avoids reducing complex racial identities into predetermined categories (which will also inevitably leave out underrepresented groups due to modeling instability with very small group sizes), reduces genetic essentialism (with readers often erroneously equating SIRE with genetic ancestry), and shifts attention toward more proximal, modifiable drivers of disease35. Although these factors are unevenly distributed across racial groups due to historical and ongoing structural inequities, they are not inherently tied to SIRE and are relevant across populations. However, we find that individual-level SDoH in AoU does not fully explain health disparities for a subset of conditions, though it does attenuate SIRE effect sizes. For conditions in which SIRE improves disease prediction accuracy, socioeconomic status alone captures as much of the racial health disparities as the richer individual-level data, and models using SES generally outperform those using SIRE for most conditions. If additional SDoH and environmental variables become available in AoU in the future, we hypothesize they may further attenuate SIRE effect sizes. Indeed, in general, for traits in which SDoH data leads to the largest gain in prediction (>0.05 increase in AUC for prostate cancer, T1D, and T2D), SES captures approximately 75% of this signal. For other traits, such as asthma and Afib, the richer individual-level SDoH data appears to contribute more to disease prediction, highlighting disease-specific trade-offs and analytical considerations.
In considering these analytical trade-offs between sample size, selection bias, and granularity of information, we proceeded with an analysis in a larger and more diverse cohort using SES alone for individual-level data. In addition to these individual-level metrics, AoU offers area-level SDoH data at the 3-digit ZIP code from the American Community Survey. Although this level of aggregation is relatively coarse and may mask heterogeneity within regions, we found that these area-level measures were more predictive than individual-level SES for certain traits, such as Afib and prostate cancer. Moreover, these area measures provided additional signal for other traits with stronger prediction from individual-level SES, such as breast cancer, CHD, CKD, HCL, and T2D. Despite improvement in disease prediction power, one of the major limitations of area-level data is the difficulty in interpreting associations. Associations likely reflect the composition and available resources in the larger area and may reflect regional differences in screening practices or serve as proxies for other factors, such as urbanicity, geography (i.e., higher social deprivation on average in the South), or even segregation. Although this is a major limitation of area-level SDoH analysis in AoU at present and more granular area-level measures may plausibly improve area-level SDoH-disease associations in the future, we intended to highlight considerations for use of the data that currently exists as well as serve as a conceptual framework as more granular data is released36,37.
To better understand how these SDoH contribute to disease, we used CFA to aggregate related individual SDoH measures into latent domains aligned with the Healthy People 2030 framework. This enabled dimensionality reduction while preserving conceptual clarity and enhancing generalizability across cohorts with related measures. This demonstrated that economic stability (ES) and healthcare access and utilization (HCAU) contribute the most strongly to one’s overall social health, although education’s impact may be artificially limited by its reduced number of measures. Alternatively, education may be serving as a more upstream factor to other SDoH38,39. The relative contribution of SDoH domains may vary across geopolitical contexts, and the effects of ES and HCAU may be lower in countries with universal healthcare.
When looking at how SDoH contribute to nine different conditions, ES and HCAU held up as having the overall strongest associations, as well as in the PheWAS. This analysis also revealed that diseases have distinct “social architectures,” with different SDoH domains, measurement levels, and effect magnitudes shaping disease risk within AoU. For instance, CKD and T2D were most strongly associated with economic stability and the percent of poverty threshold, whereas asthma and Afib were more strongly linked to HCAU. Moreover, while prostate cancer was better predicted by area-level measures, associations with individual-level metrics had stronger effect magnitudes for diabetes. In general, individual-level metrics were more predictive than area-level metrics (mean effect of 1.08 vs 1.03).
Using an EHR-based cohort to investigate the effects of SDoH on disease introduces real-world biases that may affect disease capture. Importantly, rather than capturing real disease prevalence, our results reflect associations with observable diagnosis in EHR records, which are affected by SDoH, such as healthcare access, visit frequency, and provider biases, as well as differences in EHR completeness in the data set. Screening biases likely explain the observed associations between individual-level SDoH and breast and prostate cancer, wherein more socially advantaged groups had a higher probability of disease40. Screening biases may also explain the lack of association between many of the SDoH variables and Afib, which may also have a prolonged asymptomatic phase requiring specific screening for diagnosis. These real-world biases and limitations underscore the importance of using traditional population-based research cohorts (as well as cohorts in areas of the world with universal healthcare) with careful study design in their health monitoring to better understand the impact of SDoH on disease (given more uniform screening for diagnoses, such as Afib). Further, while some SDoH, such as educational attainment, are generally stable throughout the adult lifespan after a certain age, others, such as income, may vary, yet AoU currently only offers a single time point for both individual- and area-level metrics. Moreover, the surveys assess adult measures of SDoH; however, childhood and early life measures, while correlated with adult measures, may capture different and earlier SDoH exposures important to the causal framework and may be more important in determining disease risk later in life41.
It is important to note that our findings cannot prove causality, nor was our intent to explore causal pathways between SDoH and disease. Our analyses use disease prevalence rather than incidence due to the low number of incident cases following survey completion in AoU. As a result, we cannot establish temporal ordering in which the exposure precedes the outcome. As incident cases increase in All of Us, future studies should focus on the association of SDoH with incident disease to establish temporal ordering. Additionally, the modeling approaches used in this study assume linear relationships and therefore may not capture nonlinear or threshold effects. Future work should explore more flexible modeling strategies that can better account for such complexities. Moreover, we analyzed associations with prevalent disease, but SDoH may be more strongly associated with stage at diagnosis, treatment quality, hospitalization, and disease outcomes, depending on the disease studied42,43,44,45,46,47. Future research should also investigate the specific pathways through which SDoH mediate disease risk, such as limited access to healthy foods or safe environments for physical activity, health literacy, childhood adversity, chronic stress, and exposure to environmental toxins48,49,50. Further work is also needed on how SDoH can inform care, such as increased training for clinicians, integrating social or community health workers into healthcare systems, or direct intervention on health-related social needs by providers or payers6,51,52,53. Future research should also investigate how SDoH may influence disease risk differentially across populations and prioritize inclusion of diverse participants across SIRE groups54.
In sum, our results highlight key considerations when performing SDoH-related analyses in the widely used AoU data set. We demonstrate different degrees of attrition and selection bias that may be introduced by requiring specific EHR-based or SDoH survey-related measures, impacting external validity and biasing effect estimation. We find that (1) individual-level SES outperforms SIRE in disease prediction and captures most of the signal from more complex individual-level SDoH indices and (2) individual-level and area-level SDoH are weakly correlated, providing complementary information. Thus, incorporation of individual-level SES and area-level SDoH may optimize SDoH-related prediction without introducing excessive selection bias. We also highlight that diseases have unique “social architectures” which may result in heterogeneity across SDoH-related analyses and necessitate disease-specific frameworks. Lastly, our PheWAS demonstrated that many outcomes could likely benefit from the incorporation of SDoH into disease prediction modeling, allowing a shift in focus from group labels and individual behaviors to structural drivers of health25, but that careful consideration of each of the concerns highlighted here is needed for any study on this topic. Ultimately, future studies will need to consider the trade-offs between the richness of individual-level data and the increased representativeness and harmonizability of area-level metrics. Different measures and modeling choices may be appropriate depending on research goals, the trait of interest, and data availability, but assessment for induced selection bias must clearly be reported in all resultant analyses.
Data availability
AoU data is publicly available to authorized researchers through the AoU Researcher Workbench following successful application, training, and agreement to the program’s Data User Code of Conduct and data use policies. Access requires institutional approval and compliance with all AoU data governance procedures. The source data for Figure 1 are provided in Table 1; for Figure 2 in supplementary data 8; for Figure 3 in supplementary data 9; for Figure 4 in supplementary data 10; for Figure 5 in supplementary data 11–16; and for Figure 6 in supplementary data 19.
Code availability
All modeling was performed using All of Us Controlled Tier (V8) data in R (version 4.5.0). Analysis scripts, including disease status algorithms, are publicly available and can be accessedal site https://doi.org/10.5281/zenodo.2031340855
References
Nkoy, F. L. et al. Neighborhood deprivation and childhood asthma outcomes, accounting for insurance coverage. Hosp. Pediatr. 8, 59–67 (2018)
Robinson, L. D., Calmes, D. P. & Bazargan, M. The impact of literacy enhancement on asthma-related outcomes among underserved children. J. Natl. Med. Assoc.100, 892–896 (2008)
Magzamen, S., Patel, B., Davis, A., Edelstein, J. & Tager, I. B. Kickin’ Asthma: school-based asthma education in an urban community. J. Sch. Health78, 655–665 (2008)
Tyris, J., Keller, S. & Parikh, K. Social risk interventions and health care utilization for pediatric asthma: a systematic review and meta-analysis. JAMA Pediatr.176, e215103 (2022)
Teshale, A. B. et al. The role of social determinants of health in cardiovascular diseases: an umbrella review. J. Am. Heart Assoc.12, e029765 (2023)
Brandt, E. J. et al. Assessing and addressing social determinants of cardiovascular health: JACC state-of-the-art review. J. Am. Coll. Cardiol.81, 1368–1385 (2023)
Chan, J. S. K. et al. Associations between social determinants of health and cardiovascular and cancer mortality in cancer survivors: a prospective cohort study. Eur. J. Prev. Cardiol.32, 336–347 (2025)
Gómez, C. A. et al. Addressing health equity and social determinants of health through healthy people 2030. J. Public Health Manag. Pract.27, S249–S257 (2021)
Chen, M., Tan, X. & Padman, R. Social determinants of health in electronic health records and their impact on analysis and risk prediction: A systematic review. J. Am. Med. Inform. Assoc.27, 1764–1773 (2020)
Javed, Z. et al. Race, racism, and cardiovascular health: applying a social determinants of health framework to racial/ethnic disparities in cardiovascular disease. Circ. Cardiovasc. Qual. Outcomes15, e007917 (2022)
Xia, M. et al. Cardiovascular risk associated with social determinants of health at individual and area levels. JAMA Netw. Open7, e248584 (2024)
Committee on the Review of Federal Policies that Contribute to Racial and Ethnic Health Inequities, Board on Population Health and Public Health Practice, Health and Medicine Division & National Academies of Sciences, Engineering, and Medicine. Federal policy to advance racial, ethnic, and tribal health equity. (National Academies Press, 2023). https://doi.org/10.17226/26834
National Academies of Sciences, Engineering, and Medicine; Health and Medicine Division; Board on Population Health and Public Health Practice; Board on Health Care Services; Committee on Unequal Treatment Revisited: The Current State of Racial and Ethnic Disparities in Health Care. Ending unequal treatment: strategies to achieve equitable health care and optimal health for all. (National Academies Press, 2024). https://doi.org/10.17226/27820
Khan, S. S. et al. Development and validation of the American Heart Association’s PREVENT equations. Circulation149, 430–449 (2024)
Davis, V. H., Rodger, L. & Pinto, A. D. Collection and use of social determinants of health data in inpatient general internal medicine wards: a scoping review. J. Gen. Intern. Med.38, 480–489 (2023)
Ganatra, S. et al. Standardizing social determinants of health data: a proposal for a comprehensive screening tool to address health equity a systematic review. Health Aff. Sch.2, qxae151 (2024)
Tesfaye, S. et al. Measuring social determinants of health in the All of Us research program. Sci. Rep.14, 8815 (2024)
All of Us Research Program Investigators et al. The “All of Us” Research Program. N. Engl. J. Med. 381, 668–676 (2019)
Cronin, R. M. et al. Development of the initial surveys for the all of us research program. Epidemiology30, 597–608 (2019)
Brokamp, C. et al. Material community deprivation and hospital utilization during the first year of life: an urban population-based cohort study. Ann. Epidemiol.30, 37–43 (2019)
Hays, R. D. & DiMatteo, M. R. A short-form measure of loneliness. J. Pers. Assess.51, 69–81 (1987)
Krzyzanowski, M. C. et al. The PhenX toolkit: measurement protocols for assessment of social determinants of health. Am. J. Prev. Med.65, 534–542 (2023)
Lennon, N. J. et al. Selection, optimization and validation of ten chronic disease polygenic risk scores for clinical implementation in diverse US populations. Nat. Med.30, 480–487 (2024)
Chapel, J. M., Ritchey, M. D., Zhang, D. & Wang, G. Prevalence and medical costs of chronic diseases among adult Medicaid beneficiaries. Am. J. Prev. Med.53, S143–S154 (2017)
Benavidez, G. A., Zahnd, W. E., Hung, P. & Eberth, J. M. Chronic disease prevalence in the US: sociodemographic and geographic variations by zip code tabulation area. Prev. Chronic Dis.21, E14 (2024)
Hu, L. & Bentler, P. M. Cutoff criteria for fit indexes in covariance structure analysis: conventional criteria versus new alternatives. Struct. Equ. Modeling: A Multidiscip. J.6, 1–55 (1999)
Kline, R. B. Global Fit Testing. in Principles and Practice of Structural Equation Modeling (ed. Kenny, D. A.) 269–278 (The Guilford Press, 2016)
Bastarache, L., Denny, J. C. & Roden, D. M. Phenome-wide association studies. JAMA327, 75–76 (2022)
Ramirez, A. H. et al. The all of us research program: data quality, utility, and diversity. Patterns3, 100570 (2022)
Census Bureau Releases New Educational Attainment Data. https://www.census.gov/newsroom/press-releases/2023/educational-attainment-data.html
Powe, N. R. Race and kidney function: the facts and fix amidst the fuss, fuzziness, and fiction. MED. 3, 93–97 (2022)
Howe, L. D., Tilling, K., Galobardes, B. & Lawlor, D. A. Loss to follow-up in cohort studies: bias in estimates of socioeconomic inequalities. Epidemiology24, 1–9 (2013)
Strandhagen, E. et al. Selection bias in a population survey with registry linkage: potential effect on socioeconomic gradient in cardiovascular risk. Eur. J. Epidemiol.25, 163–172 (2010)
National Academies of Sciences, Engineering, and Medicine. Rethinking Race and Ethnicity in Biomedical Research. Washington, DC: (The National Academies Press, 2025)
Vyas, D. A., Eisenstein, L. G. & Jones, D. S. The race-correction debates – progress, tensions, and future directions. N. Engl. J. Med.393, 1029–1036 (2025)
Gopalakrishnan, C. et al. Evaluation of socioeconomic status indicators for confounding adjustment in observational studies of medication use. Clin. Pharmacol. Ther.105, 1513–1521 (2019)
Goetschius, L. G. et al. Assessing performance of ZCTA-level and Census Tract-level social and environmental risk factors in a model predicting hospital events. Soc. Sci. Med.326, 115943 (2023)
Hahn, R. A. & Truman, B. I. Education improves public health and promotes health equity. Int. J. Health Serv.45, 657–678 (2015)
Zajacova, A. & Lawrence, E. M. The relationship between education and health: reducing disparities through a contextual approach. Annu. Rev. Public Health39, 273–289 (2018)
Welch, H. G., Kramer, B. S. & Black, W. C. Epidemiologic signatures in cancer. N. Engl. J. Med.381, 1378–1386 (2019)
Aris, I. M. et al. Associations of neighborhood opportunity and social vulnerability with trajectories of childhood body mass index and obesity among US children. JAMA Netw. Open5, e2247957 (2022)
Khan, H. et al. Social determinants of health affect disease severity among preschool children with sickle cell disease. Blood Adv.8, 6088–6096 (2024)
Chalfant, V., Riveros, C., Bradfield, S. M. & Stec, A. A. Impact of social disparities on 10 year survival rates in paediatric cancers: a cohort study. Lancet Reg. Health Am.20, 100454 (2023)
Fabregas, J. C. et al. Association of social determinants of health with late diagnosis and survival of patients with pancreatic cancer. J. Gastrointest. Oncol.13, 1204–1214 (2022)
Pinheiro, L. C., Reshetnyak, E., Akinyemiju, T., Phillips, E. & Safford, M. M. Social determinants of health and cancer mortality in the reasons for geographic and racial differences in stroke (REGARDS) cohort study. Cancer128, 122–130 (2022)
Safford, M. M. et al. Number of social determinants of health and fatal and nonfatal incident coronary heart disease in the REGARDS study. Circulation143, 244–253 (2021)
Sterling, M. R. et al. Social Determinants of Health and 90-Day Mortality After Hospitalization for Heart Failure in the REGARDS Study. J. Am. Heart Assoc.9, e014836 (2020)
National Research Council (US), Institute of Medicine (US), Woolf, S. H. & Aron, L. Physical and Social Environmental Factors. (NRC, 2013)
Francis, L., DePriest, K., Wilson, M. & Gross, D. Child poverty, toxic stress, and social determinants of health: screening and care coordination. Online J. Issues Nurs. 23, 3912 (2018)
Nutbeam, D. & Lloyd, J. E. Understanding and responding to health literacy as a social determinant of health. Annu. Rev. Public Health42, 159–173 (2021)
Phillips, J. et al. Integrating the social determinants of health into nursing practice: nurses’ perspectives. J. Nurs. Scholarsh.52, 497–505 (2020)
Yan, A. F. et al. Effectiveness of social needs screening and interventions in clinical settings on utilization, cost, and clinical outcomes: a systematic review. Health Equity6, 454–475 (2022)
Vohra-Gupta, S. et al. A narrative review on shifting practice and policy around social determinants of health (SDOH) screenings: expanding the role of social workers in healthcare settings in the U.S. Healthcare13, 1097 (2025)
Cromer, S. J., Gervis, J. E., Burnett-Bowie, S.-A. M. & Patel, C. J. Heterogeneous associations of socioeconomic status with metabolic disease in racial and ethnic subgroups in the United States: a cross-sectional cohort study in NHANES and All Of Us. medRxiv (2025). https://doi.org/10.64898/2025.12.08.25341847
Micah-r-hysong. micah-r-hysong/SDoH_AoU: SDoH AoU analysis pipeline v1.0.0
Acknowledgements
The authors thank the participants and research teams from the All of Us research program, without whom this research would not have been possible. This research was conducted with support and resources provided by the Odum Institute for Research in Social Science at UNC-Chapel Hill. We would specifically like to thank Chris Wiesen for providing his expertise. We would also like to thank the Polygenic Risk Methods Development (PRIMED) Consortium SDoH Working Group. A list of individuals included in PRIMED consortium banner are at https://primedconsortium.org/publications/banner. We also thank the Diabetes Algorithm contributors: Katie Taylor, Josep Mercader, Alisa Manning, Alicia Huerta-Chagoya, Raymond Kreienkamp, Maheak Vora, Ravi Mandla, Sara Cromer, Kaavya Ashok, Aaron Deutsch.
Funding
Research reported in this publication was supported by the National Institutes of Health for the project “Polygenic Risk Methods Development (PRIMED) Consortium”, with grant funding for study sites D-PRISM (U01HG011723), EPIC-PRS (U01HG011720), CAPE (U01HG011715), and the coordinating center (U01HG011697). The content is solely the responsibility of the authors and does not necessarily represent the official views of the National Institutes of Health. SJC was supported by the American Diabetes Association (7-21-JDFM-005). GLW was supported by the NHGRI (R35HG011944). MG was supported by the National Institute On Aging of the National Institutes of Health (F99AG088695).
Author information
Author notes
These authors contributed equally: Laura M. Raffield, Sara J. Cromer
Authors and Affiliations
Department of Genetics, School of Medicine, University of North Carolina at Chapel Hill, Chapel Hill, NC, USA
Micah R. Hysong & Laura M. Raffield
Broad Diabetes Initiative, Broad Institute, Cambridge, MA, USA
Alisa K. Manning
Department of Medicine, Massachusetts General Hospital, Boston, MA, USA
Alisa K. Manning
Department of Medicine, Harvard Medical School, Boston, MA, USA
Alisa K. Manning
Department of Health, Behavior and Society, Johns Hopkins Bloomberg School of Public Health, Baltimore, MD, USA
Michael D. Green, Jayati Sharma, Genevieve L. Wojcik & Sara J. Cromer
Department of Biomedical Informatics, University of Colorado – Anschutz Medical Campus, Aurora, CO, USA
Iain R. Konigsberg, Luciana B. Vargas & Leslie Lange
Vanderbilt University Medical Center, Nashville, TN, USA
Megan M. Shuey
Department of Population Health Sciences, Duke University School of Medicine, Durham, NC, USA
LáShauntá M. Glover
Odum Institute for Research in Social Science, University of North Carolina, Chapel Hill, NC, USA
Sandra Lee
Diabetes Unit, Massachusetts General Hospital, Boston, MA, USA
Sara J. Cromer
Authors
- Micah R. HysongView author publications
Search author on:PubMed Google Scholar
- Alisa K. ManningView author publications
Search author on:PubMed Google Scholar
- Michael D. GreenView author publications
Search author on:PubMed Google Scholar
- Iain R. KonigsbergView author publications
Search author on:PubMed Google Scholar
- Luciana B. VargasView author publications
Search author on:PubMed Google Scholar
- Jayati SharmaView author publications
Search author on:PubMed Google Scholar
- Leslie LangeView author publications
Search author on:PubMed Google Scholar
- Megan M. ShueyView author publications
Search author on:PubMed Google Scholar
- LáShauntá M. GloverView author publications
Search author on:PubMed Google Scholar
- Genevieve L. WojcikView author publications
Search author on:PubMed Google Scholar
- Sandra LeeView author publications
Search author on:PubMed Google Scholar
- Laura M. RaffieldView author publications
Search author on:PubMed Google Scholar
- Sara J. CromerView author publications
Search author on:PubMed Google Scholar
Consortia
Polygenic Risk Methods Development (PRIMED) Consortium
Contributions
S.J.C. and L.M.R. contributed equally to this work. M.R.H. conducted the data analyses; S.J.C. and L.M.R. supervised the study; M.R.H., S.J.C. and L.M.R. drafted the manuscript; and all authors (M.R.H., A.K.M., M.D.G., I.R.K., L.B.V., J.S., L.L., M.M.S., L.M.G., G.L.W., S.L., L.M.R. and S.J.C.) interpreted the results, contributed expertise, and reviewed, revised, and approved the final version of the manuscript
Ethics declarations
Competing interests
SJC is an ad hoc consultant for Alexion Pharmaceuticals and Patient Square Capital and her spouse works for Depuy-Synthes
Additional information
Publisher’s note Springer Nature remains neutral with regard to jurisdictional claims in published maps and institutional affiliations
Supplementary information
Supplementary information (download PDF )
Supplementary information (download XLSX )
Supplementary information (download PDF )
Supplementary information (download PDF )
Rights and permissions
Open Access This article is licensed under a Creative Commons Attribution-NonCommercial-NoDerivatives 4.0 International License, which permits any non-commercial use, sharing, distribution and reproduction in any medium or format, as long as you give appropriate credit to the original author(s) and the source, provide a link to the Creative Commons licence, and indicate if you modified the licensed material. You do not have permission under this licence to share adapted material derived from this article or parts of it. The images or other third party material in this article are included in the article’s Creative Commons licence, unless indicated otherwise in a credit line to the material. If material is not included in the article’s Creative Commons licence and your intended use is not permitted by statutory regulation or exceeds the permitted use, you will need to obtain permission directly from the copyright holder. To view a copy of this licence, visit http://creativecommons.org/licenses/by-nc-nd/4.0/.
About this article
Cite this article
Hysong, M.R., Manning, A.K., Green, M.D. et al. Practical considerations for social determinant-based disease prediction in the All of Us research program.
Commun. Health1, 17 (2026). https://doi.org/10.1038/s44528-026-00018-1
Received:27 April 2026
Accepted:19 June 2026
Published:06 August 2026
Version of record:06 August 2026
DOI
:https://doi.org/10.1038/s44528-026-00018-1
