


In 2026, we saw teams steadily top the rankings all season long. Four teams never left the top five: Oklahoma, LSU, Alabama, and Florida. Five additional teams never left the top ten: Georgia, Missouri, UCLA, Arkansas, and Michigan. However, this consistency wasn’t the story for all teams. Some teams started the season strong and lost momentum compared to other teams, ending their seasons ranked lower. Other teams started slowly, built from there, and ended their season high in the rankings
In this analysis, we investigate teams that had higher variability throughout the season, whether improving and moving up or sliding down in the rankings. We analyzed this by weekly rankings, starting with Week 2 rankings, since not all teams competed in Week 1. We ended our analysis with Week 12. This analysis did not include postseason results. Although this doesn’t tell the whole story of a season, it captures how teams kept up with their competition throughout the year.
Season’s Slope
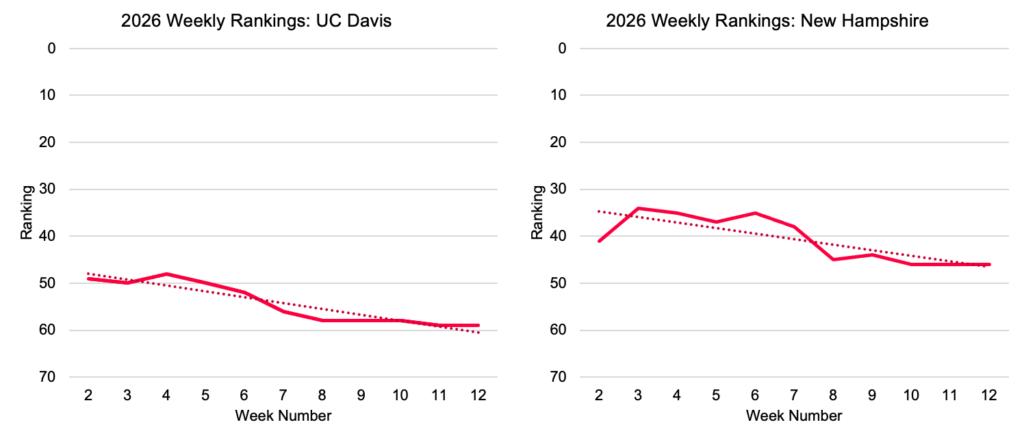
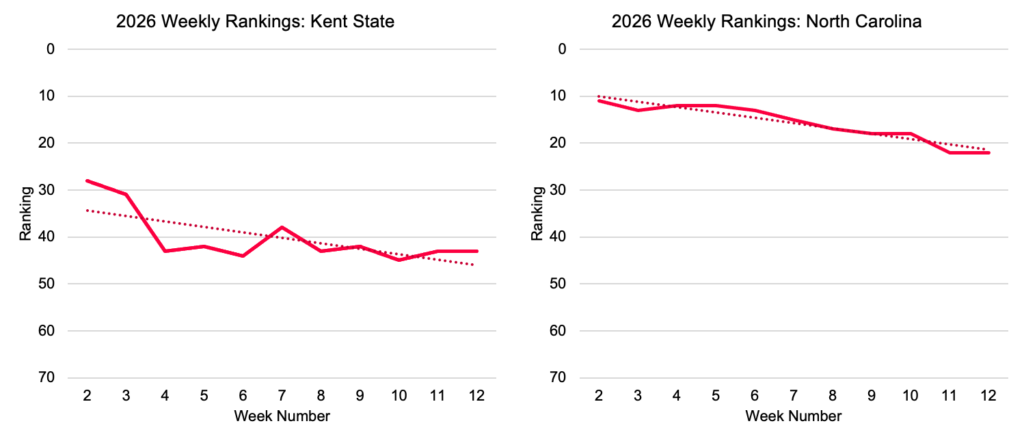
First, we plotted each week’s rank on a chart, which you’ll see below, and added a trend line, which shows the team’s overall direction in the rankings throughout the season. Then, we calculated the slope of each team’s trend line to measure its overall trajectory throughout the regular season.
The slope captures the weekly rankings’ overall direction, which shows if numeric rank increased or decreased, and the rate of change, which shows by how much the numeric rank increased or decreased. It considers every week of the season rather than just comparing a team’s ranking at the beginning and end of the season
In this case, a negative slope means that the team generally improved and moved up in the rankings. A positive slope means that the team generally moved down in the rankings. If a team’s slope is near zero, it means the team’s ranking stayed relatively steady. If a team’s slope is farther from zero, it means the team moved more rapidly through the rankings.
Which Teams Climbed the NCAA Rankings the Most?
Teams with a negative slope improved their rank from the beginning of the season to the end. If a team’s negative slope is larger, it means that they had a bigger improvement in the rankings. For example, California had a slope of -0.68 and improved from being ranked 20th through Week 6 up to 14th by Week 12. Oklahoma had a smaller negative slope of -.08, not because it had a worse season, but because its change in rankings was more slight, improving from 2nd to 1st.
Biggest Climb: Kentucky
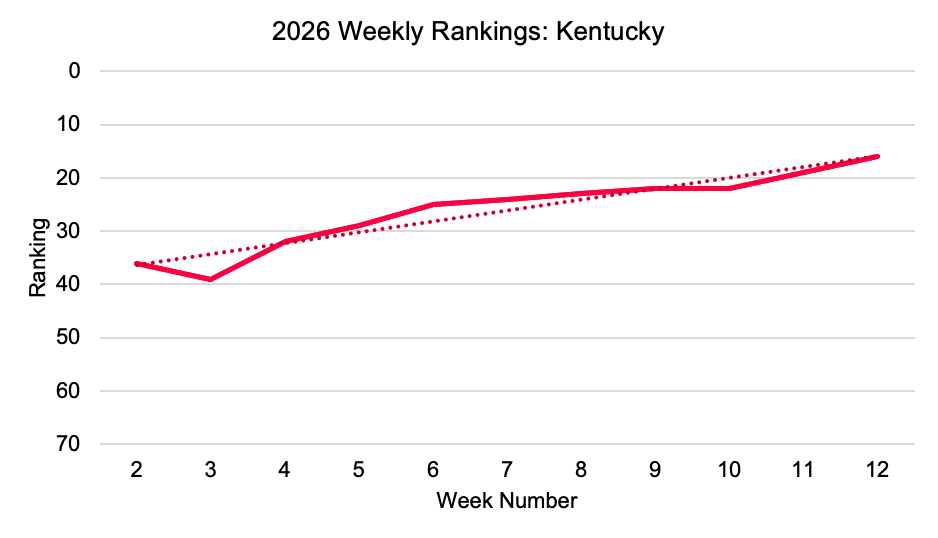
Kentucky had the biggest negative slope, -2.05. They started the season ranked in the high 30s, a huge change from their top-ten season in 2025. However, as the season progressed, Kentucky’s week three rank of 39 was their low, and they finished the regular season ranked 16th. They climbed 23 spots from their lowest ranking in Week 3 to their Week 12 ranking
Biggest Climb Runners-Up: Air Force and LIU
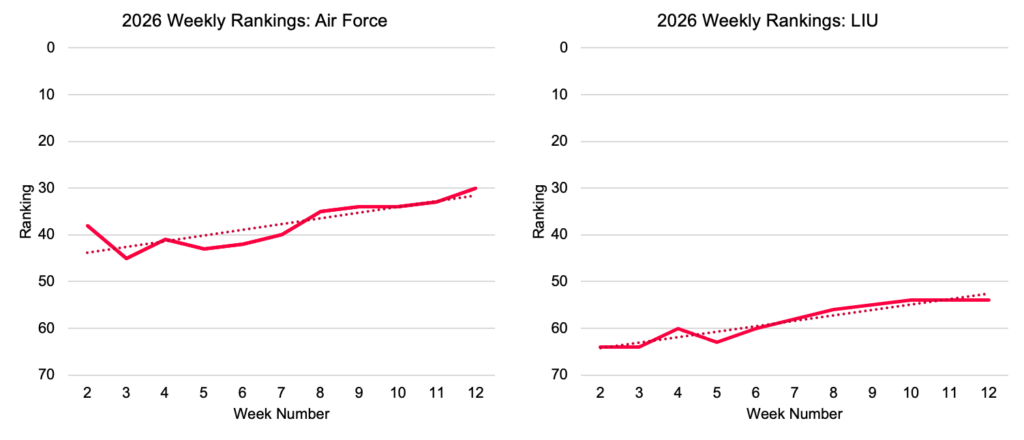
Air Force and LIU had the next-largest negative slopes; they both climbed in the rankings as well but not to the same extent as Kentucky did. Air Force’s lowest rank was 45 in Week 3, and they ended ranked 30th in Week 12. Their slope was -1.22
LIU improved from its low point of 63rd in Weeks 2 and 3 to 54th in Week 12. It had a slightly more moderate slope of -1.16
Which Teams Fell the Most in the Rankings?
On the other hand, teams with a high positive slope moved down in the rankings throughout the season. This doesn’t necessarily mean that the teams’ final rankings were low; it means that they started the season ranked higher than they finished. A bigger slope indicates a larger fall down in the rankings
Biggest Slide: Texas Woman’s
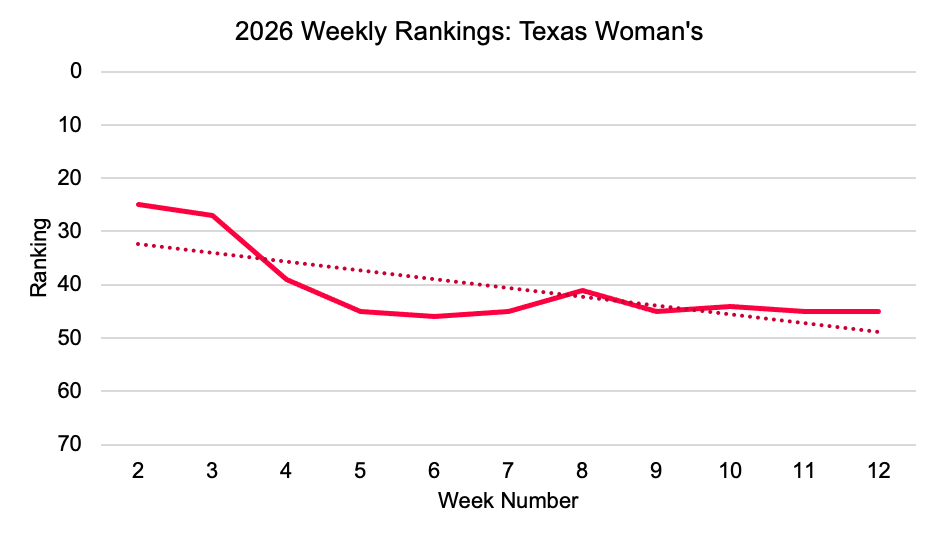
Texas Woman’s started strong, ranked 25th in Week 2, but ended ranked 45th in Week 12. Its slope was 1.65. Its steepest slide came between Weeks 3 and 5, followed by a relatively steady second half of the season.
Biggest Slide Runners-Up: UC Davis, New Hampshire, Kent State, North Carolina
UC Davis had the next-highest slope of 1.25. It had a peak of 48 in Week 4 and slowly slid down to 59th by Week 12. New Hampshire, Kent State, and North Carolina all had similar slopes, between 1.14 and 1.18. North Carolina remained in the Top 15 through Week 7, then dropped to 22nd by Week 12. Kent State was ranked 28th in Week 2 and spent much of the season in the low 40s, finishing Week 12 ranked 43rd. New Hampshire spent much of the first half of the season in the high 30s before finishing in 46th.
Ranking Change: Week 6 to Week 12
Next, we looked at team rankings in Week 6 compared to Week 12. Week 6 captures the first half of the season, while Week 12 captures the entire season. An improvement by Week 12 indicates a very strong second half of the season, while a decline by Week 12 indicates that a team started stronger than it ended
Four teams improved their rank by more than five spots between Week 6 and Week 12: Air Force, Kentucky, California, and LIU. Air Force improved by 12 spots, from 42nd to 30th, while Kentucky improved by 9 spots, and California and LIU each improved by 6 spots
| Team | Week 6 Rank | Week 12 Rank | Change |
| Air Force | 42 | 30 | 12 |
| Kentucky | 25 | 16 | 9 |
| California | 20 | 14 | 6 |
| LIU | 60 | 54 | 6 |
Five teams dropped by more than five spots between Week 6 and Week 12: New Hampshire (11 spots), North Carolina (9), UC Davis (7), Illinois (6), and Nebraska (6)
| Team | Week 6 Rank | Week 12 Rank | Change |
| New Hampshire | 35 | 46 | -11 |
| North Carolina | 13 | 22 | -9 |
| UC Davis | 52 | 59 | -7 |
| Illinois | 36 | 42 | -6 |
| Nebraska | 28 | 34 | -6 |
Measuring Momentum
Based on the slope and the change in rankings from the middle of the season to the end, Kentucky had the most impressive improvement. Kentucky steadily climbed week by week to finish 16th. Itssecond-highest score came in the last dual meet of the season, a 197.225 on March 13th against Florida
Air Force and LIU also had impressive builds over the 2026 season. Air Force finished ranked 30th, up from 54th in 2025. LIU finished 64thin 2025 and 54th in 2026
UC Davis, New Hampshire, and North Carolina had both high slopes and steep falls in the rankings in the second half of the season. However, this doesn’t mean the season was bad overall: North Carolina still managed a top-20 finish, its highest since 2006
Although we measured momentum here by looking at rankings throughout the season, momentum looks different across teams and even within a team throughout a long season. Some teams built throughout the season, figured out lineups, and finished at their best. Others faced injuries, lineup changes, or other challenges that affected their rankings. For teams facing adversity, remaining in-place in the rankings reflects an enormous task of maintaining consistency. A decline in the ranks doesn’t mean that a team didn’t perform their best either; strong scores at the start of a season could remain steady but get bypassed as other teams make improvements. Success comes in different forms, and measuring ranking trajectory is just one output of the larger story that unfolds throughout a season.
READ THIS NEXT:Last Week in College Gym: August 17
