


InfographicsCompanies
Market Size (2026)
USD 1127.0 Mn
Forecast (2036)
USD 4033.7 Mn
CAGR (2026 to 2036)
13.6%
How big is Diabetic-Friendly Bakery Market in 2026?
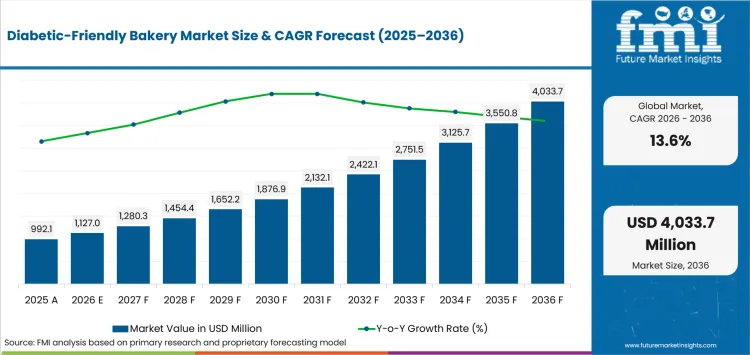
USD 1127.0 million in 2026 and USD 4033.7 million by 2036 at a 13.6% CAGR
Demand for diabetic-friendly bakery is projected to expand at 13.6% CAGR through 2036, increasing valuation from USD 1127.0 million in 2026 to USD 4033.7 million by 2036. Daily bread occasions make low-carb foods commercially relevant because households can repeat familiar purchases several times each week. The CDC estimated in January 2026 that 40.1 million USA residents had diagnosed or undiagnosed diabetes in 2023. The prevalence figure expands nutrition-panel scrutiny, but specialist purchase still depends on familiar taste and acceptable price.
National claim rules affect whether diabetic food positioning can earn mainstream bakery shelf space instead of remaining specialist. The FDA confirmed in February 2025 that the updated healthy claim limits added sugars, sodium and saturated fat for qualifying foods. German and Gulf channels still require different bread cues and local claim wording, so the same formula needs country-specific retail communication
Key Takeaways
- Daily bread and snack occasions support repeated purchasing because households managing carbohydrate exposure still use familiar bakery formats for ordinary meals.
- By product type, classic – original is estimated to hold 39.0% in 2026 owing to familiar taste and routine sandwich use.
- The conventional segment is likely to capture 44.0% share in 2026 attributable to mainstream shelf access without another specialty certification.
- In 2026, fresh is expected to lead format with 30.0% share because shorter replenishment cycles protect softness after reformulation.
- Taste loss and price premiums restrain repeat purchase once reduced-sugar or higher-fiber formulas fall short of mainstream bakery expectations.
- Some of the key players in this market include Flowers Foods, Dr. Schär, Grupo Bimbo, Hero Bread, Warburtons, Lewis Bakeries, Robert Andrew Bakery, and Joseph’s Bakery.
Analyst Perspective
“Diabetic-friendly bakery earns repeat orders after carbohydrate control survives the same texture and price comparison as ordinary bread. The strongest offers make nutrition easy to verify on pack and familiar enough for breakfast or sandwich use without turning the purchase into a medical-food routine.”
– , Principal Consultant, Future Market Insights
How is the diabetic-friendly bakery market segmented?
The diabetic-friendly bakery market is segmented by product type, claim – nature, format, packaging format, sales channel and region
Product type covers classic – original, whole grain or seeded, flavored, snack-sized and premium bakery. Claim – nature includes conventional, clean label, organic, gluten-free and high-protein or fortified products. Format includes fresh, frozen, ambient packaged, chilled and par-baked products. Packaging includes single-serve, multipack, family or loaf packs and bulk foodservice. Sales channels include supermarkets and hypermarkets, specialty bakeries, convenience, online and DTC and foodservice distributors.
Why does conventional lead the claim – nature category?
Conventional positioning lets nutrition-led bakery enter mainstream shelves through the Nutrition Facts panel without another specialty certification. Gluten-free food avoidance alone does not establish glycemic suitability for carb-conscious bread purchases. Grupo Bimbo reported in May 2025 that 95% of its daily-consumption portfolio met its Positive Nutrition standard
- The conventional segment is likely to capture 44.0% share in 2026 attributable to mainstream shelf access and familiar label comparison.
- Mainstream placement widens trial because households can compare sugar and carbohydrate information beside established bread brands during the same grocery trip. The route depends on clear nutrition communication without adding another specialist-store visit to an ordinary bread purchase.
What makes classic – original central to the product type category?
Classic – original bakery products stay inside breakfast and sandwich routines that households already understand. Familiar loaves therefore carry the same softness and sliceability expectations as mainstream bread during lower-carbohydrate reformulation and repeat weekly household use
- Based on product type, classic – original is projected to account for 39.0% in 2026 due to familiar meal use and taste expectations.
- Mainstream meal occasions favor products that lower carbohydrate exposure without asking households to abandon familiar bread formats. Flowers Foods introduced Nature’s Own Life Keto Hot Dog Buns and a Multi-Grain Loaf nationwide in April 2025 with one net carb per serving.
How does fresh hold the lead within the format category?
Fresh bakery exposes softness and crumb changes quickly, so reduced-sugar and alternative-flour formulas face an immediate sensory test at first purchase
- Fresh is set to lead the format category with 30.0% share in 2026 due to replenishment cycles protecting texture after reformulation. Dr. Schär disclosed in February 2025 that it added a sweet and savory bakery line in Spain and enhanced its New Jersey bread-and-roll facility.
- Shorter shelf cycles let dietary fiber and other reformulation changes reach shoppers without requiring the same ambient-life compromise as packaged loaves. Frequent replenishment also exposes weak texture quickly, so operational discipline becomes part of repeat-purchase performance.
Why do supermarkets & hypermarkets lead the sales channel category?
Supermarkets place reformulated loaves beside conventional bread during the same shopping trip. Immediate price and texture comparison raises the listing threshold, but national grocery coverage shortens the distance between first trial and household replenishment
- In 2026, supermarkets & hypermarkets are expected to lead sales channel with 44.0% share because national grocery distribution supports repeat weekly purchasing.
- Retail conversion improves when clear nutrition cues remain visible across both store shelves and online product discovery. Joseph’s Bakery introduced Tumaro’s as a family brand in March 2026 with refreshed packaging and expanded retail and e-commerce support.
What are the drivers, restraints and opportunities in the diabetic-friendly bakery market?
Diabetes-related nutrition management sustains familiar bakery demand, sensory reformulation raises the repurchase threshold and portioned protein or fiber formats widen everyday use
- Driver: Routine bread use turns carbohydrate management into repeated grocery decisions instead of a one-off wellness purchase.
- Restraint: Reformulation can weaken softness or raise unit cost, so improved nutrition does not guarantee repurchase after trial.
- Opportunity: Protein and dietary fiber can widen diabetic-friendly positioning into familiar bakery formats through portion control and everyday meal use.
Routine nutrition management sustains repeat bakery demand
Bread already appears in regular meal planning, so carbohydrate-management guidance can influence frequent grocery decisions instead of occasional wellness purchases. The American Diabetes Association stated in December 2025 that its 2026 Standards include low-carbohydrate eating patterns among evidence-based approaches for preventing type 2 diabetes. Familiar bread therefore competes for repeated meal occasions beside healthy snacks if the reformulated loaf still meets ordinary taste expectations.
Reformulation raises the repurchase threshold
Nutrition changes lose commercial value once an everyday loaf becomes noticeably drier or harder to justify on price. Grupo Bimbo stated in June 2026 that recipe simplification requires research and development to maintain quality, safety and taste for everyday bread. Lower-sugar bakery therefore competes with sugar-free foods on more than the claim because repeat purchase depends on eating quality after reformulation
Portion and protein formats widen everyday use
Smaller packs reduce trial commitment and give households a practical way to control portions without changing the bread occasion. Flowers Foods documented in November 2025 that US small-loaf category units rose 85% during its third quarter. Protein-led bakery and functional food ingredients can use the same pack logic where lower commitment improves first trial and supports weekly replenishment at shelf
Which country CAGRs are profiled in the Diabetic-Friendly Bakery Market?
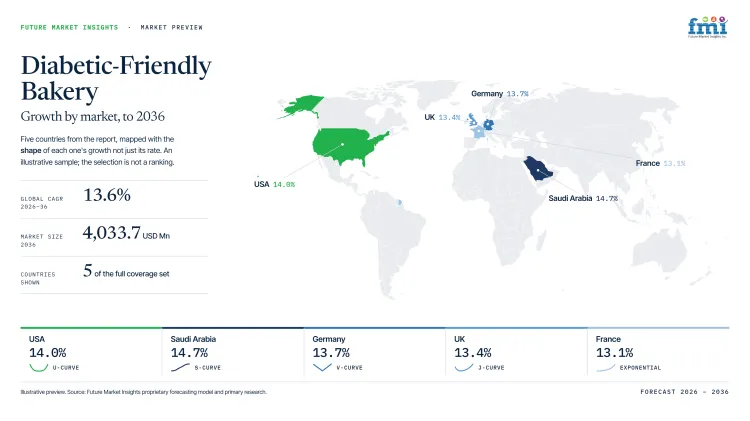
| Country | CAGR |
|---|---|
| UAE | 15.0% |
| Saudi Arabia | 14.7% |
| South Korea | 14.3% |
| USA | 14.0% |
| Germany | 13.7% |
How do country-level CAGRs compare in the Diabetic-Friendly Bakery Market?
The 1.3-point range separates into a Gulf upper pair, South Korea and the USA in the middle, then Germany close behind. The spacing reflects different retail paths from nutrition awareness to a bakery order. Higher CAGR does not imply a larger current market because channel concentration and repurchase economics differ by country
- UAE import dependence makes reliable local stocking critical for premium nutrition-led loaves.
- Saudi bread price expectations tighten premium tolerance for imported specialist nutrition-led bakery.
- Korean convenience retail exposes texture and price feedback within fast-moving product cycles.
- USA GLP-1 diet food competition raises the bakery unit-velocity threshold beyond carbohydrate claims.
- German private-label bread depth limits shelf space for premium nutrition propositions nationally.
Comparable CAGRs still produce different order economics because local channels alter repurchase frequency. The full report provides country-level CAGR analysis across North America, Latin America, Europe, East Asia, South Asia, Oceania and the Middle East and Africa
Country-wise Analysis
- Imported nutrition-led bakery enters a concentrated urban grocery system where Dubai and Abu Dhabi stores can give specialist loaves fast visibility. The UAE diabetic-friendly bakery outlook is anticipated to advance at 15.0% CAGR over the assessment period, attributable to short retail replenishment routes and visible diabetes-prevention activity. MoHAP disclosed in December 2025 that its national screening campaign completed more than 150,000 diabetes tests and linked results with follow-up pathways. Premium import pricing remains a material barrier because prevention activity does not remove the price gap against ordinary bread. Brands with clear nutrition panels and reliable local inventory can convert first trial more efficiently than ranges dependent on irregular imported stock.
- Large urban chains carry high bakery volumes in Saudi Arabia and specialist imported loaves still compete with familiar bread at a lower reference price. GASTAT published 2024 national health data in 2025 showing self-reported diabetes of 28.9% among Saudi women aged 50 to 59. By 2036, Saudi Arabia is projected to grow at 14.7% CAGR, given the sizable nutrition-management need and wider urban grocery access. Distribution outside major cities is less consistent, so national brands face a choice between localized production and a narrower premium footprint. Arabic nutrition communication can improve shelf conversion, but it cannot offset weak availability or an excessive price premium.
- Dense convenience retail gives single-serve nutrition-led bakery a practical trial route without requiring a full specialty loaf purchase. Adoption of diabetic-friendly bakery in South Korea is estimated to expand at 14.3% CAGR through 2036, tied to fast product turnover and health-focused food selection. Smaller formats can fit convenience baskets, but shelf space changes quickly if texture or price misses expectations. The Korea Disease Control and Prevention Agency reported in December 2025 that blood-glucose awareness reached 30.1% in the Community Health Survey. Wider glucose awareness can enlarge the interested audience, though sustained orders still depend on conventional texture and convenience-store pricing.
- Weekly grocery trips in the USA place keto, higher-protein and lower-sugar loaves beside mainstream bread under the same retailer scorecard. The 2025-2030 Dietary Guidelines page updated in January 2026 prioritizes whole nutritious foods and limits added sugars and refined carbohydrates. Diabetic-friendly bakery demand in the USA is forecast to rise at 14.0% CAGR over the forecast period, aided by broad retail testing and familiar sandwich use. National distribution can scale quickly after strong trial velocity proves that a reformulated loaf can sustain repeat weekly purchasing. Retailers also compare new lines with protein and weight-management alternatives, so sustained placement depends on repeat unit velocity instead of a nutrition claim alone.
- For German bread shoppers, grain choice and crumb quality form part of ordinary daily evaluation before a nutrition claim receives attention. Germany is estimated to post 13.7% CAGR over the forecast period, reflecting mature bread habits and broad access to specialty nutrition. A Robert Koch Institute analysis published in September 2025 used an 8.6% baseline prevalence for diagnosed type 2 diabetes in 2022. Health-driven label scrutiny does not remove the penalty for a dry crumb or a large premium over ordinary bread. Growth can translate into broader listings once reformulated loaves match familiar grain profiles and keep the price gap within routine grocery tolerance.
Who are the notable companies in the Diabetic-Friendly Bakery Market?
Flowers Foods, Dr. Schär, Grupo Bimbo, Hero Bread, Warburtons, Lewis Bakeries, Robert Andrew Bakery, and Joseph’s Bakery are the notable companies serving this market
Large bakery groups and low-carb specialists compete on different advantages in manufacturing scale and direct carbohydrate positioning. Texture consistency and credible labeling still govern entry because low-calorie snacks compete for the same health-led spending before bakery earns shelf space
- Flowers Foods, Grupo Bimbo and Warburtons bring national or multinational bakery systems with broad format coverage and established grocery relationships.
- Dr. Schär, Hero Bread and Lewis Bakeries concentrate more directly on special-nutrition or carb-conscious bakery with narrower formulation claims.
- Robert Andrew Bakery and Joseph’s Bakery extend the field through low-carb sourdough and wraps built for familiar meal occasions.
Competitive Benchmarking: Diabetic-Friendly Bakery Market
| Company | Carbohydrate and Nutrition Positioning | Bakery Format Breadth | Retail and Channel Reach | Geographic Reach |
|---|---|---|---|---|
| Flowers Foods | High | High | High | United States |
| Dr. Schär | Medium | High | High | Europe, North America and international markets |
| Grupo Bimbo | Medium | High | High | Global |
| Hero Bread | High | High | Medium | United States |
| Warburtons | Medium | High | High | United Kingdom |
| Lewis Bakeries | High | High | High | United States |
| Robert Andrew Bakery | High | High | Low | United Kingdom |
| Joseph’s Bakery | High | Low | Medium | United States |
Scoring basis: High carbohydrate and nutrition positioning requires several documented lower-carbohydrate or nutrition-led formats, while Medium requires one relevant range and Low indicates limited direct positioning. High format breadth requires three bakery forms, Medium covers two forms and Low covers one documented bakery form. High channel reach requires national distribution, Medium indicates regional or mixed-channel reach and Low indicates narrow availability
Key Developments in the Diabetic-Friendly Bakery Market
- In July 2026, Dr. Schär inaugurated a high-tech pilot plant in Trieste that brings special-nutrition formulation work closer to production-scale validation and machine data.
- In October 2025, Flowers Foods introduced Nature’s Own Life Wheat + Protein as a keto-friendly loaf with 9 grams of net carbs and 22 grams of protein per two-slice serving.
- In March 2025, Hero Bread added the Everything Bagel and later moved its bagel range into everyday availability after the launch gained traction.
Key Players in the Diabetic-Friendly Bakery Market
Mainstream bakery platforms
- Flowers Foods
- Grupo Bimbo
- Warburtons
Carb-conscious and special-nutrition bakery specialists
- Dr. Schär
- Hero Bread
- Lewis Bakeries
Low-carb bakery and wrap specialists
- Robert Andrew Bakery
- Joseph’s Bakery
Diabetic-Friendly Bakery Market – Report Scope
| Coverage field | Report scope |
|---|---|
| Market breakdown | By product type, claim – nature, format, packaging format, sales channel and region. |
| Quantitative Units | USD million. |
| Market Definition | Commercial bakery products positioned for lower sugar, lower carbohydrate, higher fiber, portion control or related nutrition management within the defined diabetic-friendly bakery scope. |
| Regions Covered | North America, Latin America, Europe, East Asia, South Asia and Pacific and Middle East and Africa. |
| Countries Covered | UAE, Saudi Arabia, South Korea, USA, Germany, and 20+ countries included in the full report. |
| Key Companies Profiled | Flowers Foods, Dr. Schär, Grupo Bimbo, Hero Bread, Warburtons, Lewis Bakeries, Robert Andrew Bakery, and Joseph’s Bakery. |
| Forecast Period | 2026 to 2036. |
| Approach | Primary and secondary research with market triangulation. |
Diabetic-Friendly Bakery Market – Research Methodology
| Method | Approach |
|---|---|
| Primary Research | FMI analysts gathered input from manufacturers, service providers, technology developers, distributors, end users, procurement teams, and subject-matter experts. Interviews examined purchasing decisions, product or service evaluation, adoption barriers, approval requirements, pricing considerations, and expectations for technical or commercial support. Respondents were also asked what evidence is required before a trial, pilot, or initial order develops into regular purchasing. |
| Desk Research | Desk research covered government statistics, regulatory publications, trade data, industry associations, technical literature, standards, company filings, product information, and official corporate announcements. Sources were reviewed for relevance, publication date, geographic coverage, and consistency with the defined market scope. Claims relating to performance, applications, approvals, capacity, investment, and commercial activity were retained only when supported by credible public evidence. |
| Market Sizing and Forecasting | The market model combined the baseline value with historical performance, segment structure, pricing and volume indicators, adoption levels, company participation, and country-level demand conditions. Forecast assumptions considered economic activity, investment trends, regulatory developments, technology adoption, purchasing cycles, supply availability, and barriers to wider market use. Segment and regional estimates were reconciled before the final market total was calculated. |
| Data Validation | Estimates were checked against multiple independent indicators, including public data, company activity, trade patterns, industry developments, and findings from primary interviews. Validation also tested whether products, services, applications, and company revenues fell within the defined market boundaries. Adjacent categories, unsupported claims, overlapping revenues, and activities without direct market relevance were excluded to reduce double counting and maintain consistency across segments and countries. |
Diabetic-Friendly Bakery Market by Segments
Diabetic-Friendly Bakery Market segmented by product type:
- Classic – original
- Whole grain or seeded
- Flavored
- Snack-sized
- Premium bakery
Diabetic-Friendly Bakery Market segmented by claim – nature:
- Conventional
- Clean label
- Organic
- Gluten-free
- High-protein or fortified
Diabetic-Friendly Bakery Market segmented by format:
- Fresh
- Frozen
- Ambient packaged
- Chilled
- Par-baked / thaw-and-serve
Diabetic-Friendly Bakery Market segmented by packaging format:
- Single-serve
- Multipack
- Family / loaf pack
- Bulk foodservice
Diabetic-Friendly Bakery Market segmented by sales channel:
- Supermarkets & hypermarkets
- Artisan & specialty bakeries
- Convenience & forecourt
- Online & DTC
- Foodservice distributors
Diabetic-Friendly Bakery Market by Region:
- North America
- USA
- Canada
- Mexico
- Latin America
- Brazil
- Chile
- Rest of Latin America
- Europe
- Germany
- UK
- France
- Italy
- Spain
- Nordics
- BENELUX
- Rest of Europe
- East Asia
- Japan
- South Korea
- South Asia and Pacific
- ASEAN
- Australia & New Zealand
- Rest of South Asia and Pacific
- Middle East and Africa
- Kingdom of Saudi Arabia
- UAE
- Other GCC Countries
- Türkiye
- South Africa
- Other African Union
- Rest of Middle East and Africa
Research
- Centers for Disease Control and Prevention. (2026, January 21). National Diabetes Statistics Report.
- USA Food and Drug Administration. (2025, February 24). FDA finalizes updated “healthy” nutrient content claim.
- Flowers Foods. (2025, April 16). Flowers Foods launches new products and line expansions to meet consumer needs.
- Grupo Bimbo. (2025, May 28). Nutrición positiva, un compromiso de Grupo Bimbo.
- Dr. Schär. (2025, February 19). A record-breaking 2024 for Dr. Schär.
- Joseph’s Bakery. (2026, March 12). Meet Tumaro’s: A new brand in the Joseph’s family.
- American Diabetes Association. (2025, December 8). The American Diabetes Association releases Standards of Care in Diabetes-2026.
- Grupo Bimbo. (2026, June 10). Portfolio free from artificial colors.
- Flowers Foods. (2025, November 6). Flowers Foods – Third quarter 2025 earnings prepared remarks.
- Ministry of Health and Prevention, UAE. (2025, December 30). MoHAP and Merck Gulf showcases results of National Prediabetes and Diabetes Screening campaign at ISPOR Europe 2025 conference.
- General Authority for Statistics. (2025, August 21). Saudi Women’s Statistics Report 2024.
- Korea Disease Control and Prevention Agency. (2025, December 8). 2025 Community Health Survey results.
- USA Department of Agriculture, Food and Nutrition Service. (2026, January 14). Dietary Guidelines for Americans.
- Robert Koch Institute. (2025, September 17). Trends in prevalence and number of cases of diagnosed type 2 diabetes in Germany: Projections until 2050.
- Flowers Foods. (2025, October 27). Flowers Foods taps into higher-protein and sourdough trends with new products.
- Hero Bread. (2025, December). Hero Bread 2026 resolutions.
- Dr. Schär. (2026, July 22). In Trieste (Italy), a new plant to shape the future of nutrition.
- Lewis Bakeries. (n.d.). Our brands. Retrieved August 30, 2026.
- Lewis Bakeries. (n.d.). About us. Retrieved August 30, 2026.
- Warburtons. (n.d.). Health at Warburtons. Retrieved August 30, 2026.
- Flowers Foods. (2025, February 21). Flowers Foods, Inc. completes acquisition of Simple Mills.
- Robert Andrew Bakery. (2025, October 10). Bagels & seeded loaf join low-carb sourdough range.
- Carbonaut. (2025, August 13). Introducing our new gluten free pizzas!.
- PepsiCo. (2025, January 17). PepsiCo completes acquisition of Siete Foods.
- Dr. Schär. (2025, May 8). Always Tastier, Always More Balanced.
- Grupo Bimbo. (2026, May 12). We achieved Positive Nutrition across 98% of our daily consumption portfolio.
- Flowers Foods. (2026, May 21). Flowers Foods, Inc. reports first quarter 2026 results.
- Warburtons. (2026). Packaging redesign unveiled. Retrieved August 30, 2026.
This bibliography is provided for reader reference and is not exhaustive. The full report contains the complete reference list and detailed citations
This Report Answers
- What is the diabetic-friendly bakery market size in 2026 and what value is forecast for 2036?
- Which nutrition conditions support repeat diabetic-friendly bakery demand from 2026 to 2036?
- Why does classic – original hold the leading position within product type during the current base year?
- How does conventional positioning within claim – nature influence mainstream retail access?
- Why does fresh lead the format category where texture remains central to repeat purchase decisions?
- How do the five profiled country CAGRs compare under different retail and nutrition-management conditions through 2036?
- Which companies hold the strongest carb-conscious bakery, special-nutrition and grocery-execution positions in the current field?
- Where do reformulation, taste and price impose the main commercial constraints on new market entrants?
Frequently Asked Questions
How big is the diabetic-friendly bakery market in 2026?
The diabetic-friendly bakery market is valued at USD 1127.0 million in 2026 and is projected to reach USD 4033.7 million by 2036. Familiar lower-carbohydrate bread keeps expansion tied to repeated meals after formulas meet mainstream texture and price expectations
What is the CAGR of the diabetic-friendly bakery market from 2026 to 2036?
The diabetic-friendly bakery market is projected to grow at a CAGR of 13.6% between 2026 and 2036. Expansion depends on reformulated bread matching mainstream taste and price expectations after initial retail trial and household repurchase
Which product type leads the diabetic-friendly bakery market?
The classic – original segment is expected to hold 39.0% of the diabetic-friendly bakery market in 2026, driven by familiar bread use. Existing breakfast and sandwich routines reduce switching friction for reformulated loaves without changing meal preparation
Which claim – nature segment leads the diabetic-friendly bakery market?
The conventional segment is expected to hold 44.0% of the diabetic-friendly bakery market in 2026, attributable to mainstream shelf placement. Nutrition panels let households compare carb-conscious bakery during routine grocery trips without another specialty certification
Which countries are projected to record the highest growth in the diabetic-friendly bakery market?
The UAE is projected to grow at 15.0% CAGR, followed by Saudi Arabia at 14.7% and South Korea at 14.3% through 2036. Concentrated urban retail and visible nutrition management shorten the route from first trial to repeated purchase
Which companies are active in the diabetic-friendly bakery market?
Key companies operating in the diabetic-friendly bakery market include Flowers Foods, Dr. Schär, Grupo Bimbo, Hero Bread, Warburtons, Lewis Bakeries, Robert Andrew Bakery, and Joseph’s Bakery. Their positioning differs by carbohydrate formulation, bakery-format breadth and retail distribution that converts trial into repeat purchase
Preview the report firsthand – request a free sample
Get Sample
Get the brochure for pricing and purchase details
Get PDF
Table of Content
- Key Takeaways
- Market Size and CAGR
- Top Growth Driver
- Fastest Growing Segment
- Leading Region
- Key Companies
- Emerging Opportunities
- Executive Summary
- Global Market Outlook
- Demand-side Trends
- Supply-side Trends
- Technology Roadmap Analysis
- Analysis and Recommendations
- Analyst Perspective (What is happening? Why now? What should investors know?)
- Key Questions Answered
- How large is the market?
- What is the CAGR?
- What are key trends?
- Which region dominates?
- Who are the leaders?
- Market Overview
- Market Coverage / Taxonomy
- Market Definition / Scope / Limitations
- Research Methodology
- Chapter Orientation
- Analytical Lens and Working Hypotheses
- Market Structure, Signals, and Trend Drivers
- Benchmarking and Cross-market Comparability
- Market Sizing, Forecasting, and Opportunity Mapping
- Research Design and Evidence Framework
- Desk Research Programme (Secondary Evidence)
- Expert Input and Fieldwork (Primary Evidence)
- Tooling, Models, and Reference Databases
- Data Engineering and Model Build
- Quality Assurance and Audit Trail
- Market Background
- Market Dynamics (Drivers, Restraints, Opportunity, Trends)
- Scenario Forecast (Optimistic, Likely, Conservative)
- Impact Analysis
- AI Impact
- Sustainability Impact
- Regulatory Impact
- Technology Impact
- Consumer / Buyer Analysis
- Purchase Drivers
- Adoption Barriers
- Buyer Journey
- Opportunity Map Analysis
- Product Life Cycle Analysis
- Supply Chain Analysis
- Investment Feasibility Matrix
- Value Chain Analysis
- PESTLE and Porter’s Analysis
- Regulatory Landscape
- Regional Parent Market Outlook
- Production and Consumption Statistics
- Import and Export Statistics
- Global Market Analysis and Forecast, 2021 to 2036
- Historical Market Size Value (USD Million) Analysis, 2021 to 2025
- Current and Future Market Size Value (USD Million) Projections, 2026 to 2036
- Y-o-Y Growth Trend Analysis
- Absolute $ Opportunity Analysis
- Global Market Pricing Analysis, 2021 to 2036
- Global Market Analysis and Forecast, By Product Type, 2021 to 2036
- Introduction / Key Findings
- Historical Market Size Value (USD Million) Analysis By Product Type, 2021 to 2025
- Current and Future Market Size Value (USD Million) Analysis and Forecast By Product Type, 2026 to 2036
- Classic / original
- Whole grain & seeded
- Flavored & filled
- Mini & snacking formats
- Premium / artisan
- Y-o-Y Growth Trend Analysis By Product Type, 2021 to 2025
- Absolute $ Opportunity Analysis By Product Type, 2026 to 2036
- Global Market Analysis and Forecast, By Claim / Nature, 2021 to 2036
- Introduction / Key Findings
- Historical Market Size Value (USD Million) Analysis By Claim / Nature, 2021 to 2025
- Current and Future Market Size Value (USD Million) Analysis and Forecast By Claim / Nature, 2026 to 2036
- Conventional
- Clean label
- Organic
- Gluten-free
- High-protein / fortified
- Y-o-Y Growth Trend Analysis By Claim / Nature, 2021 to 2025
- Absolute $ Opportunity Analysis By Claim / Nature, 2026 to 2036
- Global Market Analysis and Forecast, By Format, 2021 to 2036
- Introduction / Key Findings
- Historical Market Size Value (USD Million) Analysis By Format, 2021 to 2025
- Current and Future Market Size Value (USD Million) Analysis and Forecast By Format, 2026 to 2036
- Fresh
- Frozen
- Ambient packaged
- Chilled
- Par-baked / thaw-and-serve
- Y-o-Y Growth Trend Analysis By Format, 2021 to 2025
- Absolute $ Opportunity Analysis By Format, 2026 to 2036
- Global Market Analysis and Forecast, By Packaging Format, 2021 to 2036
- Introduction / Key Findings
- Historical Market Size Value (USD Million) Analysis By Packaging Format, 2021 to 2025
- Current and Future Market Size Value (USD Million) Analysis and Forecast By Packaging Format, 2026 to 2036
- Single-serve
- Multipack
- Family / loaf pack
- Bulk foodservice
- Y-o-Y Growth Trend Analysis By Packaging Format, 2021 to 2025
- Absolute $ Opportunity Analysis By Packaging Format, 2026 to 2036
- Global Market Analysis and Forecast, By Sales Channel, 2021 to 2036
- Introduction / Key Findings
- Historical Market Size Value (USD Million) Analysis By Sales Channel, 2021 to 2025
- Current and Future Market Size Value (USD Million) Analysis and Forecast By Sales Channel, 2026 to 2036
- Supermarkets & hypermarkets
- Artisan & specialty bakeries
- Convenience & forecourt
- Online & DTC
- Foodservice distributors
- Y-o-Y Growth Trend Analysis By Sales Channel, 2021 to 2025
- Absolute $ Opportunity Analysis By Sales Channel, 2026 to 2036
- Global Market Analysis and Forecast, By Region, 2021 to 2036
- Introduction
- Historical Market Size Value (USD Million) Analysis By Region, 2021 to 2025
- Current Market Size Value (USD Million) Analysis and Forecast By Region, 2026 to 2036
- North America
- Latin America
- Western Europe
- Eastern Europe
- East Asia
- South Asia and Pacific
- Middle East & Africa
- Market Attractiveness Analysis By Region
- North America Market Analysis and Forecast, By Country, 2021 to 2036
- Historical Market Size Value (USD Million) Trend Analysis By Market Taxonomy, 2021 to 2025
- Market Size Value (USD Million) Forecast By Market Taxonomy, 2026 to 2036
- By Country
- USA
- Canada
- By Product Type
- By Claim / Nature
- By Format
- By Packaging Format
- By Sales Channel
- By Country
- Market Attractiveness Analysis
- By Country
- By Product Type
- By Claim / Nature
- By Format
- By Packaging Format
- By Sales Channel
- Key Takeaways
- Latin America Market Analysis and Forecast, By Country
- Historical Market Size Value (USD Million) Trend Analysis By Market Taxonomy, 2021 to 2025
- Market Size Value (USD Million) Forecast By Market Taxonomy, 2026 to 2036
- By Country
- Brazil
- Mexico
- Chile
- Rest of Latin America
- By Product Type
- By Claim / Nature
- By Format
- By Packaging Format
- By Sales Channel
- By Country
- Market Attractiveness Analysis
- By Country
- By Product Type
- By Claim / Nature
- By Format
- By Packaging Format
- By Sales Channel
- Key Takeaways
- Western Europe Market Analysis and Forecast, By Country
- Historical Market Size Value (USD Million) Trend Analysis By Market Taxonomy, 2021 to 2025
- Market Size Value (USD Million) Forecast By Market Taxonomy, 2026 to 2036
- By Country
- Germany
- UK
- Italy
- Spain
- France
- Nordic
- BENELUX
- Rest of Western Europe
- By Product Type
- By Claim / Nature
- By Format
- By Packaging Format
- By Sales Channel
- By Country
- Market Attractiveness Analysis
- By Country
- By Product Type
- By Claim / Nature
- By Format
- By Packaging Format
- By Sales Channel
- Key Takeaways
- Eastern Europe Market Analysis and Forecast, By Country
- Historical Market Size Value (USD Million) Trend Analysis By Market Taxonomy, 2021 to 2025
- Market Size Value (USD Million) Forecast By Market Taxonomy, 2026 to 2036
- By Country
- Russia
- Poland
- Hungary
- Balkan & Baltic
- Rest of Eastern Europe
- By Product Type
- By Claim / Nature
- By Format
- By Packaging Format
- By Sales Channel
- By Country
- Market Attractiveness Analysis
- By Country
- By Product Type
- By Claim / Nature
- By Format
- By Packaging Format
- By Sales Channel
- Key Takeaways
- East Asia Market Analysis and Forecast, By Country
- Historical Market Size Value (USD Million) Trend Analysis By Market Taxonomy, 2021 to 2025
- Market Size Value (USD Million) Forecast By Market Taxonomy, 2026 to 2036
- By Country
- China
- Japan
- South Korea
- By Product Type
- By Claim / Nature
- By Format
- By Packaging Format
- By Sales Channel
- By Country
- Market Attractiveness Analysis
- By Country
- By Product Type
- By Claim / Nature
- By Format
- By Packaging Format
- By Sales Channel
- Key Takeaways
- South Asia and Pacific Market Analysis and Forecast, By Country
- Historical Market Size Value (USD Million) Trend Analysis By Market Taxonomy, 2021 to 2025
- Market Size Value (USD Million) Forecast By Market Taxonomy, 2026 to 2036
- By Country
- India
- ASEAN
- Australia & New Zealand
- Rest of South Asia and Pacific
- By Product Type
- By Claim / Nature
- By Format
- By Packaging Format
- By Sales Channel
- By Country
- Market Attractiveness Analysis
- By Country
- By Product Type
- By Claim / Nature
- By Format
- By Packaging Format
- By Sales Channel
- Key Takeaways
- Middle East & Africa Market Analysis and Forecast, By Country
- Historical Market Size Value (USD Million) Trend Analysis By Market Taxonomy, 2021 to 2025
- Market Size Value (USD Million) Forecast By Market Taxonomy, 2026 to 2036
- By Country
- Kingdom of Saudi Arabia
- Other GCC Countries
- Türkiye
- South Africa
- Other African Union
- Rest of Middle East & Africa
- By Product Type
- By Claim / Nature
- By Format
- By Packaging Format
- By Sales Channel
- By Country
- Market Attractiveness Analysis
- By Country
- By Product Type
- By Claim / Nature
- By Format
- By Packaging Format
- By Sales Channel
- Key Takeaways
- Key Countries Market Analysis
- USA
- Pricing Analysis
- Market Share Analysis, 2025
- By Product Type
- By Claim / Nature
- By Format
- By Packaging Format
- By Sales Channel
- Canada
- Pricing Analysis
- Market Share Analysis, 2025
- By Product Type
- By Claim / Nature
- By Format
- By Packaging Format
- By Sales Channel
- Mexico
- Pricing Analysis
- Market Share Analysis, 2025
- By Product Type
- By Claim / Nature
- By Format
- By Packaging Format
- By Sales Channel
- Brazil
- Pricing Analysis
- Market Share Analysis, 2025
- By Product Type
- By Claim / Nature
- By Format
- By Packaging Format
- By Sales Channel
- Chile
- Pricing Analysis
- Market Share Analysis, 2025
- By Product Type
- By Claim / Nature
- By Format
- By Packaging Format
- By Sales Channel
- Germany
- Pricing Analysis
- Market Share Analysis, 2025
- By Product Type
- By Claim / Nature
- By Format
- By Packaging Format
- By Sales Channel
- UK
- Pricing Analysis
- Market Share Analysis, 2025
- By Product Type
- By Claim / Nature
- By Format
- By Packaging Format
- By Sales Channel
- Italy
- Pricing Analysis
- Market Share Analysis, 2025
- By Product Type
- By Claim / Nature
- By Format
- By Packaging Format
- By Sales Channel
- Spain
- Pricing Analysis
- Market Share Analysis, 2025
- By Product Type
- By Claim / Nature
- By Format
- By Packaging Format
- By Sales Channel
- France
- Pricing Analysis
- Market Share Analysis, 2025
- By Product Type
- By Claim / Nature
- By Format
- By Packaging Format
- By Sales Channel
- India
- Pricing Analysis
- Market Share Analysis, 2025
- By Product Type
- By Claim / Nature
- By Format
- By Packaging Format
- By Sales Channel
- ASEAN
- Pricing Analysis
- Market Share Analysis, 2025
- By Product Type
- By Claim / Nature
- By Format
- By Packaging Format
- By Sales Channel
- Australia & New Zealand
- Pricing Analysis
- Market Share Analysis, 2025
- By Product Type
- By Claim / Nature
- By Format
- By Packaging Format
- By Sales Channel
- China
- Pricing Analysis
- Market Share Analysis, 2025
- By Product Type
- By Claim / Nature
- By Format
- By Packaging Format
- By Sales Channel
- Japan
- Pricing Analysis
- Market Share Analysis, 2025
- By Product Type
- By Claim / Nature
- By Format
- By Packaging Format
- By Sales Channel
- South Korea
- Pricing Analysis
- Market Share Analysis, 2025
- By Product Type
- By Claim / Nature
- By Format
- By Packaging Format
- By Sales Channel
- Russia
- Pricing Analysis
- Market Share Analysis, 2025
- By Product Type
- By Claim / Nature
- By Format
- By Packaging Format
- By Sales Channel
- Poland
- Pricing Analysis
- Market Share Analysis, 2025
- By Product Type
- By Claim / Nature
- By Format
- By Packaging Format
- By Sales Channel
- Hungary
- Pricing Analysis
- Market Share Analysis, 2025
- By Product Type
- By Claim / Nature
- By Format
- By Packaging Format
- By Sales Channel
- Kingdom of Saudi Arabia
- Pricing Analysis
- Market Share Analysis, 2025
- By Product Type
- By Claim / Nature
- By Format
- By Packaging Format
- By Sales Channel
- Türkiye
- Pricing Analysis
- Market Share Analysis, 2025
- By Product Type
- By Claim / Nature
- By Format
- By Packaging Format
- By Sales Channel
- South Africa
- Pricing Analysis
- Market Share Analysis, 2025
- By Product Type
- By Claim / Nature
- By Format
- By Packaging Format
- By Sales Channel
- USA
- Market Structure Analysis
- Competition Dashboard
- Competition Benchmarking
- Market Share Analysis of Top Players
- By Regional
- By Product Type
- By Claim / Nature
- By Format
- By Packaging Format
- By Sales Channel
- Emerging Startups
- Innovation Benchmarking
- Competition Analysis
- Competition Deep Dive
- Dr. Schar
- Overview
- Product Portfolio
- Profitability by Market Segments
- Sales Footprint
- Strategy Overview
- Marketing Strategy
- Product Strategy
- Channel Strategy
- Flowers Foods
- BFree Foods
- Katz Gluten Free
- Base Culture
- Hero Group
- Genius Foods
- Warburtons
- Simple Mills
- Siete Foods
- Dr. Schar
- Case Studies
- Success Stories
- Recent Developments
- Competition Deep Dive
- Assumptions & Acronyms Used
- Table 1: Global Market Value (USD Million) Forecast by Region, 2021 to 2036
- Table 2: Global Market Value (USD Million) Forecast by Product Type, 2021 to 2036
- Table 3: Global Market Value (USD Million) Forecast by Claim / Nature, 2021 to 2036
- Table 4: Global Market Value (USD Million) Forecast by Format, 2021 to 2036
- Table 5: Global Market Value (USD Million) Forecast by Packaging Format, 2021 to 2036
- Table 6: Global Market Value (USD Million) Forecast by Sales Channel, 2021 to 2036
- Table 7: North America Market Value (USD Million) Forecast by Country, 2021 to 2036
- Table 8: North America Market Value (USD Million) Forecast by Product Type, 2021 to 2036
- Table 9: North America Market Value (USD Million) Forecast by Claim / Nature, 2021 to 2036
- Table 10: North America Market Value (USD Million) Forecast by Format, 2021 to 2036
- Table 11: North America Market Value (USD Million) Forecast by Packaging Format, 2021 to 2036
- Table 12: North America Market Value (USD Million) Forecast by Sales Channel, 2021 to 2036
- Table 13: Latin America Market Value (USD Million) Forecast by Country, 2021 to 2036
- Table 14: Latin America Market Value (USD Million) Forecast by Product Type, 2021 to 2036
- Table 15: Latin America Market Value (USD Million) Forecast by Claim / Nature, 2021 to 2036
- Table 16: Latin America Market Value (USD Million) Forecast by Format, 2021 to 2036
- Table 17: Latin America Market Value (USD Million) Forecast by Packaging Format, 2021 to 2036
- Table 18: Latin America Market Value (USD Million) Forecast by Sales Channel, 2021 to 2036
- Table 19: Western Europe Market Value (USD Million) Forecast by Country, 2021 to 2036
- Table 20: Western Europe Market Value (USD Million) Forecast by Product Type, 2021 to 2036
- Table 21: Western Europe Market Value (USD Million) Forecast by Claim / Nature, 2021 to 2036
- Table 22: Western Europe Market Value (USD Million) Forecast by Format, 2021 to 2036
- Table 23: Western Europe Market Value (USD Million) Forecast by Packaging Format, 2021 to 2036
- Table 24: Western Europe Market Value (USD Million) Forecast by Sales Channel, 2021 to 2036
- Table 25: Eastern Europe Market Value (USD Million) Forecast by Country, 2021 to 2036
- Table 26: Eastern Europe Market Value (USD Million) Forecast by Product Type, 2021 to 2036
- Table 27: Eastern Europe Market Value (USD Million) Forecast by Claim / Nature, 2021 to 2036
- Table 28: Eastern Europe Market Value (USD Million) Forecast by Format, 2021 to 2036
- Table 29: Eastern Europe Market Value (USD Million) Forecast by Packaging Format, 2021 to 2036
- Table 30: Eastern Europe Market Value (USD Million) Forecast by Sales Channel, 2021 to 2036
- Table 31: East Asia Market Value (USD Million) Forecast by Country, 2021 to 2036
- Table 32: East Asia Market Value (USD Million) Forecast by Product Type, 2021 to 2036
- Table 33: East Asia Market Value (USD Million) Forecast by Claim / Nature, 2021 to 2036
- Table 34: East Asia Market Value (USD Million) Forecast by Format, 2021 to 2036
- Table 35: East Asia Market Value (USD Million) Forecast by Packaging Format, 2021 to 2036
- Table 36: East Asia Market Value (USD Million) Forecast by Sales Channel, 2021 to 2036
- Table 37: South Asia and Pacific Market Value (USD Million) Forecast by Country, 2021 to 2036
- Table 38: South Asia and Pacific Market Value (USD Million) Forecast by Product Type, 2021 to 2036
- Table 39: South Asia and Pacific Market Value (USD Million) Forecast by Claim / Nature, 2021 to 2036
- Table 40: South Asia and Pacific Market Value (USD Million) Forecast by Format, 2021 to 2036
- Table 41: South Asia and Pacific Market Value (USD Million) Forecast by Packaging Format, 2021 to 2036
- Table 42: South Asia and Pacific Market Value (USD Million) Forecast by Sales Channel, 2021 to 2036
- Table 43: Middle East & Africa Market Value (USD Million) Forecast by Country, 2021 to 2036
- Table 44: Middle East & Africa Market Value (USD Million) Forecast by Product Type, 2021 to 2036
- Table 45: Middle East & Africa Market Value (USD Million) Forecast by Claim / Nature, 2021 to 2036
- Table 46: Middle East & Africa Market Value (USD Million) Forecast by Format, 2021 to 2036
- Table 47: Middle East & Africa Market Value (USD Million) Forecast by Packaging Format, 2021 to 2036
- Table 48: Middle East & Africa Market Value (USD Million) Forecast by Sales Channel, 2021 to 2036
- Figure 1: Global Market Pricing Analysis
- Figure 2: Global Market Value (USD Million) Forecast 2021-2036
- Figure 3: Global Market Value Share and BPS Analysis by Product Type, 2026 and 2036
- Figure 4: Global Market Y-o-Y Growth Comparison by Product Type, 2026-2036
- Figure 5: Global Market Attractiveness Analysis by Product Type
- Figure 6: Global Market Value Share and BPS Analysis by Claim / Nature, 2026 and 2036
- Figure 7: Global Market Y-o-Y Growth Comparison by Claim / Nature, 2026-2036
- Figure 8: Global Market Attractiveness Analysis by Claim / Nature
- Figure 9: Global Market Value Share and BPS Analysis by Format, 2026 and 2036
- Figure 10: Global Market Y-o-Y Growth Comparison by Format, 2026-2036
- Figure 11: Global Market Attractiveness Analysis by Format
- Figure 12: Global Market Value Share and BPS Analysis by Packaging Format, 2026 and 2036
- Figure 13: Global Market Y-o-Y Growth Comparison by Packaging Format, 2026-2036
- Figure 14: Global Market Attractiveness Analysis by Packaging Format
- Figure 15: Global Market Value Share and BPS Analysis by Sales Channel, 2026 and 2036
- Figure 16: Global Market Y-o-Y Growth Comparison by Sales Channel, 2026-2036
- Figure 17: Global Market Attractiveness Analysis by Sales Channel
- Figure 18: Global Market Value (USD Million) Share and BPS Analysis by Region, 2026 and 2036
- Figure 19: Global Market Y-o-Y Growth Comparison by Region, 2026-2036
- Figure 20: Global Market Attractiveness Analysis by Region
- Figure 21: North America Market Incremental Dollar Opportunity, 2026-2036
- Figure 22: Latin America Market Incremental Dollar Opportunity, 2026-2036
- Figure 23: Western Europe Market Incremental Dollar Opportunity, 2026-2036
- Figure 24: Eastern Europe Market Incremental Dollar Opportunity, 2026-2036
- Figure 25: East Asia Market Incremental Dollar Opportunity, 2026-2036
- Figure 26: South Asia and Pacific Market Incremental Dollar Opportunity, 2026-2036
- Figure 27: Middle East & Africa Market Incremental Dollar Opportunity, 2026-2036
- Figure 28: North America Market Value Share and BPS Analysis by Country, 2026 and 2036
- Figure 29: North America Market Value Share and BPS Analysis by Product Type, 2026 and 2036
- Figure 30: North America Market Y-o-Y Growth Comparison by Product Type, 2026-2036
- Figure 31: North America Market Attractiveness Analysis by Product Type
- Figure 32: North America Market Value Share and BPS Analysis by Claim / Nature, 2026 and 2036
- Figure 33: North America Market Y-o-Y Growth Comparison by Claim / Nature, 2026-2036
- Figure 34: North America Market Attractiveness Analysis by Claim / Nature
- Figure 35: North America Market Value Share and BPS Analysis by Format, 2026 and 2036
- Figure 36: North America Market Y-o-Y Growth Comparison by Format, 2026-2036
- Figure 37: North America Market Attractiveness Analysis by Format
- Figure 38: North America Market Value Share and BPS Analysis by Packaging Format, 2026 and 2036
- Figure 39: North America Market Y-o-Y Growth Comparison by Packaging Format, 2026-2036
- Figure 40: North America Market Attractiveness Analysis by Packaging Format
- Figure 41: North America Market Value Share and BPS Analysis by Sales Channel, 2026 and 2036
- Figure 42: North America Market Y-o-Y Growth Comparison by Sales Channel, 2026-2036
- Figure 43: North America Market Attractiveness Analysis by Sales Channel
- Figure 44: Latin America Market Value Share and BPS Analysis by Country, 2026 and 2036
- Figure 45: Latin America Market Value Share and BPS Analysis by Product Type, 2026 and 2036
- Figure 46: Latin America Market Y-o-Y Growth Comparison by Product Type, 2026-2036
- Figure 47: Latin America Market Attractiveness Analysis by Product Type
- Figure 48: Latin America Market Value Share and BPS Analysis by Claim / Nature, 2026 and 2036
- Figure 49: Latin America Market Y-o-Y Growth Comparison by Claim / Nature, 2026-2036
- Figure 50: Latin America Market Attractiveness Analysis by Claim / Nature
- Figure 51: Latin America Market Value Share and BPS Analysis by Format, 2026 and 2036
- Figure 52: Latin America Market Y-o-Y Growth Comparison by Format, 2026-2036
- Figure 53: Latin America Market Attractiveness Analysis by Format
- Figure 54: Latin America Market Value Share and BPS Analysis by Packaging Format, 2026 and 2036
- Figure 55: Latin America Market Y-o-Y Growth Comparison by Packaging Format, 2026-2036
- Figure 56: Latin America Market Attractiveness Analysis by Packaging Format
- Figure 57: Latin America Market Value Share and BPS Analysis by Sales Channel, 2026 and 2036
- Figure 58: Latin America Market Y-o-Y Growth Comparison by Sales Channel, 2026-2036
- Figure 59: Latin America Market Attractiveness Analysis by Sales Channel
- Figure 60: Western Europe Market Value Share and BPS Analysis by Country, 2026 and 2036
- Figure 61: Western Europe Market Value Share and BPS Analysis by Product Type, 2026 and 2036
- Figure 62: Western Europe Market Y-o-Y Growth Comparison by Product Type, 2026-2036
- Figure 63: Western Europe Market Attractiveness Analysis by Product Type
- Figure 64: Western Europe Market Value Share and BPS Analysis by Claim / Nature, 2026 and 2036
- Figure 65: Western Europe Market Y-o-Y Growth Comparison by Claim / Nature, 2026-2036
- Figure 66: Western Europe Market Attractiveness Analysis by Claim / Nature
- Figure 67: Western Europe Market Value Share and BPS Analysis by Format, 2026 and 2036
- Figure 68: Western Europe Market Y-o-Y Growth Comparison by Format, 2026-2036
- Figure 69: Western Europe Market Attractiveness Analysis by Format
- Figure 70: Western Europe Market Value Share and BPS Analysis by Packaging Format, 2026 and 2036
- Figure 71: Western Europe Market Y-o-Y Growth Comparison by Packaging Format, 2026-2036
- Figure 72: Western Europe Market Attractiveness Analysis by Packaging Format
- Figure 73: Western Europe Market Value Share and BPS Analysis by Sales Channel, 2026 and 2036
- Figure 74: Western Europe Market Y-o-Y Growth Comparison by Sales Channel, 2026-2036
- Figure 75: Western Europe Market Attractiveness Analysis by Sales Channel
- Figure 76: Eastern Europe Market Value Share and BPS Analysis by Country, 2026 and 2036
- Figure 77: Eastern Europe Market Value Share and BPS Analysis by Product Type, 2026 and 2036
- Figure 78: Eastern Europe Market Y-o-Y Growth Comparison by Product Type, 2026-2036
- Figure 79: Eastern Europe Market Attractiveness Analysis by Product Type
- Figure 80: Eastern Europe Market Value Share and BPS Analysis by Claim / Nature, 2026 and 2036
- Figure 81: Eastern Europe Market Y-o-Y Growth Comparison by Claim / Nature, 2026-2036
- Figure 82: Eastern Europe Market Attractiveness Analysis by Claim / Nature
- Figure 83: Eastern Europe Market Value Share and BPS Analysis by Format, 2026 and 2036
- Figure 84: Eastern Europe Market Y-o-Y Growth Comparison by Format, 2026-2036
- Figure 85: Eastern Europe Market Attractiveness Analysis by Format
- Figure 86: Eastern Europe Market Value Share and BPS Analysis by Packaging Format, 2026 and 2036
- Figure 87: Eastern Europe Market Y-o-Y Growth Comparison by Packaging Format, 2026-2036
- Figure 88: Eastern Europe Market Attractiveness Analysis by Packaging Format
- Figure 89: Eastern Europe Market Value Share and BPS Analysis by Sales Channel, 2026 and 2036
- Figure 90: Eastern Europe Market Y-o-Y Growth Comparison by Sales Channel, 2026-2036
- Figure 91: Eastern Europe Market Attractiveness Analysis by Sales Channel
- Figure 92: East Asia Market Value Share and BPS Analysis by Country, 2026 and 2036
- Figure 93: East Asia Market Value Share and BPS Analysis by Product Type, 2026 and 2036
- Figure 94: East Asia Market Y-o-Y Growth Comparison by Product Type, 2026-2036
- Figure 95: East Asia Market Attractiveness Analysis by Product Type
- Figure 96: East Asia Market Value Share and BPS Analysis by Claim / Nature, 2026 and 2036
- Figure 97: East Asia Market Y-o-Y Growth Comparison by Claim / Nature, 2026-2036
- Figure 98: East Asia Market Attractiveness Analysis by Claim / Nature
- Figure 99: East Asia Market Value Share and BPS Analysis by Format, 2026 and 2036
- Figure 100: East Asia Market Y-o-Y Growth Comparison by Format, 2026-2036
- Figure 101: East Asia Market Attractiveness Analysis by Format
- Figure 102: East Asia Market Value Share and BPS Analysis by Packaging Format, 2026 and 2036
- Figure 103: East Asia Market Y-o-Y Growth Comparison by Packaging Format, 2026-2036
- Figure 104: East Asia Market Attractiveness Analysis by Packaging Format
- Figure 105: East Asia Market Value Share and BPS Analysis by Sales Channel, 2026 and 2036
- Figure 106: East Asia Market Y-o-Y Growth Comparison by Sales Channel, 2026-2036
- Figure 107: East Asia Market Attractiveness Analysis by Sales Channel
- Figure 108: South Asia and Pacific Market Value Share and BPS Analysis by Country, 2026 and 2036
- Figure 109: South Asia and Pacific Market Value Share and BPS Analysis by Product Type, 2026 and 2036
- Figure 110: South Asia and Pacific Market Y-o-Y Growth Comparison by Product Type, 2026-2036
- Figure 111: South Asia and Pacific Market Attractiveness Analysis by Product Type
- Figure 112: South Asia and Pacific Market Value Share and BPS Analysis by Claim / Nature, 2026 and 2036
- Figure 113: South Asia and Pacific Market Y-o-Y Growth Comparison by Claim / Nature, 2026-2036
- Figure 114: South Asia and Pacific Market Attractiveness Analysis by Claim / Nature
- Figure 115: South Asia and Pacific Market Value Share and BPS Analysis by Format, 2026 and 2036
- Figure 116: South Asia and Pacific Market Y-o-Y Growth Comparison by Format, 2026-2036
- Figure 117: South Asia and Pacific Market Attractiveness Analysis by Format
- Figure 118: South Asia and Pacific Market Value Share and BPS Analysis by Packaging Format, 2026 and 2036
- Figure 119: South Asia and Pacific Market Y-o-Y Growth Comparison by Packaging Format, 2026-2036
- Figure 120: South Asia and Pacific Market Attractiveness Analysis by Packaging Format
- Figure 121: South Asia and Pacific Market Value Share and BPS Analysis by Sales Channel, 2026 and 2036
- Figure 122: South Asia and Pacific Market Y-o-Y Growth Comparison by Sales Channel, 2026-2036
- Figure 123: South Asia and Pacific Market Attractiveness Analysis by Sales Channel
- Figure 124: Middle East & Africa Market Value Share and BPS Analysis by Country, 2026 and 2036
- Figure 125: Middle East & Africa Market Value Share and BPS Analysis by Product Type, 2026 and 2036
- Figure 126: Middle East & Africa Market Y-o-Y Growth Comparison by Product Type, 2026-2036
- Figure 127: Middle East & Africa Market Attractiveness Analysis by Product Type
- Figure 128: Middle East & Africa Market Value Share and BPS Analysis by Claim / Nature, 2026 and 2036
- Figure 129: Middle East & Africa Market Y-o-Y Growth Comparison by Claim / Nature, 2026-2036
- Figure 130: Middle East & Africa Market Attractiveness Analysis by Claim / Nature
- Figure 131: Middle East & Africa Market Value Share and BPS Analysis by Format, 2026 and 2036
- Figure 132: Middle East & Africa Market Y-o-Y Growth Comparison by Format, 2026-2036
- Figure 133: Middle East & Africa Market Attractiveness Analysis by Format
- Figure 134: Middle East & Africa Market Value Share and BPS Analysis by Packaging Format, 2026 and 2036
- Figure 135: Middle East & Africa Market Y-o-Y Growth Comparison by Packaging Format, 2026-2036
- Figure 136: Middle East & Africa Market Attractiveness Analysis by Packaging Format
- Figure 137: Middle East & Africa Market Value Share and BPS Analysis by Sales Channel, 2026 and 2036
- Figure 138: Middle East & Africa Market Y-o-Y Growth Comparison by Sales Channel, 2026-2036
- Figure 139: Middle East & Africa Market Attractiveness Analysis by Sales Channel
- Figure 140: Global Market – Tier Structure Analysis
- Figure 141: Global Market – Company Share Analysis
