


InfographicsCompanies
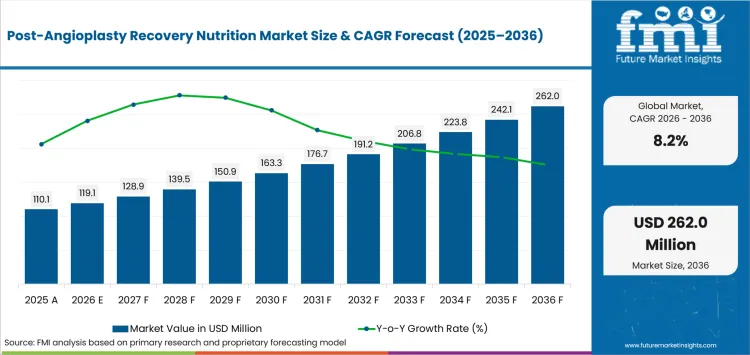
Market Size (2026)
USD 119.1 Mn
Forecast (2036)
USD 262.0 Mn
CAGR (2026 to 2036)
8.2%
How big is Post-Angioplasty Recovery Nutrition Market in 2026?
USD 119.1 million in 2026 and USD 262.0 million by 2036 at an 8.2% CAGR
The post-angioplasty recovery nutrition market is projected to rise from USD 119.1 million in 2026 to USD 262.0 million by 2036 at an 8.2% CAGR. Cardiac rehabilitation gives clinicians an identifiable decision point before households execute most nutrition use after the procedure. In July 2025, Danone completed its majority acquisition of Kate Farms and placed that business beside Nutricia plus related clinical nutrition brands. The transaction expands access from hospital channels toward home use, which strengthens continuity for patients needing structured nutrition after revascularization.
Country-level conversion depends heavily on rehabilitation participation after the intervention and not on the global forecast alone. The British Heart Foundation noted in July 2025 that UK phase III cardiac rehabilitation uptake remained around 50%. That participation gap narrows the addressable specialized nutrition population despite formal eligibility, so commercial execution must follow local referral and fulfillment routes
Key Takeaways
- Discharge-based cardiac rehabilitation gives nutrition providers a defined recommendation window before home recovery becomes less structured for recovering patients.
- Based on product type, cardiac recovery ONS is projected to account for 43.4% in 2026 due to standardized servings that simplify clinical handoff into home recovery.
- In 2026, the 0-30 days post-procedure phase is expected to lead the phase category with 51.0% share because discharge counseling concentrates new nutrition decisions early.
- By product form, prepared meals are forecast to represent 44.6% in 2026 driven by ready-to-heat portions that reduce shopping and cooking burden during early recovery.
- Evidence thresholds and uneven benefit coverage limit routine purchasing when a branded product offers little advantage beyond diet counseling.
- Some of the key players in this market include Abbott, Nestlé Health Science, Danone Nutricia, Mom’s Meals (PurFoods), Step One Foods, ModifyHealth, Fresenius Kabi, and Medtrition.
Analyst Perspective
“Post-angioplasty nutrition becomes commercially durable when clinicians can place it inside the discharge plan without conflicting with sodium limits or ordinary food. Nutrition companies protect repeat revenue by pairing that clinical fit with a replenishment route patients can sustain at home once rehabilitation contact becomes less frequent.”
– , Principal Consultant, Future Market Insights
How is the post-angioplasty recovery nutrition market segmented?
The market is assessed by product type, phase, product form, end user and sales channel
Market taxonomy covers product type, phase, product form, end user, sales channel and region for the 2026-2036 forecast. Product type includes cardiac recovery ONS, low-sodium discharge meal kits, omega-3 and polyphenol support plus other options for recovery nutrition. Phase separates 0-30 days, 1-6 months and long-term secondary prevention while product form covers prepared meals, RTD ONS, supplements and other formats. End users comprise homecare, cardiac rehab centers, hospitals and others while sales channels include hospital pharmacy, retail pharmacy, online, institutional tender and other routes.
What makes Cardiac Recovery ONS central to the Product Type category?
Cardiac recovery ONS gives dietitians a fixed serving that is easier to document than an improvised recovery diet. In May 2026 Abbott launched Ensure Strength Pro with 31 nutrients and 30 grams of protein per 100 grams, extending dense oral nutrition supplements available for structured intake
- Based on product type, cardiac recovery ONS is projected to account for 43.4% in 2026 due to standardized servings that simplify clinical handoff into home recovery.
- Dense formulas remain useful during poor appetite, but clinicians need sodium and sugar profiles that fit the patient’s wider treatment plan during recovery.
Why does 0-30 Days Post-Procedure lead the Phase category?
The first month concentrates medication reconciliation with symptom review and rehabilitation referral, making nutrition instructions unusually actionable. Later phases face more competition from heart-health foods once patients resume shopping and meal preparation
- By phase, the 0-30 days post-procedure segment is estimated to hold 51.0% in 2026 owing to concentrated discharge counseling and rehabilitation referral.
- The American Heart Association stated in February 2025 that outpatient cardiac rehabilitation referral before hospital discharge carries a Class 1 recommendation after acute coronary syndromes. That guidance places nutrition review beside discharge planning while product selection depends on patient-specific diet and tolerance.
How do Prepared Meals anchor the Product Form category?
Prepared meals translate sodium and portion guidance into a meal for patients who cannot shop or cook reliably. In June 2026 Mom’s Meals and Agilix Health launched a pilot for up to 500 Medicare Advantage members pairing home-delivered meals with virtual nutrition care. The model gives therapeutic food delivery a defined continuation route for patients
- The prepared meals segment is likely to capture 44.6% share in 2026 attributable to lower preparation burden during early home recovery.
- Ready-to-heat portions give dietitians a repeatable food format, although menu acceptance and benefit eligibility determine whether an initial order becomes regular use for recovering patients receiving dietetic follow-up.
What supports Homecare in the End User category?
Most eating decisions shift into the household soon after angioplasty, so homecare determines whether a discharge recommendation becomes repeat purchasing. Medical nutrition products need simple storage and clear instructions that fit medication and activity routines at home
- The end user category is forecast to be led by homecare at 49.0% share in 2026 due to most daily nutrition decisions shifting home after discharge.
- AACVPR reported in April 2026 that virtual synchronous cardiac rehabilitation was extended until December 31, 2027 under federal legislation. That continuation preserves a reimbursable remote contact point while products require affordable replenishment once clinical sessions end.
What are the drivers, restraints and opportunities in the Post-Angioplasty Recovery Nutrition Market?
Structured secondary prevention increases nutrition demand while rehabilitation participation and product coverage constrain conversion, leaving home-linked fulfillment as the strongest expansion route
- Driver: Recurrent coronary risk keeps diet review active during follow-up and gives structured nutrition a continuing role inside secondary prevention.
- Restraint: Low rehabilitation participation removes a key recommendation point before patients establish repeat meal and supplement routines at home.
- Opportunity: Hospital-to-home coordination gives clinically selected nutrition products a clearer route into repeat purchasing and documented follow-up.
Recurrent Coronary Risk Sustains Nutrition Review
Secondary prevention remains active because recurrent coronary complications can emerge well beyond the procedure itself. In March 2025 the American College of Cardiology reported that incident heart failure risk following myocardial infarction can be up to sixfold higher than recurrent infarction risk. That risk profile gives dietitians repeated opportunities to review intake during follow-up without implying that every patient needs a branded recovery product
Low Rehabilitation Participation Narrows Conversion
Clinical eligibility does not guarantee cardiac rehabilitation attendance, which removes a key nutrition-review point for many recovering patients. In September 2025 the American Heart Association stated that fewer than 20% of eligible patients participate in cardiac rehabilitation. Transport and scheduling barriers leave nutrition companies dependent on separate outreach or household purchasing instead of a consistent clinical handoff into structured home recovery
Hospital-to-Home Coordination Extends Revenue
Hospital teams preserve continuity when a nutrition recommendation reaches the home without forcing patients to rebuild the plan independently. Medtrition launched its NutriConnect modular-nutrition portfolio in October 2025 for individualized clinical support within documented nutrition protocols. Similar coordination lets medical foods and oral nutrition supplements follow a defined clinical need into replenishment instead of competing as generic heart-health purchases after discharge
Which country CAGRs are profiled in the Post-Angioplasty Recovery Nutrition Market?
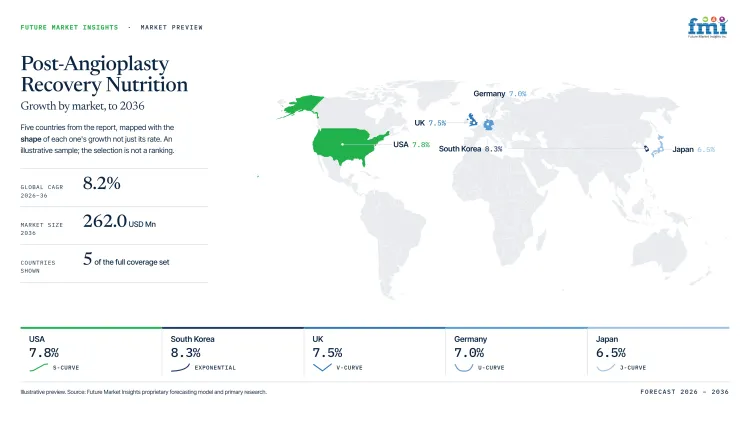
| Country | CAGR |
|---|---|
| South Korea | 8.3% |
| USA | 7.8% |
| UK | 7.5% |
| Germany | 7.0% |
| Japan | 6.5% |
How do country-level CAGRs compare in the Post-Angioplasty Recovery Nutrition Market?
The five profiled CAGRs span 1.8 percentage points from South Korea at 8.3% to Japan at 6.5%. South Korea forms the fastest profile while USA and UK remain closely grouped. Germany and Japan form the slower pair, so local pathway access matters more for entry sequencing than small rate differences
- South Korea ranks first as recurrent coronary burden sustains secondary-prevention counseling after discharge.
- USA follows because automated discharge referrals can improve entry into organized rehabilitation.
- UK growth depends on attendance converting commissioned rehabilitation access into sustained nutrition exposure.
- Germany reflects structured rehabilitation access and patient cost rules shaping outpatient continuation.
- Japan grows more slowly as clinician endorsement and local diet fit govern adoption.
Similar rates conceal different purchasing routes and benefit structures for commercial nutrition programs. The full report provides country-level CAGR analysis across North America, Latin America, Europe, East Asia, South Asia and Pacific and Middle East and Africa
Country-wise Analysis
- South Korean hospitals manage substantial recurrent coronary disease, so recovery nutrition must fit secondary-prevention counseling and familiar household eating patterns following discharge. Demand for post-angioplasty recovery nutrition in South Korea is projected to grow at 8.3% CAGR through 2036 because hospital follow-up can extend diet review into home recovery. Korea Disease Control and Prevention Agency data released in December 2025 counted 34,768 myocardial infarction events during 2023. That disease burden keeps prevention work active during follow-up for older cardiac patients leaving hospital care. Culturally adapted meals and disciplined claims remain necessary before specialized nutrition becomes routine beside established Korean diets and rehabilitation advice.
- USA hospital systems increasingly place cardiac rehabilitation referrals inside electronic discharge workflows, giving dietitians a defined point to recommend structured nutrition following angioplasty. The American College of Cardiology noted in December 2025 that referral rates among Medicare beneficiaries remained below 25%. Low referral leaves many eligible patients outside organized follow-up, and nutrition reimbursement requires a separate benefit route beyond counseling. Demand for post-angioplasty recovery nutrition in USA is forecast to rise at 7.8% CAGR through 2036 aided by payer-linked rehabilitation. Companies gain the clearest route to repeat purchasing if discharge recommendations lead directly into covered home replenishment through USA oral nutrition channels.
- UK cardiac rehabilitation operates through commissioned service pathways, so nutrition exposure depends on actual programme entry following coronary intervention. The March 2026 National Audit of Cardiac Rehabilitation Quality and Outcomes Report recorded England acute coronary syndrome uptake at 44.5%. Post-angioplasty recovery nutrition demand in the UK is anticipated to advance at 7.5% CAGR through 2036 owing to formal rehabilitation access. Uneven participation leaves many eligible patients outside structured dietetic follow-up, which limits routine exposure for branded nutrition. Commercial offers fit best when they reinforce NHS diet guidance and practical home recovery without displacing ordinary food or existing rehabilitation services locally.
- German post-angioplasty recovery often moves from acute hospital treatment into structured rehabilitation, giving institutional diet standards unusual influence during early recovery. Germany is estimated to record 7.0% CAGR through 2036 given its rehabilitation infrastructure and established outpatient pathways. Deutsche Rentenversicherung stated in October 2025 that immediate post-hospital inpatient rehabilitation carries copay obligations for no more than 14 days, while outpatient rehabilitation has no copay. Branded meals and oral nutrition need their own continuation route because rehabilitation coverage does not automatically reimburse a product. Outpatient follow-up therefore offers a more practical commercial channel for sustained nutrition use once formal rehabilitation ends.
- Japanese cardiac rehabilitation relies on multidisciplinary clinical teams, so recovery nutrition gains credibility through portions and sodium profiles that fit familiar eating patterns. The Japanese Association of Cardiac Rehabilitation documented 689 candidates in its July 2025 specialist instructor examination, including six registered dietitians among a broad clinical group. Post-angioplasty recovery nutrition sales in Japan are forecast to expand at 6.5% CAGR by 2036 reflecting clinician-led adoption. Imported formats face friction if serving sizes or instructions feel detached from local meals and rehabilitation practice. Companies entering Japan need stronger professional alignment than firms relying mainly on consumer convenience in other profiled markets.
Who are the notable companies in the Post-Angioplasty Recovery Nutrition Market?
Abbott, Nestlé Health Science, Danone Nutricia, Mom’s Meals (PurFoods), Step One Foods, ModifyHealth, Fresenius Kabi and Medtrition are the notable companies profiled in this market
Clinical formulas, prepared meals and modular nutrition reach post-angioplasty patients through different care channels. Abbott, Nestlé Health Science and Danone Nutricia bring broad hospital-linked portfolios while Mom’s Meals and ModifyHealth use payer-supported home delivery. Fresenius Kabi brings enteral nutrition into specialist channels, while entry barriers depend on clinical fit and reliable home fulfillment
- Broad clinical nutrition platforms include Abbott and Fresenius Kabi, with adult formulas plus organized-care reach. Nestlé Health Science and Danone Nutricia bring medical nutrition portfolios, while Fresenius Kabi’s parenteral nutrition expertise raises technical expectations.
- Mom’s Meals (PurFoods) and ModifyHealth use payer-linked meals plus dietitian support to carry chronic-condition nutrition into home settings following clinical referral.
- Cardiometabolic and modular specialists include Step One Foods and Medtrition with narrower portfolios for defined clinical needs. Medtrition also serves wound-healing nutrition with documented modular protocols for clinical use.
Competitive Benchmarking: Post-Angioplasty Recovery Nutrition Market
| Company | Nutrition Format Breadth | Cardiometabolic Specificity | Provider/Payer Access | Geographic Reach |
|---|---|---|---|---|
| Abbott | Medium | High | Medium | Global |
| Nestlé Health Science | High | High | Medium | Global |
| Danone Nutricia | High | High | High | Global |
| Mom’s Meals (PurFoods) | High | High | High | United States |
| Step One Foods | Low | High | Medium | United States |
| ModifyHealth | Medium | High | High | United States |
| Fresenius Kabi | High | Low | Medium | Global |
| Medtrition | Medium | Low | Medium | United States |
High nutrition-format breadth requires three verified routes while Medium requires two and Low identifies one documented route. High cardiometabolic specificity requires multiple heart or metabolic programs while Medium requires one such program. Low identifies a broader clinical focus without a cardiometabolic-specific program in official evidence. High provider or payer access requires multiple organized-care channels while Medium requires one documented route and Low would indicate direct-purchase access only.
Key Developments in the Post-Angioplasty Recovery Nutrition Market
- In November 2025, Nestlé Health Science began a BOOST collaboration with the American Diabetes Association focused on diabetes detection and adult nutrition education.
- In September 2025, ModifyHealth expanded in-network partnerships with major insurers for nationwide dietitian support beside condition-specific medically tailored meals serving chronic conditions including heart disease.
- In January 2025, Fresenius Kabi renewed its ESICM collaboration covering clinical-nutrition research awards plus professional education and international fellowships.
Key Players in the Post-Angioplasty Recovery Nutrition Market
Clinical Nutrition Platforms
- Abbott
- Nestlé Health Science
- Danone Nutricia
Home-Based Food and Cardiometabolic Programs
- Mom’s Meals (PurFoods)
- Step One Foods
- ModifyHealth
Specialist Clinical Nutrition Suppliers
- Fresenius Kabi
- Medtrition
Post-Angioplasty Recovery Nutrition Market – Report Scope
| Coverage field | Report scope |
|---|---|
| Market breakdown | By product type, phase, product form, end user, sales channel and region. |
| Quantitative Units | USD million. |
| Market Definition | Commercial nutrition products and meal programs used to support dietary recovery after angioplasty within secondary-prevention and rehabilitation pathways. |
| Regions Covered | North America, Latin America, Western Europe, Eastern Europe, East Asia, South Asia and Pacific, Middle East and Africa. |
| Countries Covered | South Korea, USA, UK, Germany, Japan, and 20+ countries included in the full report. |
| Key Companies Profiled | Abbott, Nestlé Health Science, Danone Nutricia, Mom’s Meals (PurFoods), Step One Foods, ModifyHealth, Fresenius Kabi, Medtrition. |
| Forecast Period | 2026 to 2036. |
| Approach | Primary and secondary research with market triangulation. |
Post-Angioplasty Recovery Nutrition Market – Research Methodology
| Method | Approach |
|---|---|
| Primary Research | FMI analysts gathered input from manufacturers, service providers, technology developers, distributors, end users, procurement teams, and subject-matter experts. Interviews examined purchasing decisions, product or service evaluation, adoption barriers, approval requirements, pricing considerations, and expectations for technical or commercial support. Respondents were also asked what evidence is required before a trial, pilot, or initial order develops into regular purchasing. |
| Desk Research | Desk research covered government statistics, regulatory publications, trade data, industry associations, technical literature, standards, company filings, product information, and official corporate announcements. Sources were reviewed for relevance, publication date, geographic coverage, and consistency with the defined market scope. Claims relating to performance, applications, approvals, capacity, investment, and commercial activity were retained only when supported by credible public evidence. |
| Market Sizing and Forecasting | The market model combined the baseline value with historical performance, segment structure, pricing and volume indicators, adoption levels, company participation, and country-level demand conditions. Forecast assumptions considered economic activity, investment trends, regulatory developments, technology adoption, purchasing cycles, supply availability, and barriers to wider market use. Segment and regional estimates were reconciled before the final market total was calculated. |
| Data Validation | Estimates were checked against multiple independent indicators, including public data, company activity, trade patterns, industry developments, and findings from primary interviews. Validation also tested whether products, services, applications, and company revenues fell within the defined market boundaries. Adjacent categories, unsupported claims, overlapping revenues, and activities without direct market relevance were excluded to reduce double counting and maintain consistency across segments and countries. |
Post-Angioplasty Recovery Nutrition Market by Segments
Post-Angioplasty Recovery Nutrition Market segmented by Product Type:
- Cardiac Recovery ONS
- Low-Sodium Discharge Meal Kits
- Omega-3 & Polyphenol Support
- Others
Post-Angioplasty Recovery Nutrition Market segmented by Phase:
- 0-30 Days Post-Procedure
- 1-6 Months
- Long-Term Secondary Prevention
Post-Angioplasty Recovery Nutrition Market segmented by Product Form:
- Prepared Meals
- RTD ONS
- Supplements
- Others
Post-Angioplasty Recovery Nutrition Market segmented by End User:
- Homecare
- Cardiac Rehab Centers
- Hospitals
- Others
Post-Angioplasty Recovery Nutrition Market segmented by Sales Channel:
- Hospital Pharmacy
- Retail Pharmacy
- Online
- Institutional Tender
- Others
Post-Angioplasty Recovery Nutrition Market by Region:
- North America
- United States
- Canada
- Latin America
- Brazil
- Mexico
- Argentina
- Chile
- Western Europe
- Germany
- France
- United Kingdom
- Italy
- Spain
- Benelux
- Nordics
- Eastern Europe
- Poland
- Czech Republic
- Romania
- Hungary
- East Asia
- China
- Japan
- South Korea
- South Asia and Pacific
- India
- ASEAN
- Australia and New Zealand
- Middle East and Africa
- GCC Countries
- South Africa
- Türkiye
- Israel
Research
- Danone. (2025, July 1). Danone completes the acquisition of Kate Farms, enhancing its USA specialized nutrition offerings.
- British Heart Foundation. (2025, July 11). Cardiac rehab: Poster on wards boost uptake.
- Abbott. (2026, May 13). Abbott launches Ensure Strength Pro in India to support healthy ageing.
- American Heart Association. (2025, February 27). ACC, AHA Issue New Acute Coronary Syndromes Guideline.
- Mom’s Meals. (2026, June 18). Mom’s Meals and Agilix Health Collaborate to Advance Food as Medicine.
- Brown, T. (2026, April 21). JCRP Line-Up: March/April 2026.
- American College of Cardiology. (2025, March 1). Journal Wrap | CVD Polypill, Digital Twins, More.
- American Heart Association. (2025, September 22). Psychological distress common after a heart attack, may lead to future heart conditions.
- Medtrition. (2025, October 27). MEDTRITION®, INC. LAUNCHES NUTRICONNECT™ – A PORTFOLIO BRAND FOR PERSONALIZED MODULAR NUTRITION.
- Korea Disease Control and Prevention Agency. (2025, December 30).
- American College of Cardiology. (2025, December 1). Feature | Maximizing Recovery: Cardiac Rehab in Contemporary CV Care.
- National Audit of Cardiac Rehabilitation. (2026, March). Quality and Outcomes Report 2025.
- Deutsche Rentenversicherung. (2025, October 1). Zuzahlung bei Rehabilitation.
- Japanese Association of Cardiac Rehabilitation. (2025, July 21).
- Nestlé Health Science. (2025, November 20). BOOST® Nutritional Drinks Teams Up with the American Diabetes Association® to Promote Early Detection of Diabetes and Highlight the Importance of Nutrition for Adults.
- ModifyHealth. (2025, September 4). ModifyHealth Expands Its In-Network Coverage, Strengthening Its Position as One of the Nation’s Largest Providers of Insurance-Covered Virtual Dietitian Support.
- Fresenius Kabi. (2025, January 29). Fresenius Kabi and ESICM Renew Joint Collaboration for 2025.
- Abbott. (2025, November 13). Abbott Launches New and Advanced Ensure Diabetes Care, A Clinically Proven Formula to Help Manage Blood Sugar.
- Nestlé Health Science. (2025, October 27). Nestlé Health Science and University of California, Davis Innovation Institute for Food & Health Announce Strategic Partnership to Accelerate Innovation in Nutrition and Health Science.
- Danone. (2025, June 25). Danone further invests in gut health and next-generation biotic research with the acquisition of The Akkermansia Company.
- Klodas, E. (2026, April 18). Bringing Something Savory to Step One Foods – The Right Way.
- ModifyHealth. (2025, July 1). ModifyHealth and Monash University Expand Partnership to Advance Low-FODMAP Diet Awareness in the USA
- Medtrition. (2025, July 9). PRESS RELEASE: EXPEDITE GRAPE PRODUCT LAUNCH.
- Kate Farms. (2026, July 28). Kate Farms Expands High Protein Nutrition Shake Into Walmart and CVS as Retail Distribution Grows Sevenfold.
- Fresenius Kabi. (2025, June 26). New R&D center in India strengthens Fresenius Kabi’s innovation network.
- Nestlé Health Science. (2025, October 17). Nestlé Health Science and the Food & Nutrition Innovation Institute at the Friedman School at Tufts University Expand Opportunities to Advance Nutrition Science and Innovation.
- Danone. (2025, September 29). Danone Inaugurates its OneBiome Laboratory in Paris-Saclay, Strengthening its Investment in Science-Driven Gut Health innovation.
- Fresenius Kabi. (2025, September 15). JUMPstart Clinical Nutrition Award winner announced at ESPEN congress.
- Kate Farms. (2025, July 8). Kate Farms unveils new High Protein Nutrition Shake: Protein with purpose, built for real change.
- Umoja Health. (2026, August 4). New Partnership Brings Medically Tailored Meals and Grocery Boxes to Eligible Medicaid Members in Oswego County.
This bibliography is provided for reader reference and is not exhaustive. The full report contains the complete reference list and detailed citations
This Report Answers
- What are the 2026 and 2036 values for the post-angioplasty recovery nutrition market?
- Which discharge conditions support demand for structured nutrition after angioplasty?
- Why does cardiac recovery ONS lead the product type category?
- Why does the 0-30 days post-procedure phase lead the phase category?
- Why do prepared meals lead the product form category?
- How do country growth profiles differ across South Korea, USA, UK, Germany and Japan?
- Which companies serve clinical nutrition, prepared-meal and cardiometabolic recovery routes?
- What limits conversion from rehabilitation guidance into paid nutrition purchasing?
- How can homecare extend a discharge recommendation into repeat nutrition use?
Frequently Asked Questions
How big is the Post-Angioplasty Recovery Nutrition Market in 2026?
The post-angioplasty recovery nutrition market is valued at USD 119.1 million in 2026 and is projected to reach USD 262.0 million by 2036. Growth is driven by discharge-linked secondary prevention and greater use of structured nutrition during home recovery
What is the CAGR of the Post-Angioplasty Recovery Nutrition Market from 2026 to 2036?
The post-angioplasty recovery nutrition market is projected to grow at a CAGR of 8.2% between 2026 and 2036. Expansion is supported by structured rehabilitation referrals plus continued nutrition use once patients return home
Which product type leads the Post-Angioplasty Recovery Nutrition Market?
The cardiac recovery ONS segment is expected to hold 43.4% of the post-angioplasty recovery nutrition market in 2026, driven by standardized serving control during early recovery. Defined portions give dietitians a clearer handoff and let patients continue documented intake at home following discharge
Which phase leads the Post-Angioplasty Recovery Nutrition Market?
The 0-30 days post-procedure segment is expected to hold 51.0% of the post-angioplasty recovery nutrition market in 2026, attributable to concentrated discharge counseling and early rehabilitation decisions. Clinician contact is densest during this period and gives nutrition recommendations a clearer route into home recovery
Which countries are projected to record the highest growth in the Post-Angioplasty Recovery Nutrition Market?
South Korea is projected to grow at 8.3% CAGR, followed by USA at 7.8% and UK at 7.5% through 2036. These country rates in the post-angioplasty recovery nutrition market reflect different rehabilitation participation and discharge-follow-up conditions
Which companies are active in the Post-Angioplasty Recovery Nutrition Market?
Key companies operating in the post-angioplasty recovery nutrition market include Abbott, Nestlé Health Science, Danone Nutricia, Mom’s Meals (PurFoods), Step One Foods, ModifyHealth, Fresenius Kabi and Medtrition. Their positions span clinical formulas, payer-linked meals and cardiometabolic foods with distinct healthcare and home-delivery routes
Preview the report firsthand – request a free sample
Get Sample
Get the brochure for pricing and purchase details
Get PDF
Table of Content
- Key Takeaways
- Market Size and CAGR
- Top Growth Driver
- Fastest Growing Segment
- Leading Region
- Key Companies
- Emerging Opportunities
- Executive Summary
- Global Market Outlook
- Demand-side Trends
- Supply-side Trends
- Technology Roadmap Analysis
- Analysis and Recommendations
- Analyst Perspective (What is happening? Why now? What should investors know?)
- Key Questions Answered
- How large is the market?
- What is the CAGR?
- What are key trends?
- Which region dominates?
- Who are the leaders?
- Market Overview
- Market Coverage / Taxonomy
- Market Definition / Scope / Limitations
- Research Methodology
- Chapter Orientation
- Analytical Lens and Working Hypotheses
- Market Structure, Signals, and Trend Drivers
- Benchmarking and Cross-market Comparability
- Market Sizing, Forecasting, and Opportunity Mapping
- Research Design and Evidence Framework
- Desk Research Programme (Secondary Evidence)
- Expert Input and Fieldwork (Primary Evidence)
- Tooling, Models, and Reference Databases
- Data Engineering and Model Build
- Quality Assurance and Audit Trail
- Market Background
- Market Dynamics (Drivers, Restraints, Opportunity, Trends)
- Scenario Forecast (Optimistic, Likely, Conservative)
- Impact Analysis
- AI Impact
- Sustainability Impact
- Regulatory Impact
- Technology Impact
- Consumer / Buyer Analysis
- Purchase Drivers
- Adoption Barriers
- Buyer Journey
- Opportunity Map Analysis
- Product Life Cycle Analysis
- Supply Chain Analysis
- Investment Feasibility Matrix
- Value Chain Analysis
- PESTLE and Porter’s Analysis
- Regulatory Landscape
- Regional Parent Market Outlook
- Production and Consumption Statistics
- Import and Export Statistics
- Global Market Analysis and Forecast, 2021 to 2036
- Historical Market Size Value (USD Million) Analysis, 2021 to 2025
- Current and Future Market Size Value (USD Million) Projections, 2026 to 2036
- Y-o-Y Growth Trend Analysis
- Absolute $ Opportunity Analysis
- Global Market Pricing Analysis, 2021 to 2036
- Global Market Analysis and Forecast, By Product Type, 2021 to 2036
- Introduction / Key Findings
- Historical Market Size Value (USD Million) Analysis By Product Type, 2021 to 2025
- Current and Future Market Size Value (USD Million) Analysis and Forecast By Product Type, 2026 to 2036
- Cardiac Recovery ONS
- Low-Sodium Discharge Meal Kits
- Omega-3 & Polyphenol Support
- Others
- Y-o-Y Growth Trend Analysis By Product Type, 2021 to 2025
- Absolute $ Opportunity Analysis By Product Type, 2026 to 2036
- Global Market Analysis and Forecast, By Phase, 2021 to 2036
- Introduction / Key Findings
- Historical Market Size Value (USD Million) Analysis By Phase, 2021 to 2025
- Current and Future Market Size Value (USD Million) Analysis and Forecast By Phase, 2026 to 2036
- 0-30 Days Post-Procedure
- 1-6 Months
- Long-Term Secondary Prevention
- Y-o-Y Growth Trend Analysis By Phase, 2021 to 2025
- Absolute $ Opportunity Analysis By Phase, 2026 to 2036
- Global Market Analysis and Forecast, By Product Form, 2021 to 2036
- Introduction / Key Findings
- Historical Market Size Value (USD Million) Analysis By Product Form, 2021 to 2025
- Current and Future Market Size Value (USD Million) Analysis and Forecast By Product Form, 2026 to 2036
- Prepared Meals
- RTD ONS
- Supplements
- Others
- Y-o-Y Growth Trend Analysis By Product Form, 2021 to 2025
- Absolute $ Opportunity Analysis By Product Form, 2026 to 2036
- Global Market Analysis and Forecast, By End User, 2021 to 2036
- Introduction / Key Findings
- Historical Market Size Value (USD Million) Analysis By End User, 2021 to 2025
- Current and Future Market Size Value (USD Million) Analysis and Forecast By End User, 2026 to 2036
- Homecare
- Cardiac Rehab Centers
- Hospitals
- Others
- Y-o-Y Growth Trend Analysis By End User, 2021 to 2025
- Absolute $ Opportunity Analysis By End User, 2026 to 2036
- Global Market Analysis and Forecast, By Sales Channel, 2021 to 2036
- Introduction / Key Findings
- Historical Market Size Value (USD Million) Analysis By Sales Channel, 2021 to 2025
- Current and Future Market Size Value (USD Million) Analysis and Forecast By Sales Channel, 2026 to 2036
- Hospital Pharmacy
- Retail Pharmacy
- Online
- Institutional Tender
- Others
- Y-o-Y Growth Trend Analysis By Sales Channel, 2021 to 2025
- Absolute $ Opportunity Analysis By Sales Channel, 2026 to 2036
- Global Market Analysis and Forecast, By Region, 2021 to 2036
- Introduction
- Historical Market Size Value (USD Million) Analysis By Region, 2021 to 2025
- Current Market Size Value (USD Million) Analysis and Forecast By Region, 2026 to 2036
- North America
- Latin America
- Western Europe
- Eastern Europe
- East Asia
- South Asia and Pacific
- Middle East & Africa
- Market Attractiveness Analysis By Region
- North America Market Analysis and Forecast, By Country, 2021 to 2036
- Historical Market Size Value (USD Million) Trend Analysis By Market Taxonomy, 2021 to 2025
- Market Size Value (USD Million) Forecast By Market Taxonomy, 2026 to 2036
- By Country
- USA
- Canada
- By Product Type
- By Phase
- By Product Form
- By End User
- By Sales Channel
- By Country
- Market Attractiveness Analysis
- By Country
- By Product Type
- By Phase
- By Product Form
- By End User
- By Sales Channel
- Key Takeaways
- Latin America Market Analysis and Forecast, By Country
- Historical Market Size Value (USD Million) Trend Analysis By Market Taxonomy, 2021 to 2025
- Market Size Value (USD Million) Forecast By Market Taxonomy, 2026 to 2036
- By Country
- Brazil
- Mexico
- Chile
- Rest of Latin America
- By Product Type
- By Phase
- By Product Form
- By End User
- By Sales Channel
- By Country
- Market Attractiveness Analysis
- By Country
- By Product Type
- By Phase
- By Product Form
- By End User
- By Sales Channel
- Key Takeaways
- Western Europe Market Analysis and Forecast, By Country
- Historical Market Size Value (USD Million) Trend Analysis By Market Taxonomy, 2021 to 2025
- Market Size Value (USD Million) Forecast By Market Taxonomy, 2026 to 2036
- By Country
- Germany
- UK
- Italy
- Spain
- France
- Nordic
- BENELUX
- Rest of Western Europe
- By Product Type
- By Phase
- By Product Form
- By End User
- By Sales Channel
- By Country
- Market Attractiveness Analysis
- By Country
- By Product Type
- By Phase
- By Product Form
- By End User
- By Sales Channel
- Key Takeaways
- Eastern Europe Market Analysis and Forecast, By Country
- Historical Market Size Value (USD Million) Trend Analysis By Market Taxonomy, 2021 to 2025
- Market Size Value (USD Million) Forecast By Market Taxonomy, 2026 to 2036
- By Country
- Russia
- Poland
- Hungary
- Balkan & Baltic
- Rest of Eastern Europe
- By Product Type
- By Phase
- By Product Form
- By End User
- By Sales Channel
- By Country
- Market Attractiveness Analysis
- By Country
- By Product Type
- By Phase
- By Product Form
- By End User
- By Sales Channel
- Key Takeaways
- East Asia Market Analysis and Forecast, By Country
- Historical Market Size Value (USD Million) Trend Analysis By Market Taxonomy, 2021 to 2025
- Market Size Value (USD Million) Forecast By Market Taxonomy, 2026 to 2036
- By Country
- China
- Japan
- South Korea
- By Product Type
- By Phase
- By Product Form
- By End User
- By Sales Channel
- By Country
- Market Attractiveness Analysis
- By Country
- By Product Type
- By Phase
- By Product Form
- By End User
- By Sales Channel
- Key Takeaways
- South Asia and Pacific Market Analysis and Forecast, By Country
- Historical Market Size Value (USD Million) Trend Analysis By Market Taxonomy, 2021 to 2025
- Market Size Value (USD Million) Forecast By Market Taxonomy, 2026 to 2036
- By Country
- India
- ASEAN
- Australia & New Zealand
- Rest of South Asia and Pacific
- By Product Type
- By Phase
- By Product Form
- By End User
- By Sales Channel
- By Country
- Market Attractiveness Analysis
- By Country
- By Product Type
- By Phase
- By Product Form
- By End User
- By Sales Channel
- Key Takeaways
- Middle East & Africa Market Analysis and Forecast, By Country
- Historical Market Size Value (USD Million) Trend Analysis By Market Taxonomy, 2021 to 2025
- Market Size Value (USD Million) Forecast By Market Taxonomy, 2026 to 2036
- By Country
- Kingdom of Saudi Arabia
- Other GCC Countries
- Türkiye
- South Africa
- Other African Union
- Rest of Middle East & Africa
- By Product Type
- By Phase
- By Product Form
- By End User
- By Sales Channel
- By Country
- Market Attractiveness Analysis
- By Country
- By Product Type
- By Phase
- By Product Form
- By End User
- By Sales Channel
- Key Takeaways
- Key Countries Market Analysis
- USA
- Pricing Analysis
- Market Share Analysis, 2025
- By Product Type
- By Phase
- By Product Form
- By End User
- By Sales Channel
- Canada
- Pricing Analysis
- Market Share Analysis, 2025
- By Product Type
- By Phase
- By Product Form
- By End User
- By Sales Channel
- Mexico
- Pricing Analysis
- Market Share Analysis, 2025
- By Product Type
- By Phase
- By Product Form
- By End User
- By Sales Channel
- Brazil
- Pricing Analysis
- Market Share Analysis, 2025
- By Product Type
- By Phase
- By Product Form
- By End User
- By Sales Channel
- Chile
- Pricing Analysis
- Market Share Analysis, 2025
- By Product Type
- By Phase
- By Product Form
- By End User
- By Sales Channel
- Germany
- Pricing Analysis
- Market Share Analysis, 2025
- By Product Type
- By Phase
- By Product Form
- By End User
- By Sales Channel
- UK
- Pricing Analysis
- Market Share Analysis, 2025
- By Product Type
- By Phase
- By Product Form
- By End User
- By Sales Channel
- Italy
- Pricing Analysis
- Market Share Analysis, 2025
- By Product Type
- By Phase
- By Product Form
- By End User
- By Sales Channel
- Spain
- Pricing Analysis
- Market Share Analysis, 2025
- By Product Type
- By Phase
- By Product Form
- By End User
- By Sales Channel
- France
- Pricing Analysis
- Market Share Analysis, 2025
- By Product Type
- By Phase
- By Product Form
- By End User
- By Sales Channel
- India
- Pricing Analysis
- Market Share Analysis, 2025
- By Product Type
- By Phase
- By Product Form
- By End User
- By Sales Channel
- ASEAN
- Pricing Analysis
- Market Share Analysis, 2025
- By Product Type
- By Phase
- By Product Form
- By End User
- By Sales Channel
- Australia & New Zealand
- Pricing Analysis
- Market Share Analysis, 2025
- By Product Type
- By Phase
- By Product Form
- By End User
- By Sales Channel
- China
- Pricing Analysis
- Market Share Analysis, 2025
- By Product Type
- By Phase
- By Product Form
- By End User
- By Sales Channel
- Japan
- Pricing Analysis
- Market Share Analysis, 2025
- By Product Type
- By Phase
- By Product Form
- By End User
- By Sales Channel
- South Korea
- Pricing Analysis
- Market Share Analysis, 2025
- By Product Type
- By Phase
- By Product Form
- By End User
- By Sales Channel
- Russia
- Pricing Analysis
- Market Share Analysis, 2025
- By Product Type
- By Phase
- By Product Form
- By End User
- By Sales Channel
- Poland
- Pricing Analysis
- Market Share Analysis, 2025
- By Product Type
- By Phase
- By Product Form
- By End User
- By Sales Channel
- Hungary
- Pricing Analysis
- Market Share Analysis, 2025
- By Product Type
- By Phase
- By Product Form
- By End User
- By Sales Channel
- Kingdom of Saudi Arabia
- Pricing Analysis
- Market Share Analysis, 2025
- By Product Type
- By Phase
- By Product Form
- By End User
- By Sales Channel
- Türkiye
- Pricing Analysis
- Market Share Analysis, 2025
- By Product Type
- By Phase
- By Product Form
- By End User
- By Sales Channel
- South Africa
- Pricing Analysis
- Market Share Analysis, 2025
- By Product Type
- By Phase
- By Product Form
- By End User
- By Sales Channel
- USA
- Market Structure Analysis
- Competition Dashboard
- Competition Benchmarking
- Market Share Analysis of Top Players
- By Regional
- By Product Type
- By Phase
- By Product Form
- By End User
- By Sales Channel
- Emerging Startups
- Innovation Benchmarking
- Competition Analysis
- Competition Deep Dive
- Abbott
- Overview
- Product Portfolio
- Profitability by Market Segments
- Sales Footprint
- Strategy Overview
- Marketing Strategy
- Product Strategy
- Channel Strategy
- Nestle Health Science
- Danone Nutricia
- Mom’s Meals (PurFoods)
- Step One Foods
- Nordic Naturals
- Medtrition
- Victus
- Abbott
- Case Studies
- Success Stories
- Recent Developments
- Competition Deep Dive
- Assumptions & Acronyms Used
- Table 1: Global Market Value (USD Million) Forecast by Region, 2021 to 2036
- Table 2: Global Market Value (USD Million) Forecast by Product Type, 2021 to 2036
- Table 3: Global Market Value (USD Million) Forecast by Phase, 2021 to 2036
- Table 4: Global Market Value (USD Million) Forecast by Product Form, 2021 to 2036
- Table 5: Global Market Value (USD Million) Forecast by End User, 2021 to 2036
- Table 6: Global Market Value (USD Million) Forecast by Sales Channel, 2021 to 2036
- Table 7: North America Market Value (USD Million) Forecast by Country, 2021 to 2036
- Table 8: North America Market Value (USD Million) Forecast by Product Type, 2021 to 2036
- Table 9: North America Market Value (USD Million) Forecast by Phase, 2021 to 2036
- Table 10: North America Market Value (USD Million) Forecast by Product Form, 2021 to 2036
- Table 11: North America Market Value (USD Million) Forecast by End User, 2021 to 2036
- Table 12: North America Market Value (USD Million) Forecast by Sales Channel, 2021 to 2036
- Table 13: Latin America Market Value (USD Million) Forecast by Country, 2021 to 2036
- Table 14: Latin America Market Value (USD Million) Forecast by Product Type, 2021 to 2036
- Table 15: Latin America Market Value (USD Million) Forecast by Phase, 2021 to 2036
- Table 16: Latin America Market Value (USD Million) Forecast by Product Form, 2021 to 2036
- Table 17: Latin America Market Value (USD Million) Forecast by End User, 2021 to 2036
- Table 18: Latin America Market Value (USD Million) Forecast by Sales Channel, 2021 to 2036
- Table 19: Western Europe Market Value (USD Million) Forecast by Country, 2021 to 2036
- Table 20: Western Europe Market Value (USD Million) Forecast by Product Type, 2021 to 2036
- Table 21: Western Europe Market Value (USD Million) Forecast by Phase, 2021 to 2036
- Table 22: Western Europe Market Value (USD Million) Forecast by Product Form, 2021 to 2036
- Table 23: Western Europe Market Value (USD Million) Forecast by End User, 2021 to 2036
- Table 24: Western Europe Market Value (USD Million) Forecast by Sales Channel, 2021 to 2036
- Table 25: Eastern Europe Market Value (USD Million) Forecast by Country, 2021 to 2036
- Table 26: Eastern Europe Market Value (USD Million) Forecast by Product Type, 2021 to 2036
- Table 27: Eastern Europe Market Value (USD Million) Forecast by Phase, 2021 to 2036
- Table 28: Eastern Europe Market Value (USD Million) Forecast by Product Form, 2021 to 2036
- Table 29: Eastern Europe Market Value (USD Million) Forecast by End User, 2021 to 2036
- Table 30: Eastern Europe Market Value (USD Million) Forecast by Sales Channel, 2021 to 2036
- Table 31: East Asia Market Value (USD Million) Forecast by Country, 2021 to 2036
- Table 32: East Asia Market Value (USD Million) Forecast by Product Type, 2021 to 2036
- Table 33: East Asia Market Value (USD Million) Forecast by Phase, 2021 to 2036
- Table 34: East Asia Market Value (USD Million) Forecast by Product Form, 2021 to 2036
- Table 35: East Asia Market Value (USD Million) Forecast by End User, 2021 to 2036
- Table 36: East Asia Market Value (USD Million) Forecast by Sales Channel, 2021 to 2036
- Table 37: South Asia and Pacific Market Value (USD Million) Forecast by Country, 2021 to 2036
- Table 38: South Asia and Pacific Market Value (USD Million) Forecast by Product Type, 2021 to 2036
- Table 39: South Asia and Pacific Market Value (USD Million) Forecast by Phase, 2021 to 2036
- Table 40: South Asia and Pacific Market Value (USD Million) Forecast by Product Form, 2021 to 2036
- Table 41: South Asia and Pacific Market Value (USD Million) Forecast by End User, 2021 to 2036
- Table 42: South Asia and Pacific Market Value (USD Million) Forecast by Sales Channel, 2021 to 2036
- Table 43: Middle East & Africa Market Value (USD Million) Forecast by Country, 2021 to 2036
- Table 44: Middle East & Africa Market Value (USD Million) Forecast by Product Type, 2021 to 2036
- Table 45: Middle East & Africa Market Value (USD Million) Forecast by Phase, 2021 to 2036
- Table 46: Middle East & Africa Market Value (USD Million) Forecast by Product Form, 2021 to 2036
- Table 47: Middle East & Africa Market Value (USD Million) Forecast by End User, 2021 to 2036
- Table 48: Middle East & Africa Market Value (USD Million) Forecast by Sales Channel, 2021 to 2036
- Figure 1: Global Market Pricing Analysis
- Figure 2: Global Market Value (USD Million) Forecast 2021-2036
- Figure 3: Global Market Value Share and BPS Analysis by Product Type, 2026 and 2036
- Figure 4: Global Market Y-o-Y Growth Comparison by Product Type, 2026-2036
- Figure 5: Global Market Attractiveness Analysis by Product Type
- Figure 6: Global Market Value Share and BPS Analysis by Phase, 2026 and 2036
- Figure 7: Global Market Y-o-Y Growth Comparison by Phase, 2026-2036
- Figure 8: Global Market Attractiveness Analysis by Phase
- Figure 9: Global Market Value Share and BPS Analysis by Product Form, 2026 and 2036
- Figure 10: Global Market Y-o-Y Growth Comparison by Product Form, 2026-2036
- Figure 11: Global Market Attractiveness Analysis by Product Form
- Figure 12: Global Market Value Share and BPS Analysis by End User, 2026 and 2036
- Figure 13: Global Market Y-o-Y Growth Comparison by End User, 2026-2036
- Figure 14: Global Market Attractiveness Analysis by End User
- Figure 15: Global Market Value Share and BPS Analysis by Sales Channel, 2026 and 2036
- Figure 16: Global Market Y-o-Y Growth Comparison by Sales Channel, 2026-2036
- Figure 17: Global Market Attractiveness Analysis by Sales Channel
- Figure 18: Global Market Value (USD Million) Share and BPS Analysis by Region, 2026 and 2036
- Figure 19: Global Market Y-o-Y Growth Comparison by Region, 2026-2036
- Figure 20: Global Market Attractiveness Analysis by Region
- Figure 21: North America Market Incremental Dollar Opportunity, 2026-2036
- Figure 22: Latin America Market Incremental Dollar Opportunity, 2026-2036
- Figure 23: Western Europe Market Incremental Dollar Opportunity, 2026-2036
- Figure 24: Eastern Europe Market Incremental Dollar Opportunity, 2026-2036
- Figure 25: East Asia Market Incremental Dollar Opportunity, 2026-2036
- Figure 26: South Asia and Pacific Market Incremental Dollar Opportunity, 2026-2036
- Figure 27: Middle East & Africa Market Incremental Dollar Opportunity, 2026-2036
- Figure 28: North America Market Value Share and BPS Analysis by Country, 2026 and 2036
- Figure 29: North America Market Value Share and BPS Analysis by Product Type, 2026 and 2036
- Figure 30: North America Market Y-o-Y Growth Comparison by Product Type, 2026-2036
- Figure 31: North America Market Attractiveness Analysis by Product Type
- Figure 32: North America Market Value Share and BPS Analysis by Phase, 2026 and 2036
- Figure 33: North America Market Y-o-Y Growth Comparison by Phase, 2026-2036
- Figure 34: North America Market Attractiveness Analysis by Phase
- Figure 35: North America Market Value Share and BPS Analysis by Product Form, 2026 and 2036
- Figure 36: North America Market Y-o-Y Growth Comparison by Product Form, 2026-2036
- Figure 37: North America Market Attractiveness Analysis by Product Form
- Figure 38: North America Market Value Share and BPS Analysis by End User, 2026 and 2036
- Figure 39: North America Market Y-o-Y Growth Comparison by End User, 2026-2036
- Figure 40: North America Market Attractiveness Analysis by End User
- Figure 41: North America Market Value Share and BPS Analysis by Sales Channel, 2026 and 2036
- Figure 42: North America Market Y-o-Y Growth Comparison by Sales Channel, 2026-2036
- Figure 43: North America Market Attractiveness Analysis by Sales Channel
- Figure 44: Latin America Market Value Share and BPS Analysis by Country, 2026 and 2036
- Figure 45: Latin America Market Value Share and BPS Analysis by Product Type, 2026 and 2036
- Figure 46: Latin America Market Y-o-Y Growth Comparison by Product Type, 2026-2036
- Figure 47: Latin America Market Attractiveness Analysis by Product Type
- Figure 48: Latin America Market Value Share and BPS Analysis by Phase, 2026 and 2036
- Figure 49: Latin America Market Y-o-Y Growth Comparison by Phase, 2026-2036
- Figure 50: Latin America Market Attractiveness Analysis by Phase
- Figure 51: Latin America Market Value Share and BPS Analysis by Product Form, 2026 and 2036
- Figure 52: Latin America Market Y-o-Y Growth Comparison by Product Form, 2026-2036
- Figure 53: Latin America Market Attractiveness Analysis by Product Form
- Figure 54: Latin America Market Value Share and BPS Analysis by End User, 2026 and 2036
- Figure 55: Latin America Market Y-o-Y Growth Comparison by End User, 2026-2036
- Figure 56: Latin America Market Attractiveness Analysis by End User
- Figure 57: Latin America Market Value Share and BPS Analysis by Sales Channel, 2026 and 2036
- Figure 58: Latin America Market Y-o-Y Growth Comparison by Sales Channel, 2026-2036
- Figure 59: Latin America Market Attractiveness Analysis by Sales Channel
- Figure 60: Western Europe Market Value Share and BPS Analysis by Country, 2026 and 2036
- Figure 61: Western Europe Market Value Share and BPS Analysis by Product Type, 2026 and 2036
- Figure 62: Western Europe Market Y-o-Y Growth Comparison by Product Type, 2026-2036
- Figure 63: Western Europe Market Attractiveness Analysis by Product Type
- Figure 64: Western Europe Market Value Share and BPS Analysis by Phase, 2026 and 2036
- Figure 65: Western Europe Market Y-o-Y Growth Comparison by Phase, 2026-2036
- Figure 66: Western Europe Market Attractiveness Analysis by Phase
- Figure 67: Western Europe Market Value Share and BPS Analysis by Product Form, 2026 and 2036
- Figure 68: Western Europe Market Y-o-Y Growth Comparison by Product Form, 2026-2036
- Figure 69: Western Europe Market Attractiveness Analysis by Product Form
- Figure 70: Western Europe Market Value Share and BPS Analysis by End User, 2026 and 2036
- Figure 71: Western Europe Market Y-o-Y Growth Comparison by End User, 2026-2036
- Figure 72: Western Europe Market Attractiveness Analysis by End User
- Figure 73: Western Europe Market Value Share and BPS Analysis by Sales Channel, 2026 and 2036
- Figure 74: Western Europe Market Y-o-Y Growth Comparison by Sales Channel, 2026-2036
- Figure 75: Western Europe Market Attractiveness Analysis by Sales Channel
- Figure 76: Eastern Europe Market Value Share and BPS Analysis by Country, 2026 and 2036
- Figure 77: Eastern Europe Market Value Share and BPS Analysis by Product Type, 2026 and 2036
- Figure 78: Eastern Europe Market Y-o-Y Growth Comparison by Product Type, 2026-2036
- Figure 79: Eastern Europe Market Attractiveness Analysis by Product Type
- Figure 80: Eastern Europe Market Value Share and BPS Analysis by Phase, 2026 and 2036
- Figure 81: Eastern Europe Market Y-o-Y Growth Comparison by Phase, 2026-2036
- Figure 82: Eastern Europe Market Attractiveness Analysis by Phase
- Figure 83: Eastern Europe Market Value Share and BPS Analysis by Product Form, 2026 and 2036
- Figure 84: Eastern Europe Market Y-o-Y Growth Comparison by Product Form, 2026-2036
- Figure 85: Eastern Europe Market Attractiveness Analysis by Product Form
- Figure 86: Eastern Europe Market Value Share and BPS Analysis by End User, 2026 and 2036
- Figure 87: Eastern Europe Market Y-o-Y Growth Comparison by End User, 2026-2036
- Figure 88: Eastern Europe Market Attractiveness Analysis by End User
- Figure 89: Eastern Europe Market Value Share and BPS Analysis by Sales Channel, 2026 and 2036
- Figure 90: Eastern Europe Market Y-o-Y Growth Comparison by Sales Channel, 2026-2036
- Figure 91: Eastern Europe Market Attractiveness Analysis by Sales Channel
- Figure 92: East Asia Market Value Share and BPS Analysis by Country, 2026 and 2036
- Figure 93: East Asia Market Value Share and BPS Analysis by Product Type, 2026 and 2036
- Figure 94: East Asia Market Y-o-Y Growth Comparison by Product Type, 2026-2036
- Figure 95: East Asia Market Attractiveness Analysis by Product Type
- Figure 96: East Asia Market Value Share and BPS Analysis by Phase, 2026 and 2036
- Figure 97: East Asia Market Y-o-Y Growth Comparison by Phase, 2026-2036
- Figure 98: East Asia Market Attractiveness Analysis by Phase
- Figure 99: East Asia Market Value Share and BPS Analysis by Product Form, 2026 and 2036
- Figure 100: East Asia Market Y-o-Y Growth Comparison by Product Form, 2026-2036
- Figure 101: East Asia Market Attractiveness Analysis by Product Form
- Figure 102: East Asia Market Value Share and BPS Analysis by End User, 2026 and 2036
- Figure 103: East Asia Market Y-o-Y Growth Comparison by End User, 2026-2036
- Figure 104: East Asia Market Attractiveness Analysis by End User
- Figure 105: East Asia Market Value Share and BPS Analysis by Sales Channel, 2026 and 2036
- Figure 106: East Asia Market Y-o-Y Growth Comparison by Sales Channel, 2026-2036
- Figure 107: East Asia Market Attractiveness Analysis by Sales Channel
- Figure 108: South Asia and Pacific Market Value Share and BPS Analysis by Country, 2026 and 2036
- Figure 109: South Asia and Pacific Market Value Share and BPS Analysis by Product Type, 2026 and 2036
- Figure 110: South Asia and Pacific Market Y-o-Y Growth Comparison by Product Type, 2026-2036
- Figure 111: South Asia and Pacific Market Attractiveness Analysis by Product Type
- Figure 112: South Asia and Pacific Market Value Share and BPS Analysis by Phase, 2026 and 2036
- Figure 113: South Asia and Pacific Market Y-o-Y Growth Comparison by Phase, 2026-2036
- Figure 114: South Asia and Pacific Market Attractiveness Analysis by Phase
- Figure 115: South Asia and Pacific Market Value Share and BPS Analysis by Product Form, 2026 and 2036
- Figure 116: South Asia and Pacific Market Y-o-Y Growth Comparison by Product Form, 2026-2036
- Figure 117: South Asia and Pacific Market Attractiveness Analysis by Product Form
- Figure 118: South Asia and Pacific Market Value Share and BPS Analysis by End User, 2026 and 2036
- Figure 119: South Asia and Pacific Market Y-o-Y Growth Comparison by End User, 2026-2036
- Figure 120: South Asia and Pacific Market Attractiveness Analysis by End User
- Figure 121: South Asia and Pacific Market Value Share and BPS Analysis by Sales Channel, 2026 and 2036
- Figure 122: South Asia and Pacific Market Y-o-Y Growth Comparison by Sales Channel, 2026-2036
- Figure 123: South Asia and Pacific Market Attractiveness Analysis by Sales Channel
- Figure 124: Middle East & Africa Market Value Share and BPS Analysis by Country, 2026 and 2036
- Figure 125: Middle East & Africa Market Value Share and BPS Analysis by Product Type, 2026 and 2036
- Figure 126: Middle East & Africa Market Y-o-Y Growth Comparison by Product Type, 2026-2036
- Figure 127: Middle East & Africa Market Attractiveness Analysis by Product Type
- Figure 128: Middle East & Africa Market Value Share and BPS Analysis by Phase, 2026 and 2036
- Figure 129: Middle East & Africa Market Y-o-Y Growth Comparison by Phase, 2026-2036
- Figure 130: Middle East & Africa Market Attractiveness Analysis by Phase
- Figure 131: Middle East & Africa Market Value Share and BPS Analysis by Product Form, 2026 and 2036
- Figure 132: Middle East & Africa Market Y-o-Y Growth Comparison by Product Form, 2026-2036
- Figure 133: Middle East & Africa Market Attractiveness Analysis by Product Form
- Figure 134: Middle East & Africa Market Value Share and BPS Analysis by End User, 2026 and 2036
- Figure 135: Middle East & Africa Market Y-o-Y Growth Comparison by End User, 2026-2036
- Figure 136: Middle East & Africa Market Attractiveness Analysis by End User
- Figure 137: Middle East & Africa Market Value Share and BPS Analysis by Sales Channel, 2026 and 2036
- Figure 138: Middle East & Africa Market Y-o-Y Growth Comparison by Sales Channel, 2026-2036
- Figure 139: Middle East & Africa Market Attractiveness Analysis by Sales Channel
- Figure 140: Global Market – Tier Structure Analysis
- Figure 141: Global Market – Company Share Analysis
