


Download PDF
Abstract
Obesity is a major risk factor for colorectal cancer (CRC), yet the mechanisms linking obesity-associated gut dysbiosis to tumor progression remain unclear. Here, we show that a high-fat diet and fecal microbiota from patients with obesity-associated CRC deplete the GABA-producing commensal Bacteroides ovatus, resulting in reduced luminal GABA and accelerated tumorigenesis. Microbial GABA activates epithelial GABAB receptor signaling and induces TPI1 through the PI3K–HIF1α pathway. Increased TPI1-derived glyceraldehyde-3-phosphate inhibits PPP1CA, maintains YAP phosphorylation, restricts nuclear YAP activity, and suppresses pentose phosphate pathway flux, thereby limiting tumor growth. Consistently, obesity-associated CRC exhibits reduced fecal GABA, decreased TPI1 expression, and metabolic rewiring. A GABA-deficient B. ovatus mutant fails to restore GABA or suppress tumors despite normal colonization, whereas oral GABA supplementation or recolonization with wild-type B. ovatus markedly reduces tumor burden. These findings identify a microbiota–neurotransmitter–metabolism axis linking obesity to CRC and suggest microbiota-based GABA restoration as a potential preventive strategy.
Introduction
Obesity, a chronic condition affecting over 2.1 billion adults worldwide1, is a well-established risk factor for colorectal cancer (CRC)2. Epidemiological studies reveal that individuals with obesity face a 30–50% elevated risk of CRC3, with this risk intensifying alongside rising body mass index (BMI). Despite this clear association, the mechanistic links between obesity and CRC remain incompletely understood, particularly the role of the gut microbiota as a pivotal mediator
Emerging evidence suggests that obesity triggers profound microbial dysbiosis, disrupting microbial metabolite production, including GABA, a neurotransmitter-like metabolite produced by gut bacteria. Beyond its neurological roles4,5, GABA is increasingly being recognized for regulating intestinal homeostasis and suppressing tumor growth6. In addition, GABAB receptor signaling has been reported to suppress CRC progression through regulation of the Hippo/YAP1 pathway, suggesting that GABA-related signaling may directly interface with oncogenic transcriptional programs in CRC7. This disruption in microbial metabolite production, particularly GABA production, may alter host metabolism, potentially driving the metabolic reprogramming observed in CRC. Specifically, whether GABA signaling is involved in glycolytic dysregulation in CRC-a hallmark of obesity-driven tumors8,9, is largely unknown.
Obesity not only impacts fat storage and energy balance but also triggers extensive systemic metabolic perturbations, leading to dyslipidemia, insulin resistance, hypercholesterolemia, hormonal imbalances, and chronic low-grade inflammation10. Metabolic reprogramming allows cancer cells to adapt to a hostile tumor microenvironment and fulfill the demands of rapid proliferation by modulating energy supply, accumulating metabolic byproducts, and reshaping the tumor microenvironment11,12. For instance, pentose phosphate pathway (PPP) activation fuels NADPH synthesis for redox homeostasis and nucleotide precursors, whereas GAP deficiency may destabilize glycolytic flux, creating a permissive niche for tumor growth13,14. Previous studies on obesity and CRC have focused on transcriptional and epigenetic alterations15, but the role of microbiota-derived metabolites in these processes remains unexplored.
In this study, using patient-derived organoids and diet-induced obesity murine models, we found that both B. ovatus and its secreted metabolite GABA exert a protective role in patients with obesity-associated CRC by increasing GAP levels and deactivating the PPP to reprogram cancer metabolism. We highlight the potential of both B. ovatus and GABA as therapeutic and preventive strategies for CRC associated with obesity
Results
The tumor-suppressive activity of TPI1 in CRC is mediated by its metabolic product GAP, which is reduced in CRC patients with obesity
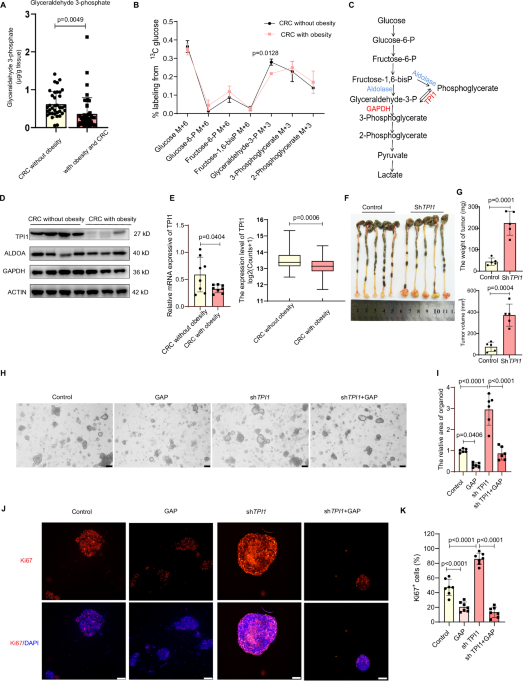
Metabolic reprogramming plays a pivotal role in tumorigenesis and progression and is primarily mediated through the orchestration of energy metabolism, biosynthetic precursor supply, and redox homeostasis. To investigate energy metabolism dysregulation in obesity-associated CRC, we performed targeted energy metabolomics on tumor tissues from treatment-naive patients with CRC and obesity (BMI ≥ 30 kg/m²) and from treatment-naive patients with CRC and normal weight (BMI < 25 kg/m²). The results revealed a significant decrease in the GAP levels in CRC tissues from patients with obesity. Consistent with this observation, 13C-isotopomer-resolved metabolic flux analysis revealed reduced GAP levels in CRC cohorts with obesity (Fig. 1A, B and Supplementary Data 2). To investigate the paradoxical depletion of GAP in obesity-associated CRC, we systematically analyzed key enzymatic regulators along the glycolytic axis – focusing on aldolase (upstream node), GAPDH (catalytic hub), and triosephosphate isomerase 1 (TPI1, downstream regulator) (Fig. 1C). Our results revealed that TPI1 was significantly reduced in CRC tissues from patients with obesity, whereas GAPDH and Aldolase levels remained stable (Fig. 1D, E).
A Mass spectrometry of glyceraldehyde-3-phosphate (GAP) in CRC tissues from patients with CRC without obesity (n = 36) and patients with obesity and CRC (n = 46); n, patients. B ¹³C-isotopomer-resolved flux analysis of tumor tissues from patients with CRC without obesity (n = 3) and patients with obesity and CRC (n = 4 patients). C Schematic of the glycolytic node interrogation strategy targeting GAP. D Protein expression of Aldolase, GAPDH, and TPI1 in CRC specimens from patients with normal-weight CRC (n = 4) and obesity-associated CRC (n = 3). GAPDH and actin were detected on the same membrane, whereas Aldolase and TPI1 were detected on a separate membrane. ETPI1 mRNA in CRC specimens; left, n = 8 per group; right, n = 71 (without obesity) and n = 80 (with obesity); n, patients. F Representative tumor morphology of BALB/c mice bearing CT26 cells stably expressing control or TPI1 knockdown; representative of five mice per group with similar results. G Tumor weight (top) and volume (bottom); n = 5 mice per group. H Representative bright-field organoid images (control, GAP, shTPI1, shTPI1 + GAP). Scale bar, 200 μm; representative of six independent experiments with similar results. I Organoid area; n = 6 independent experiments. J Ki-67 immunofluorescence of patient-derived CRC organoids (conditions as in H). Scale bar, 100 μm; representative of seven independent experiments with similar results. K Ki-67⁺ cells; n = 7 independent experiments. Statistics: Two-sided unpaired Student’s t-test (A, B, E, G); two-sided one-way ANOVA with Tukey’s post hoc test (I, K). Source data are provided as a Source data file.
To explore the role of TPI1 in CRC, we first confirmed its constitutive expression in CRC cell lines (Supplementary Fig. 1A) and established cell lines with either overexpression or knockdown of TPI1 (Supplementary Fig. 1B–E). CCK-8 and colony formation assays indicated that overexpression of TPI1 significantly inhibited cell proliferation, whereas knockdown of TPI1 markedly increased the proliferation ability of CRC cells (Supplementary Fig. 1F–I). In vivo, TPI1 overexpression suppressed tumor burden (volume, weight, and growth kinetics) and decreased Ki-67+ proliferative index (Supplementary Fig. 2A–D). Conversely, TPI1 knockdown exacerbated tumor progression while elevating cellular proliferation markers (Fig. 1F, G and Supplementary Fig. 2E–H). Simultaneously, orthogonal validation of CRC patient-derived organoids revealed that TPI1 knockdown accelerated proliferation (Fig. 1H–K).
To investigate the role of GAP in CRC progression, we treated HT-29 and RKO cells with GAP for 48 h. CCK-8 assays, colony formation, and EdU labeling collectively demonstrated that GAP treatment suppressed the proliferation of HT-29 and RKO cells (Supplementary Fig. 3A–E). Notably, GAP stimulation significantly reduced the proliferative capacity of the patient-derived CRC organoids (Fig. 1H–K). Collectively, these results delineate that GAP depletion in obesity-associated CRC drives disease progression.
To delineate the dependency of TPI1-mediated proliferation on GAP, we performed rescue experiments by complementation with substrate supplementation. Remarkably, exogenous GAP administration abolished TPI1 deficiency-driven hyperproliferation, as evidenced by both the CCK-8 and colony formation assays (Supplementary Fig. 3F–H). This GAP-dependent rescue effect was further confirmed in patient-derived organoid models, where TPI1-knockdown organoids exhibited significant size reduction and diminished Ki-67 positivity upon GAP supplementation (Fig. 1H–K). These data indicate that TPI1 expression is significantly downregulated in tumors from patients with obesity and CRC, and its deficiency promotes tumor cell proliferation by reducing in GAP levels.
Bacteroides ovatus (BO) inhibits the occurrence and progression of obesity-associated CRC
To investigate the mechanisms underlying the decreased expression of TPI1 in obesity-associated CRC, and given that obesity remodels the gut microbiota ecosystem, driving shifts in both taxonomic composition and functional potential16,17,18, we integrated fecal microbiota transplantation (FMT) with metagenomic profiling of fecal microbiomes from CRC patients. Feces from patients with obesity and CRC and from patients with normal weight and CRC were transplanted into ApcMin/+ spontaneous intestinal tumorigenesis mice and subcutaneous tumor-bearing mice. In ApcMin/+ mice, fecal microbiota from patients with obesity accelerated tumorigenesis, manifesting as increased colonic (Fig. 2A) and small intestinal tumor counts (Fig. 2B). Histopathological analysis of the HE-stained sections revealed hypercellular tumor regions with frequent nuclear atypia (Fig. 2C), consistent with enhanced proliferative activity. Concomitant suppression of TPI1 expression was observed in tumors from recipients of microbiota from patients with obesity and CRC (Fig. 2D, E). Similarly, subcutaneous xenograft recipients of microbiota from patients with obesity and CRC exhibited exacerbated tumor burden, with larger volumes, higher tumor mass, and Ki-67+ proliferative index compared to controls receiving microbiota from patients with normal weight and CRC (Supplementary Fig. 4A–D). These findings demonstrate that obesity-associated gut microbiota functionally drives CRC initiation and progression, while mechanistically linking microbial dysbiosis to TPI1 suppression in tumors.
A Colon tumors and counts in SPF ApcMin/+ mice given fecal microbiota from patients with CRC, with or without obesity; n = 8 mice per group. B Small-intestinal polyps and counts in the same recipients; n = 8 mice per group. C H&E of colon sections from these recipients (red boxes, adenomatous polyps). Scale bar, 2 mm; representative of three mice per group. D TPI1 IHC of polyps from these recipients. Scale bar, left: 100 μm, right: 50 μm; zoomed-in images: 10 μm; representative of three mice per group with similar results. E TPI1 immunostaining (TPI1⁺ cells and IOD/area); n = 3 mice per group. F Heatmap of Z-score-normalized relative abundance of 24 bacterial species (up, red; down, blue). IOD integrated optical density. G Box plots of B. ovatus relative abundance (CRC without obesity, n = 173; CRC with obesity, n = 32 patients); center, median; box, 25th–75th percentiles; whiskers, minimum–maximum. H RT-qPCR of B. ovatus in feces; n = 31 (without obesity) and n = 30 (with obesity) patients. I Colon images from ApcMin/+ mice treated with B. ovatus under a control diet (CD) or a high-fat diet (HFD); n = 5 mice per group. J Colon tumor numbers; n = 9 mice per group. K, L H&E of colon tumors from these mice. Scale bar, 2 mm; representative of three mice per group with similar results. MTPI1 mRNA in colon of B. ovatus-treated ApcMin/+ mice; n = 3 mice per group. N Western blot of TPI1 in colon of ApcMin/+ mice (B. ovatus versus PBS, normal diet); representative of 2 mice per group with similar results. O TPI1 IHC of colon polyps from B. ovatus-treated ApcMin/+ mice; n = 3 mice per group. Scale bar, 200 μm; zoomed-in images: 20 μm. P TPI1 immunostaining; n = 3 mice per group. Statistics: two-sided unpaired Student’s t-test (A, B, G, H, M, P); two-sided one-way ANOVA with Tukey’s post hoc test (E, J); two-sided Wilcoxon rank-sum test (F). Source data are provided as a Source data file.
To identify the gut microbiota critically involved in obesity-associated fecal promotion of CRC, we systematically searched and compiled metagenomic datasets from CRC-relevant fecal samples (Supplementary Fig. 4E). The results indicated that 13 bacterial species, including BO, B. cecum, B. faecalis, B. hepaticus, B. cryoformis, and B. ulcerans, exhibited a reduced abundance in obesity-associated CRC (Fig. 2F and Supplementary Figs. 4F and 5B). Strikingly, B. ovatus emerged as the most abundant species within this signature across CRC groups with normal weight and with obesity (Fig. 2G). Validating this signature in our cohort, patients with obesity and CRC exhibited significantly lower abundance of B. ovatus than patients with normal weight and CRC (Fig. 2H). This demonstrates that obesity-associated microbiota transfer drives B. ovatus depletion independent of host metabolic perturbations.
To functionally validate BO in obesity-associated CRC progression, we used ApcMin/+ spontaneous tumor models under two dietary regimens: control diet (CD) and high-fat diet (HFD). As anticipated, HFD-fed ApcMin/+ mice developed exacerbated tumorigenesis, exhibiting more colorectal tumors than CD-fed mice (Fig. 2I–L)
Crucially, daily oral administration of B. ovatus significantly attenuated the tumor burden in both dietary cohorts. In the B. ovatus HFD group, the number and volume of tumors were significantly reduced compared to those in the control group (Fig. 2I–L and Supplementary Fig. 5A). Additionally, in the CD-fed ApcMin/+ mouse model, B. ovatus treatment resulted in a significant reduction in tumor number (Fig. 2I–L). We established a subcutaneous tumor model using a murine CRC cell line (CT26). The results showed that, compared to the control group, B. ovatus treatment significantly reduced tumor size and weight, slowed tumor growth, and decreased the number of Ki-67-positive cells (Supplementary Fig. 4G–K). Quantitative verification of intestinal colonization by B. ovatus was performed using species-specific RT-qPCR. Recipient mice exhibited sustained colonization (Supplementary Fig. 5C).
To investigate whether B. ovatus regulates the expression of TPI1, we analyzed TPI1 expression in B. ovatus -treated CD-fed ApcMin/+ mice using RT-qPCR, Western blotting, and IHC. The results demonstrated that the expression of TPI1 was significantly higher in the B. ovatus group than in the control group (Fig. 2M–P). These results collectively suggest that the reduced abundance of B. ovatus in the feces of patients with obesity is one of the factors contributing to CRC progression
GABA derived from BO suppresses CRC through GABABR
To investigate whether the anti-tumor effects of B. ovatus are mediated by the bacterial contents or their metabolic products, we incubated CRC cell lines with heat-inactivated B. ovatus (bacterial contents), bacterial culture supernatants, and filter-sterilized culture supernatant of B. ovatus. The results showed that the bacterial content of B. ovatus had no effect on tumor cell proliferation (Fig. 3A and Supplementary Fig. 6A). Both heat-treated and untreated supernatants of B. ovatus inhibited tumor cell proliferation (Fig. 3A and Supplementary Fig. 6A–C). These findings suggest that inhibition of CRC progression by B. ovatus is mediated by its non-protein metabolic products.
A CCK-8 viability assay of HT-29 and RKO cells treated with heat-killed B. ovatus, heat-inactivated B. ovatus supernatant, or active B. ovatus supernatant; n = 5 independent experiments per group. B LC-MS of GABA in B. ovatus versus control (sterile medium) supernatants; n = 5 independent cultures per group. C LC-MS of fecal GABA in ApcMin/+ mice (B. ovatus versus PBS) at days 0, 7 and 14; n = 5 mice per group. D LC-MS of fecal GABA in patients with obesity and CRC versus patients with CRC without obesity; n = 5 patients per group. E Bright-field images (left; scale bar, 200 μm) and area (right) of primary CRC organoids (GABA versus control); n = 4 patient-derived organoid cultures. F Ki-67 immunofluorescence (left; scale bar, 200 μm) and Ki-67⁺ quantification (right) of CRC organoids (GABA versus vehicle); n = 8 patient-derived organoid cultures. G Representative colon images from ApcMin/+ mice (GABA versus PBS) under CD or HFD; n = 5 mice per group. H Colon tumor counts; n = 10 mice per group. I, J Representative H&E of colon (red boxes, adenomatous polyps); representative of three mice per group with similar results. K LC-MS of GABA in culture medium, wild-type B. ovatus supernatant and B. ovatusΔgadB supernatant; n = 5 independent cultures per group. L LC-MS of fecal GABA from mice treated with PBS, wild-type B. ovatus or B. ovatusΔgadB; n = 5 mice per group. M–OB. ovatusΔgadB attenuates the anti-tumor effect of wild-type B. ovatus in the ApcMin/+ model, n = 6 mice per group (M). N Tumor numbers; n = 6 mice per group. O Representative H&E of intestinal tumors; representative of three mice per group with similar results. Statistics: two-sided unpaired Student’s t-test (B, D, E, F); two-sided one-way ANOVA with Tukey’s post hoc test (A, H, K, L, N); two-sided two-way ANOVA with multiple-comparison correction (C). Source data are provided as a Source data file.
Accumulating evidence indicates that select Bacteroides species function as dominant GABAergic commensals within the gut ecosystem, biosynthesizing substantial quantities of GABA through dependent pathways. Notably, comparative metabolomic profiling of 23 Bacteroides strains identified B. ovatus ATCC 8483 as the most potent GABA producer6,19. Consistent with its established GABA-producing capacity, liquid chromatography-mass spectrometry (LC-MS) elevated GABA concentrations in both B. ovatus culture supernatants, fecal samples, and tumor tissue from B. ovatus-colonized mice (Fig. 3B, C and Supplementary Fig. 7A). Clinically relevant to CRC pathogenesis, fecal GABA levels were significantly depleted in patients with obesity compared to their normal-weight counterparts, establishing a potential mechanistic link between microbial GABA deficiency and obesity-associated tumor progression (Fig. 3D).
To investigate the effect of GABA on cell proliferation, we first stimulated cells with GABA. GABA exposure significantly inhibited the proliferation of CRC cells (Supplementary Fig. 6D, E). This growth suppression extended to physiologically relevant 3D models, where GABA-treated patient-derived CRC organoids significantly reduced in diameter and decreased in the proliferative compartment (Ki-67+ cells), demonstrating conserved growth-inhibitory activity across in vitro and ex vivo systems (Fig. 3E, F). In the HT-29 cell-derived subcutaneous xenograft model, both peroral and intraperitoneal GABA administration demonstrated dose-responsive tumor suppression, with treated cohorts exhibiting marked reductions in tumor dimensions and mass compared with vehicle controls. Longitudinal monitoring revealed progressive deceleration of tumor growth kinetics in GABA intervention groups, paralleled by histological evidence of reduced cellular proliferation as visualized through Ki-67 immunohistochemical analysis (Supplementary Fig. 6F–M). In the ApcMin/+ spontaneous intestinal tumor model, oral GABA supplementation demonstrated potent tumor-suppressive effects across dietary regimens. Under both normal chow and HFD conditions, GABA-treated cohorts exhibited marked reductions in gross tumor burden, with visibly smaller lesion dimensions and improved tissue architecture compared with vehicle controls. HE evaluation further revealed GABA-mediated restraint of tumor growth, supporting GABA’s broad-spectrum growth-inhibitory effects of GABA in genetically predisposed and diet-accelerated tumor models (Fig. 3G–J and Supplementary Fig. 7B, G, H). Notably, GABA administration did not alter the body weight or blood glucose levels in ApcMin/+ mice (Supplementary Fig. 6N, O). Collectively, GABA demonstrates broad-spectrum anti-tumor efficacy against CRC across distinct preclinical CRC models, suppressing neoplastic progression through inhibition of proliferative activity and histopathological improvement.
To investigate whether B. ovatus suppresses CRC through GABA production, we generated a B. ovatus strain with a knockout of the gadB gene (B. ovatus△gadB), which encodes a key enzyme in GABA biosynthesis (Supplementary Fig. 7A). LC-MS analysis revealed that GABA concentrations in both the culture supernatants and fecal samples were significantly lower in the B. ovatus△gadB group compared to wild-type B. ovatus (Fig. 3K, L). The results showed that knockout of the gadB gene did not affect the colonization capacity of B. ovatus. Furthermore, in the ApcMin/+ spontaneous intestinal tumor model, B. ovatus△gadB markedly attenuated the tumor-suppressive effects observed with wild-type B. ovatus treatment (Fig. 3M–O and Supplementary Fig. 7C–F). These findings demonstrate that GABA production is a critical mediator of the anti-tumor activity of B. ovatus against CRC.
To delineate the receptor axis underlying GABA’s anti-CRC activity of GABA, we performed a pharmacological interrogation using subtype-selective agonists. Treatment of HT-29/RKO cell lines with the GABABR agonist baclofen recapitulated the GABA-mediated suppression of proliferation, whereas the GABAAR agonist muscimol showed no anti-proliferative activity (Fig. 4A). Pharmacological antagonism studies further confirmed that GABABR is a necessary mediator of GABA’s anti-proliferative effects of GABA. Co-treatment with the GABABR antagonist CGP52432 (CGP), but not the GABAAR antagonist bicuculline, significantly rescued the anti-proliferative effects of GABA in HT-29/RKO cells, as evidenced by CCK-8 viability assays and EdU incorporation rates (Fig. 4B and Supplementary Fig. 8A, B). The inert proliferative profiles of antagonist monotherapies excluded off-target cytotoxicity, establishing GABABR signaling as the dominant pharmacological target for GABA-mediated CRC growth suppression (Supplementary Fig. 8C, D and Supplementary Fig. 9A, B). Consistent with the cell line data, GABABR antagonism using CGP significantly reversed GABA-induced suppression of organoid expansion and Ki-67+ proliferation in patient-derived CRC organoids (Fig. 4C–F). These findings indicate that establishing GABABR activation is both necessary and sufficient for mediating GABA’s anti-tumor effects of GABA.
A CCK-8 assay of HT-29 and RKO cells treated with muscimol (GABAA-receptor agonist) or baclofen (GABAB-receptor agonist); n = 4 independent experiments per group. B CCK-8 assay of HT-29 and RKO cells treated with GABA alone or with bicuculline (GABAA-receptor antagonist) or CGP (GABAB-receptor antagonist); n = 4 independent experiments per group. C Representative bright-field images of patient-derived CRC organoids (control, GABA, or GABA + CGP). Scale bar, 200 μm; representative of five organoid cultures with similar results. D Fold change in organoid area normalized to baseline (0 h); n = 5 patient-derived organoid cultures. E Representative Ki-67 immunofluorescence (red; nuclei, DAPI, blue) of organoids (control, GABA, or GABA + CGP). Scale bar, 100 μm; representative of four organoid cultures with similar results. F Ki-67⁺ cells; n = 4 patient-derived organoid cultures. G Representative EdU⁺ images (red; left; scale bar, 100 μm) and quantification (right) of HT-29 (control medium, B. ovatus supernatant, or B. ovatus supernatant + CGP); n = 3 independent experiments. H CCK-8 assay of HT-29 (control medium, B. ovatus supernatant, or B. ovatus supernatant + CGP); n = 4 independent experiments per group.Statistics: two-sided one-way ANOVA with Tukey’s post hoc test (A, B, D, F, G, H). Source data are provided as a Source data file.
Extending these findings to microbial ecology, we demonstrated that B. ovatus-secreted metabolites recapitulate GABABR-dependent anti-tumor activity. Treatment of HT-29/RKO cells with B. ovatus supernatant significantly suppressed proliferation (CCK-8 and EdU), an effect fully abrogated by GABABR antagonism, whereas control supernatants exhibited no such activity (Fig. 4G, H and Supplementary Fig. 8E, F). Our findings established that B. ovatus-derived GABA suppresses obesity-associated CRC through GABABR-mediated proliferation arrest.
BO-secreted GABA suppresses CRC progression
Mechanistic studies revealed that both B. ovatus supernatant and exogenous GABA significantly upregulated TPI1 expression in HT-29/RKO cells, as evidenced by RT-qPCR and western blot analyses (Fig. 5A and Supplementary Fig. 10A–C). This regulatory effect extended to in vivo models, where GABA administration robustly enhanced TPI1 expression in the intestinal tissues of ApcMin/+ mice and subcutaneous xenografts (Fig. 5B, C and Supplementary Fig. 10D–G)
A RT-qPCR of TPI1 mRNA in HT-29 and RKO cells treated with filtered B. ovatus supernatant; n = 6 independent experiments per group. BTPI1 mRNA in colon tissues of GABA-treated ApcMin/+ mice (normalized to β-actin); n = 3 mice per group. C Western blot of TPI1 in colon tissues of ApcMin/+ mice (GABA versus PBS; quantification, right); n = 4 mice per group. D RT-qPCR of TPI1 mRNA in HT-29 and RKO cells treated with baclofen (GABABR agonist) or muscimol (GABAA-receptor agonist); n = 4 independent experiments per group. ETPI1 mRNA in HT-29 and RKO cells (GABA, GABA + bicuculline, or GABA + CGP); n = 4 independent experiments per group. F Representative western blot of TPI1 in HT-29 and RKO cells (control, GABA, GABA + bicuculline, or GABA + CGP); representative of three independent experiments with similar results. G TPI1 quantification (normalized to β-tubulin); n = 3 independent experiments per group. H RT-qPCR of TPI1 mRNA in RKO cells (control, baclofen, wortmannin, or baclofen + wortmannin); n = 3 independent experiments per group. I RT-qPCR of TPI1 mRNA in RKO cells (control, baclofen, HIF1α inhibitor, or baclofen + HIF1α inhibitor); n = 3 independent experiments per group. J CCK-8 assay of HT-29 (n = 4) and RKO (n = 6 independent experiments) cells (control, shTPI1, GABA + control, or GABA + shTPI1). K Colony formation of HT-29 and RKO cells (same conditions); n = 4 independent experiments per group. Statistics: two-sided unpaired Student’s t-test (A–C); two-sided one-way ANOVA with Tukey’s post hoc test (D, E, G, H, I, J, K). Source data are provided as a Source data file.
Receptor specificity analysis demonstrated that the GABABR agonist baclofen recapitulated GABA-induced TPI1 upregulation, whereas the GABAAR agonist muscimol showed no effect (Fig. 5D). Crucially, pharmacological antagonism of GABABR with CGP abolished GABA-mediated TPI1 induction, whereas GABAAR blockade with bicuculline failed to alter this response (Fig. 5E–G and Supplementary Fig. 9C, D)
TPI1 knockdown accelerated tumor growth but did not further enhance HFD-driven tumor progression, indicating a non-additive effect. In contrast, BO-mediated tumor suppression was abolished in TPI1-deficient tumors, demonstrating that TPI1 is required for BO function (Supplementary Fig. 9E, F)
Given established evidence that GABA activates PI3K signaling through GABABR20, and that PI3K upregulates HIF1α expression, which subsequently enhances TPI1 transcription21,22. To elucidate the mechanistic link between GABABR and TPI1, we found that inhibition of PI3K suppressed GABABR-induced upregulation of both HIF1α and TPI1 (Fig. 5H), demonstrating that GABABR promotes HIF1α/TPI1 expression through PI3K signaling. Critically, GABABR upregulated TPI1via HIF1α (Fig. 5I). Collectively, these data define a GABABR–PI3K–HIF1α–TPI1 signaling cascade that rewires glycolytic flux in CRC associated with obesity. Functional rescue experiments confirmed the necessity of TPI1 in mediating GABA’s anti-tumor effects of GABA. shRNA-mediated TPI1 knockdown reversed GABA-induced proliferation inhibition in CRC cells, restoring colony formation capacity and CCK-8 viability (Fig. 5L–L and Supplementary Fig. 10H). These findings collectively establish a microbially modulated axis wherein B. ovatus-derived GABA signals through GABABR to activate TPI1-dependent tumor suppression programs.
GAP suppresses CRC progression by binding PPP1CA to inhibit YAP dephosphorylation
To investigate the potential targets of GAP in CRC, we employed the drug affinity responsive target stability (DARTS) technique with mass spectrometry to identify potential GAP-binding proteins. We incubated GAP with RKO cell lysates, followed by proteolysis (Supplementary Fig. 11A). Proteins bound to GAP were protected from degradation during this process. Using LC-MS, we observed a significant separation of differential proteins between the GAP-incubated and control groups (Supplementary Fig. 11B, C). Furthermore, we performed immunoprecipitation (IP) experiments using a synthesized anti-GAP antibody, followed by proteomic analysis. Interestingly, the intersection of differentially expressed proteins identified by DARTS and IP revealed that GAP could bind to PPP1CA and protect it from proteolysis (Fig. 6A). Co-immunoprecipitation assays and molecular docking simulations confirmed the physical interaction between GAP and the catalytic domain of PPP1CA (Fig. 6B–D). Although GAP binding did not alter PPP1CA expression levels, it significantly attenuated PPP1CA phosphatase activity, as evidenced by enzymatic assays (Fig. 6E and Supplementary Fig. 11D, E).
A Venn diagram of proteins shared by DARTS and co-IP proteomics with GAP antibody, identifying PPP1CA as a GAP-binding protein. B Immunoblot of PPP1CA pulled down by GAP antibody (top) and reciprocal co-IP of GAP with PPP1CA antibody (bottom); The immunoblots shown were obtained from separate membranes. Representative of 2 independent experiments with similar results. C Molecular docking of GAP to PPP1CA: predicted binding interface (top) and interaction residues (bottom); GAP, green; PPP1CA, cyan. D Co-IP in 293 T cells expressing PPP1CA WT or mutant (R132A/R221A) and treated with GAP (IP, GAP antibody; immunoblot, PPP1CA); n = 2 independent experiments. E PPP1CA phosphatase activity in HT-29 treated with GAP; n = 3 independent experiments per group. F CCK-8 assay of HT-29 transfected with PPP1CA WT or mutant (R132A/R221A) and treated with GAP; n = 5 independent experiments per group. G Colony formation (same conditions); n = 5 independent experiments per group. H Western blot of phospho-YAP (P-YAP) and total YAP in HT-29 and RKO cells (PPP1CA WT or mutant; GAP or vehicle). I Immunofluorescence of YAP in intestinal tissues of ApcMin/+ mice after GABA. Blue arrows, cytoplasmic YAP; green arrows, nuclear YAP. Scale bar, 100 μm; zoomed-in images: 20 μm; representative of five mice per group with similar results. J Immunofluorescence of YAP in intestinal tissues of ApcMin/+ mice after B. ovatus colonization (arrows as in I). Scale bar, 100 μm; zoomed-in images: 20 μm; representative of five mice per group with similar results. K Immunofluorescence of YAP in tumor tissues from patients with obesity and CRC and patients with normal weight and CRC (arrows as in I). Scale bar, 100 μm; zoomed-in images: 20 μm; representative of four patients per group with similar results. L RT-qPCR of Ctgf and Edn1 in colonic tissues of ApcMin/+ mice (B. ovatus versus PBS); n = 3 mice per group. M RT-qPCR of Ctgf and Edn1 in colonic tissues of ApcMin/+ mice (GABA versus PBS); n = 3 mice per group. Statistics: two-sided unpaired Student’s t-test (E, L, M); two-sided one-way ANOVA with Tukey’s post hoc test (F, G). Source data are provided as a Source data file.
Functional rescue experiments established that the PPP1CA-GAP axis is a critical mediator of proliferation control. Although GAP treatment effectively suppressed colony formation in PPP1CA-overexpressing CRC cells, this anti-proliferative effect was abrogated in cells harboring the PPP1CA mutant incapable of GAP binding (Fig. 6F, G and Supplementary Fig. 11F, G)
PPP1CA is known to dephosphorylate YAP, promoting its nuclear translocation and transcriptional activation23,24. Molecular docking results revealed that GAP forms dual hydrogen-bond interactions with the amino acid residues Arg-132 (2.1 Å) and Arg-221 (2.3 Å), which represent the predominant binding forces between the small molecule GAP and PPP1CA. Based on this structural insight, we constructed mutant plasmids that targeted these two critical interaction sites. Overexpression of wild-type PPP1CA, but not its catalytically inert mutants (R132A, R221A), reduced YAP phosphorylation in 293 T cells (Supplementary Fig. 11H). Critically, co-treatment with GAP reversed PPP1CA-mediated YAP dephosphorylation and restored phospho-YAP levels in a binding-dependent manner. This regulatory effect was abolished in cells expressing PPP1CA mutants defective in the GAP interaction, confirming the necessity of direct molecular engagement (Fig. 6H and Supplementary Fig. 11I).
Exogenous GABA administration suppressed YAP nuclear translocation in intestinal epithelial cells, as evidenced by a reduced percentage of cells with nuclear YAP localization (Fig. 6I and Supplementary Fig. 11J–L). Concordantly, B. ovatus colonization in ApcMin/+ mice significantly suppressed YAP nuclear translocation and enhanced YAP phosphorylation (Fig. 6J and Supplementary Fig. 11J, L, M). Notably, YAP was localized in the nucleus in tumor tissues from patients with obesity, whereas YAP localization was mainly cytoplasmic in tumors from normal-weight CRC patients (Fig. 6K and Supplementary Fig. 11J, K). Both interventions mechanistically downregulated the transcription of YAP-driven oncogenic targets (CTGF, EDN1, CYR61 and ANKRD1) (Fig. 6L, M and Supplementary Fig. 11N). This dual-modality YAP inhibition establishes a unified mechanistic framework linking microbial and pharmacological interventions to tumor suppression.
GAP is part of the glycolytic-PPP nexus. The YAP-associated transcription factor TFEB orchestrates PGD (a key enzyme in PPP) transcriptional activation25,26. In HT-29 cells, YAP1 knockdown significantly reduced PGD mRNA expression, whereas YAP1 overexpression enhanced PGD transcript levels (Fig. 7A, B). This transcriptional control occurs through direct promoter binding, as demonstrated by luciferase reporter assays. Dual knockdown of YAP1 and TFEB suppressed wild-type PGD promoter activity, whereas mutation of their cognate binding sites abolished this suppression (Fig. 7C). This confirms that YAP and TFEB cooperatively activate PGD transcription through specific cis-regulatory elements within the promoter. We observed elevated expression of PGD in obesity-associated CRC, and treatment with GAP significantly reduced the expression of PGD (Fig. 7D–F). Knockdown of TPI1 promoted PGD expression, whereas overexpression of TPI1 suppressed it (Fig. 7G, H). Co-treatment of PPP1CA with GAP further decreased PGD expression; however, this regulatory effect was abolished in cells expressing PPP1CA mutants defective in GAP interaction, confirming the necessity of direct molecular engagement (Fig. 7I). In CRC tissues from patients with normal weight and patients with obesity, we detected increased levels of PPP-related metabolites, −6-phosphogluconate and ribose-5-phosphate, in obesity-associated CRC (Fig. 7J–K).
A, B RT-qPCR of PGD mRNA in HT-29 cells with YAP1 knockdown (A) or YAP1 overexpression (B); n = 3 independent experiments. C Luciferase activity of wild-type (WT) or TFEB-binding-site mutant (Mut) PGD promoter reporters in HT-29 cells after knockdown of YAP1 or TFEB; WT, n = 4; Mut, n = 3 independent experiments. D RT-qPCR of PGD mRNA in patient-derived organoids treated with GAP; n = 3 independent experiments. E RT-qPCR of PGD mRNA in HT-29 and RKO cells (GAP versus control); n = 3 independent experiments. F RT-qPCR of PGD mRNA in CRC tissues from patients without obesity (n = 9) and patients with obesity (n = 10). G RT-qPCR of PGD mRNA in HT-29 and RKO cells transfected with TPI1-KD or scrambled control (NC); n = 3 independent experiments. H RT-qPCR of PGD mRNA in HT-29 and RKO cells transfected with TPI1 overexpression (OE) or empty vector; n = 3 independent experiments. I RT-qPCR of PGD mRNA in HT-29 cells transfected with PPP1CA WT or mutant (R132A/R221A) and treated with GAP; n = 5 independent experiments. J Mass spectrometry of 6-phosphogluconate in CRC tissues from patients with normal weight (n = 36) and patients with obesity (n = 46). K Mass spectrometry of ribose-5-phosphate (R5P) in CRC tissues from patients with normal weight (n = 36) and patients with obesity (n = 46). Statistics: two-sided unpaired Student’s t-test (A, B, D–K); two-sided one-way ANOVA with Tukey’s post hoc test (C). Source data are provided as a Source data file.
Inhibition of the PPP limits NADPH production, which is essential for fatty-acid synthesis and redox homeostasis, and reduces ribose-5-phosphate availability for nucleotide biosynthesis, thereby depriving rapidly proliferating CRC cells of both antioxidant capacity and the molecular precursors required for DNA/RNA synthesis (cite p53 regulates biosynthesis through direct inactivation of glucose-6-phosphate dehydrogenase). These findings collectively delineate a mechanism wherein GAP restrains colorectal carcinogenesis by allosterically inhibiting PPP1CA phosphatase activity, thereby sustaining YAP phosphorylation and attenuating its pro-tumorigenic transcriptional program.
Discussion
In this study, we demonstrated that obesity-driven gut microbial dysbiosis disrupts GABAergic signaling and metabolic homeostasis, thereby accelerating CRC progression. Fecal microbiota transplants from patients with obesity significantly accelerated intestinal tumorigenesis in mice compared to transplants from lean CRC patients, coinciding with a marked suppression of the glycolytic enzyme TPI1 in tumors harboring obesity-associated microbiota. Through metagenomic profiling, we identified the loss of key commensals in obesity, notably B. ovatus, a dominant GABA-producing bacterium in hosts with obesity-associated CRC. Restoring B. ovatus profoundly attenuated tumor growth in HFD models, accompanied by recovery of colonic TPI1 expression. These findings underscore that obesity-induced microbial alterations impair GABA-mediated metabolic regulation in the colon, leading to an environment that promotes tumor development.
Our results extend prior evidence linking obesity, gut microbiota, and colon tumorigenesis while highlighting a metabolite-centered mechanism. Obesity-associated microbiome changes have long been implicated in CRC risk via chronic inflammation and oncogenic signaling pathways27,28. Recent studies have also demonstrated that obesity-associated adipose-derived extracellular vesicles can promote colorectal tumorigenesis by enhancing glycolytic reprogramming, further supporting a role for obesity in reshaping tumor metabolism29. However, unlike previous studies focusing on inflammatory mediators or hormonal drivers30,31, we revealed that disruption of a specific microbial neurotransmitter pathway, GABA signaling, directly contributes to metabolic reprogramming in tumors. Earlier work noted that GABA derived from bacteria was lower in patients with CRC32, but a causal link was elusive. By showing that microbial GABA deficiency drives tumor growth and that restoring GABAergic signals reverses this effect, our study provides a mechanistic bridge beyond this correlation. This emphasis on the metabolic role of microbe-derived GABA marks a significant advance over the prior focus on adipokines or insulin resistance in obesity-related CRC33.
Mechanistically, we found that microbial GABA constrains CRC progression via the host GABABR and downstream metabolic regulation. GABABR activation induces TPI1 expression, which is suppressed in obesity-associated tumors. Pharmacological investigation showed that baclofen mimicked GABA’s tumor-suppressive effect by upregulating TPI1, whereas a GABAA agonist had no effect; conversely, GABABR blockade abolished GABA-induced TPI1 upregulation. This establishes GABABR as the key mediator of microbiota-derived GABA signaling in colonic epithelial cells. Crucially, knockdown of TPI1 disrupted GABA’s anti-proliferative effect of GABA on CRC cells, confirming that the restoration of this metabolic enzyme is essential for GABA’s inhibitory action of GABA. GABABR activation may engage pathways, such as cAMP/PKA34,35, which could enhance TPI1 transcription or stability, though the exact regulators await discovery.
We propose that GABABR-driven TPI1 upregulation restores the levels of the glycolytic intermediate GAP, which may activate metabolic checkpoints that dampen oncogenic pathways such as the Hippo/YAP cascade. Beyond tumor-intrinsic effects, GABAergic signaling likely influences the tumor microenvironment; GABA can modulate intestinal immunity and barrier integrity36,37, potentially reducing pro-inflammatory cues that foster tumor growth. In addition, GABAB receptor–Hippo/YAP signaling coupling has been observed in other biological contexts such as vascular remodeling, suggesting that this regulatory axis may represent a more general signaling principle across tissues38. Thus, microbial GABA orchestrates a multifaceted tumor-suppressive program, aligning metabolic and microenvironmental factors to counteract the pro-tumor effects of obesity.
While our mechanistic experiments were primarily conducted under normoxic conditions, HIF1α activity is known to be inducible not only by hypoxia but alsoort a model in which GABA–GABABR signaling promotes TPI1 expression through PI3K-dependent stabilization of HIF1α under normoxic conditions. Future studies will be required to determine how oxygen availability modulates this regulatory axis in vivo
Our investigation revealed that dysregulation of the gut microbial GABA–TPI1 axis is an essential link between obesity and faster CRC progression. Obesity affects CRC through hormonal and inflammatory pathways and metabolic processes39,40,41 that result from the loss of beneficial microbial metabolites. The gut microbiota generates multiple metabolites, such as short-chain fatty acids and polyamines42,43, which may play a role in obesity-Related CRC, their relationship with GABA signaling has not yet been examined. Future research should explore how GABA interacts with metabolites such as butyrate and polyamines, evaluate the therapeutic potential of GABA analogs, GABABR agonists, and probiotics including B. ovatus in obesity-associated CRC, and integrate spatial metabolomics with spatial microbiome profiling to resolve metabolic gradients and microbe–metabolite interactions within the tumor microenvironment, thereby providing a more comprehensive understanding of how obesity-associated microbial dysbiosis spatially shapes CRC progression. Our study reveals metabolite-mediated interactions between gut microbes and host pathways and supports microbiome-focused intervention strategies for obesity-linked CRC.
Methods
All research involving human participants and animals complied with all relevant ethical regulations. The human study protocol was reviewed and approved by the Research Ethics Committee of Shandong University (approval number: ECSBMSSDU2022-1-110), and all participants provided written informed consent before inclusion in the study. All animal experiments were approved by the Animal Experimentation Ethics Committee of Shandong University (approval number: ECSBMSSDU2022-2-169)
Human study population and sample collection
Participants in this study were recruited from the Qilu Hospital of Shandong University. Patients diagnosed with CRC were stratified based on BMI, with individuals having a BMI ≥ 30 kg/m² classified as patients with obesity and those with a BMI < 25 kg/m² classified as normal-weight CRC patients. Detailed clinical characteristics of all enrolled patients, including sex, age, body weight, waist circumference, BMI, tumor stage, treatment history, and recurrence status, are summarized in Supplementary Tables 1 and 2.
Male ApcMin/+ mice (Mus musculus, 6–8 weeks old, C57BL/6 J background) and male BALB/c mice (Mus musculus, 6–8 weeks old) were used in this study. Animals were housed under specific pathogen-free (SPF) conditions with free access to food and water under a 12-h light/12-h dark cycle at 22 ± 2 °C and 50–60% relative humidity
Human-derived CRC organoid culture
The CRC tissues were minced into fine fragments. The fragments were incubated with a gentle cell dissociation reagent (Stem Cell, #100-0485) to dissociate the CRC tissue fragments. The suspension was filtered through a 70 µm cell strainer into a new 50 mL centrifuge tube and centrifuged at 4 °C, 300×g for 5 min, and the pellet was resuspended in DMEM/F12 medium. A total of 50 µL of the Matrigel-cell suspension was seeded into each well of a 24-well culture plate. The plate was incubated for 18 min at 37 °C to allow the Matrigel to solidify, followed by the addition of 400 µL complete culture medium per well. Cultures were maintained in a cell incubator under standard conditions for subsequent experiments.
Culture of BO and CRC cell lines
BO ATCC 8483 was obtained from the American Type Culture Collection (ATCC, Manassas, VA, USA). Primary isolation was performed by streaking frozen glycerol stock onto Bacteroides Bile Esculin (BBE) agar plates (BD Biosciences, USA), supplemented with 5% defibrinated sheep blood and 0.05% (w/v) L-cysteine under strict anaerobic conditions (85% N₂, 10% CO₂, 5% H₂) at 37 °C for 48–72 h. A single colony with typical morphology (opaque, circular, 1–2 mm diameter) was inoculated into pre-reduced Brain Heart Infusion (BHI) broth (Oxoid, UK), supplemented with 0.05% (w/v) L-cysteine (Sigma-Aldrich, USA) and 1 μg/mL vitamin K₁. Cultures were incubated anaerobically at 37 °C on a Whitley A35 anaerobic workstation (Don Whitley Scientific, UK) with agitation at 150 rpm. Subculturing was performed at 24-h intervals by transferring 2% (v/v) inoculum to fresh medium. For long-term storage, bacterial pellets harvested by centrifugation (6000×g, 10 min, 4 °C) were resuspended in BHI broth containing 20% (v/v) glycerol and stored at −80 °C. BO ATCC 8483 was streaked onto an agar plate and incubated under anaerobic conditions at 37 °C until distinct colonies were observed. A single colony was carefully selected and inoculated into BHI medium supplemented with 0.05% L-cysteine. The bacterial culture was maintained at 37 °C in an anaerobic chamber to ensure optimal growth and propagation of B. ovatus. The B. ovatusΔgadB strain was generated by targeted deletion of the gadB locus in B. ovatus ATCC 8483 and validated before use. The oligonucleotide sequences used for strain construction are kogadB-f1-F: tatgacatttacagttgcgggaggagatagacaaggaaag, kogadB-f1-R: actaatttgtttttttaaaggtttagggc, kogadB-f2-F: ttaaaaaaacaaattagtggaatatccaactcctacccg, kogadB-f2-R: aaaaacaataggccacatcaacaacggtgatatggttg.
Cell culture and maintenance
Human CRC cell lines HT-29, RKO and HCT116, the human normal colonic epithelial cell line CCD841, the mouse CRC cell line CT26 and the human embryonic kidney cell line 293T were used in this study. HT-29, RKO, HCT116, CCD841, CT26 and 293 T cells were obtained from the Chinese Academy of Sciences (Shanghai, China). All cell lines were authenticated by short tandem repeat profiling and tested negative for mycoplasma contamination. Cells were cultured in Dulbecco’s modified Eagle medium (DMEM, Gibco) supplemented with 10% fetal bovine serum (FBS, HyClone) and maintained at 37 °C in a humidified 5% CO₂ atmosphere.
Mouse models with HFD
To establish an obesity-associated CRC model, male ApcMin/+ mice (6–8 weeks old) were randomly assigned to two groups and fed either a standard chow diet or an HFD (60% kcal from fat). Mice had ad libitum access to food and water throughout the experiment. HFD was administered for 8–12 weeks to induce obesity
B.ovatus treatment in animal models
Male ApcMin/+ mice and male BALB/c mice (6–8 weeks old, species: Mus musculus) were used in the animal experiments. Only male mice were used throughout the animal studies to minimize variability associated with sex-dependent biological differences and to maintain consistency across experimental groups. ApcMin/+ mice were treated with antibiotics (ampicillin 0.2 g/L, neomycin 0.2 g/L, metronidazole 0.2 g/L, and vancomycin 0.1 g/L) in drinking water for 1 week to deplete gut microbiota. After antibiotic treatment, mice were randomly assigned to two groups: PBS (control) and B. ovatus (2 × 10⁷ CFU per mouse), and received oral gavage for 1 week, followed by a 1-week washout period and then an additional week of gavage. For the microbiota intervention experiment, mice were pretreated with a broad-spectrum antibiotic cocktail from 10 to 12 weeks of age to deplete gut microbiota. Subsequently, mice received oral gavage of either sterile PBS or BO once weekly from 13 to 15 weeks of age. Mice were sacrificed at 16 weeks of age for further analysis (Supplementary Fig. S5A). Fecal samples were regularly collected for microbiota analysis. For the subcutaneous CT26 tumor model, BALB/c mice were also treated with antibiotics for one week, after which they were subcutaneously injected with 8 × 10⁴ CT26 cells. Mice were then randomly divided into PBS and B. ovatus groups (2 × 10⁷ CFU per mouse), receiving oral gavage of B. ovatus for 1 week, followed by a 1-week washout and another week of gavage. Body weight was monitored weekly throughout the experiment, and tumor volume was measured using calipers (V = (length × width2)/2). Fecal samples were collected regularly for microbiota analysis. All procedures adhered to the guidelines approved by the Animal Experimentation Ethics Committee of Shandong University (approval number: ECSBMSSDU2022-2-169).
GABA treatment in animal models
For oral GABA administration, male ApcMin/+ mice (6–8 weeks old, species: Mus musculus) were randomly divided into the drinking water control group and the GABA treatment group (2 mg/mL). Mice were maintained under SPF conditions with controlled temperature and a 12 h light/dark cycle and had ad libitum access to standard chow or HFD and water unless otherwise indicated. GABA (2 mg/mL) was administered via oral gavage every two days starting at 12 weeks of age, while control groups received an equal volume of sterile water. All mice were sacrificed at 16 weeks of age, and tumor burden was subsequently evaluated (Supplementary Fig. S7B). Tumor growth was monitored throughout the experiments, and animals were euthanized before reaching the humane endpoints approved by the institutional ethics committee. The maximal tumor size permitted by the Animal Experimentation Ethics Committee of Shandong University was not exceeded in any experiment.
Experimental and humane endpoints
For the ApcMin/+ mouse model, animals were euthanized at the predetermined experimental endpoint of 16 weeks of age for evaluation of intestinal tumor burden
For the subcutaneous xenograft model, animals were euthanized at the predetermined study endpoint based on the treatment schedule. Tumor growth and animal condition were monitored throughout the experiment
Targeted energy metabolomics
Targeted energy metabolomics was performed on CRC tissue samples from patients with normal weight and CRC and patients with obesity and CRC. A total of 82 CRC tissue samples were analyzed. Quality-control samples were prepared by pooling equal aliquots from all study samples and were used to monitor LC-MS/MS system stability. According to the final clinical grouping used in this study, metabolomic comparisons were performed between patients with normal weight and CRC, n = 36, and patients with obesity and CRC, n = 46, as summarized in Supplementary Table 1. For metabolite extraction, approximately 50 mg of tissue was mixed with two steel beads and 500 μL pre-cooled 80% methanol/water, homogenized, supplemented with another 500 μL pre-cooled 80% methanol/water, sonicated on ice for 20 min, incubated at −20 °C for 1 h, and centrifuged at 16,000×g for 20 min at 4 °C. A total of 950 μL supernatant was collected and dried under vacuum. Before LC-MS/MS analysis, dried extracts were reconstituted in 100 μL pre-cooled 50% methanol and centrifuged at 20,000×g for 15 min at 4 °C. The supernatant was used for analysis. Chromatographic separation was performed using a Shimadzu Nexera X2 LC-30AD ultra-high-performance liquid chromatography system with a Phenomenex Kinetex F5 column, 2.6 μm, 3 × 100 mm. Mobile phase A was 10 mM ammonium acetate, and mobile phase B was acetonitrile. Samples were kept at 4 °C in the autosampler. The column temperature was 30 °C, the flow rate was 200 μL/min, and the injection volume was 5 μL. The gradient was as follows: 0–3 min, 0% B; 3–10 min, 0–95% B; 10–12 min, 95% B; 12–13 min, 95–0% B; and 13–14 min, 0% B. Mass spectrometry was performed on an AB SCIEX QTRAP 6500+ mass spectrometer in positive and negative electrospray ionization modes using multiple reaction monitoring. The ESI source parameters were as follows. For positive ion mode: source temperature, 500 °C; ion source gas 1, 55 psi; ion source gas 2, 60 psi; curtain gas, 35 psi; ion spray voltage, 5500 V. For negative ion mode: source temperature, 500 °C; ion source gas 1, 55 psi; ion source gas 2, 60 psi; curtain gas, 35 psi; ion spray voltage, −4500 V. Chromatographic peak areas and retention times were extracted using MultiQuant software. Metabolites were identified and quantified using authentic standards, retention-time correction and MRM ion-pair information.
13C-glucose metabolic flux analysis
Single-cell suspensions were prepared from cancerous tissues of patients with obesity and CRC (BMI ≥ 30 kg/m²) and patients with normal weight and CRC (BMI < 25 kg/m²). Following a 24-h incubation with 13C-glucose, isotope tracing and metabolic flux analysis were performed. Chromatographic separation of metabolites was carried out using a Thermo Fisher Scientific Ultimate 3000 liquid chromatography system, coupled with a C18 column (2.1 mm × 100 mm, 1.7 μm). The column was maintained at a temperature of 40 °C, with an injection volume of 3 μL and a flow rate of 0.4 mL/min. A linear gradient elution method was employed for the separation of metabolites. For mass spectrometric analysis, a Thermo Fisher Scientific Q Exactive Quadrupole-Orbitrap mass spectrometer (QE) was used to ionize metabolites and acquire mass spectrometric data. Ionization was performed in positive ion mode using a heated electrospray ionization (HESI) source (HESI+).
Protein extraction and western blot analysis
Total protein was extracted from tissues or cells using RIPA lysis buffer, and protein concentrations were quantified using the BCA assay. Equal amounts of protein were separated by SDS-PAGE and transferred onto PVDF membranes. The membranes were blocked with 5% skim milk at room temperature for 2 h, followed by incubation with primary antibodies at 4 °C overnight. The primary antibodies used included TPI1 (Proteintech Group, #10713-1-AP, 1:1000), GAPDH (Proteintech Group, #60004-1-Ig, 1:1000), Aldolase (Proteintech #11217-1-AP, 1:1000), β-Tubulin (Abcam, #ab6046, 1:2000), Phospho-YAP (Ser127) (Cell Signaling Technology, #13619), YAP (Abclonal, #A19134, 1:1000), PPP1CA (Abclonal, #A24288, 1:1000), and PGD (Proteintech Group, #22241-1-AP, 1:1000). After washing, the membranes were incubated with secondary antibodies at room temperature for 1 h. Protein bands were visualized using ECL detection reagents, and band intensities were quantified based on gray value analysis.
RNA extraction and quantitative real-time PCR (RT-qPCR)
Total RNA was extracted from tissues or cells using Trizol reagent, and the concentration and quality of RNA were assessed. cDNA synthesis was performed using 1 µg of total RNA with the RT reagent Kit and gDNA Eraser (Takara, Japan) according to the manufacturer’s instructions. The reverse transcription reaction was catalyzed by reverse transcriptase to synthesize cDNA complementary to mRNA. RT-qPCR was conducted using SYBR Green (Accurate Biotechnology (Hunan) CO., LTD, Changsha, China) for the detection and quantification of target gene expression. Fluorescence signals were monitored in real time, and relative expression levels were calculated using the 2−ΔΔCt method. The primer sequences used for RT-qPCR are listed in Supplementary Data 1.
Lentiviral vector construction and stable cell line generation
Human YAP1 overexpression and TPI1 overexpression plasmids were achieved using a commercially generated lentiviral expression construct from LST Bio-tech ShanDong Co., Ltd (Jinan, China). TPI1-specific shRNA lentiviral constructs were also commercially generated by GeneChem (Shanghai, China). Cells were infected with the corresponding overexpression or knockdown lentivirus according to the manufacturer’s instructions to establish stable cell lines
Plasmids and reporter constructs
Human PPP1CA expression plasmids were obtained from LST Bio-tech ShanDong Co., Ltd. Full-length human PPP1CA (NM_002708) was cloned into the pcDNA3.1-3xFlag-C vector to generate the PPP1CA wild-type expression plasmid. The PPP1CA mutant plasmid carrying R132A and R221A substitutions, PPP1CA-MUT(R132A, R221A), was generated in the same pcDNA3.1-3xFlag-C backbone. Human PGD promoter wild-type and mutant reporter plasmids were also obtained from LST Bio-tech ShanDong Co., Ltd. (Jinan, China) and cloned into the pGL3-Basic luciferase reporter vector. In the PGD promoter mutant reporter, the wild-type motif GCGCACAGGAC was replaced by TAGGATGATA.
GAP monoclonal antibody production
Male BALB/c mice (6–8 weeks old, species: Mus musculus) were immunized with 50–100 µg of antigen per injection, administered every 14 days over 4–5 immunization cycles. Serum samples were collected at designated time points for analysis to identify the best responders for fusion. ELISA was used to evaluate antibody titers and select the fusion candidate mouse. Following fusion, cell lines were screened for antigen specificity using ELISA. The best-reacting clones were selected and expanded. Positive single-cell clones were isolated, and ascitic fluid was generated by injecting the cell lines into the peritoneal cavity of mice. Once the ascitic fluid was harvested, antibodies were purified using Protein A/G affinity chromatography.
DARTS assay
A total of 200 µL of cell protein lysate was divided into two groups: one group received 2 µL DMSO, and the other received 2 µL of 50 mg/mL GAP small-molecule stock solution. Both groups were incubated at room temperature for 1 h. Pronase enzyme digestion was performed at an appropriate concentration for 30 min, and the reaction was terminated by adding a protease inhibitor. The samples were subjected to SDS-PAGE for protein separation. The resulting gel strips were destained, reduced, alkylated, and subjected to enzymatic digestion. The resulting peptides were extracted, desalted, and vacuum-dried. The dried peptide samples were reconstituted with formic acid (FA), and equal volumes of each sample were analyzed. Peptide separation was performed using the EASY-nLC1200 system (Thermo Scientific, USA) with an analytical C18 column (1.9 µm, 75 µm × 15 cm) at a flow rate of 300 nL/min.
Molecular docking simulation
The molecular structure of GAP was constructed using ChemBioDraw Ultra 14.0 and subsequently optimized with ChemBio3D Ultra 14.0 utilizing the MMFF94 force field. The optimized 3D structure was saved for downstream analysis. The 3D structure of the PPP1CA protein (PDB ID: 5ZQV) was obtained from the RCSB Protein Data Bank. Both the PPP1CA protein and GAP were converted into the PDBQT format using AutoDockTools 1.5.6. Molecular docking studies were carried out using AutoDock Vina 1.1.2 to investigate the interaction between the PPP1CA protein and GAP. The active binding pocket of the PPP1CA protein was defined with the following grid box parameters: center_x = 11.137, center_y = 3.016, center_z = −5.892, size_x = 15, size_y = 15, size_z = 15. To improve the accuracy of the simulation, the exhaustiveness parameter was set to 16, while all other parameters were maintained at their default settings unless otherwise stated. The docking pose with the highest binding affinity (lowest binding energy) was selected for further analysis. Visualization and detailed analysis of the docking results were performed using PyMOL 1.7.6.
Statistics and reproducibility
All statistical analyses were performed in GraphPad Prism 8.0. Data are presented as mean ± SEM unless otherwise stated. The sample size (n), unit of study, and statistical test are stated in each figure legend; n refers to biologically independent replicates, including mice, patients, organoid cultures, or independent experiments, unless otherwise indicated. No statistical method was used to predetermine sample size; sample sizes were based on those commonly used in the field and on pilot experiments. No data from newly generated experiments were excluded from the analyses. Public metagenomic datasets were included according to predefined quality-control criteria. Animals or samples were assigned to experimental groups as described in the relevant “Methods” sections. Investigators were not blinded to allocation during experiments or outcome assessment. Data distribution was assessed using the Shapiro–Wilk test. Comparisons between two groups used a two-sided unpaired Student’s t-test; comparisons among three or more groups used one-way or two-way ANOVA, as appropriate, followed by Tukey’s multiple-comparisons test. Differences in microbial relative abundance were assessed using the two-sided Wilcoxon rank-sum test. For small sample sizes, nonparametric tests were additionally applied where appropriate to confirm robustness. P < 0.05 was considered statistically significant, and exact P values are provided in the Source data file. All micrographs, immunoblots, immunohistochemistry and immunofluorescence images are representative of the number of biologically independent samples indicated in the corresponding figure legend, and similar results were obtained across all repeats. Source data are provided with this paper. Sex was considered in the study design. Only male mice were used throughout the animal experiments to minimize biological variability and to maintain consistency across experimental groups. Therefore, sex was not analyzed as an experimental variable.
Reporting summary
Further information on research design is available in the Nature Portfolio Reporting Summary linked to this article
Data availability
The targeted metabolomics raw data generated in this study have been deposited in the MassIVE database under accession code MSV000102059. The proteomics data generated in this study have been deposited in the PRIDE repository under accession code PXD069744. The public fecal metagenomic sequencing data used in this study are available from the European Nucleotide Archive, NCBI Sequence Read Archive, and DNA Data Bank of Japan under accession codes ERP005534, ERP008729, PRJEB10878, PRJEB12449, PRJNA389927, PRJEB27928, SRP136711, DRA006684, and DRA008156. The source data underlying the graphs and uncropped blot images generated in this study are provided as the Source data file. All other data supporting the findings of this study are available within the Article, its Supplementary Information, and the Source data file. Source data are provided with this paper.
References
Gao, H., Lu, Q. & Zhang, J. Factors affecting the postoperative survival rate of obese Asian patients with endometrial cancer. J. Obstet. Gynaecol.45, 2480856 (2025)
Font-Burgada, J., Sun, B. & Karin, M. Obesity and cancer: the oil that feeds the flame. Cell Metab.23, 48–62 (2016)
Li, H., Boakye, D., Chen, X., Hoffmeister, M. & Brenner, H. Association of body mass index with risk of early-onset colorectal cancer: systematic review and meta-analysis. Am. J. Gastroenterol.116, 2173–2183 (2021)
Lyu, Q. et al. A brain-to-gut signal controls intestinal fat absorption. Nature634, 936–943 (2024)
Sa, M. et al. Hypothalamic GABRA5-positive neurons control obesity
Strandwitz, P. et al. GABA-modulating bacteria of the human gut microbiota. Nat. Microbiol4, 396–403 (2019)
Wang, H., Zhang, H., Sun, Z., Chen, W. & Miao, C. GABAB receptor inhibits tumor progression and epithelial-mesenchymal transitionnt. J. Biol. Sci.17, 1953–1962 (2021)
Wang, G. et al. New strategies for targeting glucose metabolism-mediated acidosis for colorectal cancer therapy. J. Cell Physiol.234, 348–368 (2018)
Shi, J., Shen, Y. & Zhang, J. Emerging roles of small extracellular vesicles in metabolic reprogramming and drug resistance in cancers. Cancer Drug Resist.7, 38 (2024)
Park, J. et al. Short-chain fatty acids induce both effector and regulatory T cells by suppression of histone deacetylases and regulation of the mTOR-S6K pathway. Mucosal Immunol.8, 80–93 (2015)
Li, R. et al. Obesity, rather than diet, drives epigenomic alterations in colonic epithelium resembling cancer progression. Cell Metab.19, 702–711 (2014)
Li, R. et al. Transcriptome and DNA methylome analysis in a mouse model of diet-induced obesity predicts increased risk of colorectal cancer. Cell Rep.22, 624–637 (2018)
Ge, T. et al. The role of the pentose phosphate pathway in diabetes and cancer. Front. Endocrinol. (Lausanne)11, 365 (2020)
Saltiel, A. R. & Olefsky, J. M. Inflammatory mechanisms linking obesity and metabolic disease. J. Clin. Invest.127, 1–4 (2017)
Fu, T. et al. FXR regulates intestinal cancer stem cell proliferation. Cell176, 1098–1112.e1018 (2019)
Turnbaugh, P. J. et al. An obesity-associated gut microbiome with increased capacity for energy harvest. Nature444, 1027–1031 (2006)
Aron-Wisnewsky, J., Warmbrunn, M. V., Nieuwdorp, M. & Clément, K. Metabolism and metabolic disorders and the microbiome: the intestinal microbiota associated with obesity, lipid metabolism, and metabolic health-pathophysiology and therapeutic strategies. Gastroenterology160, 573–599 (2021)
Rothschild, D. et al. Environment dominates over host genetics in shaping human gut microbiota. Nature555, 210–215 (2018)
Belelli, D. et al. From bugs to brain: unravelling the GABA signalling networks in the brain-gut-microbiome axis. Brain. https://doi.org/10.1093/brain/awae413 (2024)
Anju, T. R., Abraham, P. M., Antony, S. & Paulose, C. S. Alterations in cortical GABAB receptors in neonatal rats exposed to hypoxic stress: role of glucose, oxygen, and epinephrine resuscitation. Mol. Cell Biochem.343, 1–11 (2010)
Rashid, M. et al. Up-down regulation of HIF-1α in cancer progression. Gene798, 145796 (2021)
Obata, A. et al. Vascular endothelial PDPK1 plays a pivotal role in the maintenance of pancreatic beta cell mass and function in adult male mice. Diabetologia62, 1225–1236 (2019)
Chen, Z. et al. CircGPRC5A enhances colorectal cancer progress by stabilizing PPP1CA and inducing YAP dephosphorylation. J. Exp. Clin. Cancer Res.42, 334 (2023)
Guo, Y. et al. PPP1CA/YAP/GS/Gln/mTORC1 pathway activates retinal Müller cells during diabetic retinopathy. Exp. Eye Res.210, 108703 (2021)
Zhao, J. F. et al. Targeted dephosphorylation of TFEB promotes its nuclear translocation. iScience27, 110432 (2024)
Rabinovich-Nikitin, I. & Kirshenbaum, L.A. YAP/TFEB pathway promotes autophagic cell death and hypertrophic cardiomyopathy in lysosomal storage diseases. J. Clin. Invest. https://doi.org/10.1172/jci146821 (2021)
Singh, S. et al. Implication of obesity and gut microbiome dysbiosis in the etiology of colorectal cancer. Cancers (Basel). https://doi.org/10.3390/cancers15061913 (2023)
Greathouse, K. L. et al. Gut microbiome meta-analysis reveals dysbiosis is independent of body mass index in predicting risk of obesity-associated CRC. BMJ Open Gastroenterol.6, e000247 (2019)
Haque, P. S. et al. Obese adipose tissue-derived extracellular vesicles enriched with glycolytic cargo promote colorectal cancer tumorigenesis. Cancer Lett.635, 218104 (2025)
Ye, P., Xi, Y., Huang, Z., & Xu, P. Linking obesity with colorectal cancer: epidemiology and mechanistic insights. Cancers (Basel)12, 1408 (2020)
Quail, D. F. & Dannenberg, A. J. The obese adipose tissue microenvironment in cancer development and progression. Nat. Rev. Endocrinol.15, 139–154 (2019)
Keane, J. M. et al. Interplay between microbial-derived GABA and host GABA receptor signaling collectively influence the tumorigenic function of GABA in colon cancer. Pharm. Res. Perspect.12, e1226 (2024)
Uyar, G. O. & Sanlier, N. Association of adipokines and insulin, which have a role in obesity, with colorectal cancer. Eurasia. J. Med.51, 191–195 (2019)
Bony, G. et al. Non-hyperpolarizing GABAB receptor activation regulates neuronal migration and neurite growth and specification by cAMP/LKB1. Nat. Commun.4, 1800 (2013)
Priest, C. A. & Puche, A. C. GABAB receptor expression and function in olfactory receptor neuron axon growth. J. Neurobiol.60, 154–165 (2004)
Liu, N. et al. Enteric GABAergic neuron-derived γ-aminobutyric acid initiates expression of Igfbp7 to sustain ILC3 homeostasis. Nat. Immunol.26, 404–415 (2025)
Koh, W., Kwak, H., Cheong, E. & Lee, C. J. GABA tone regulation and its cognitive functions in the brain. Nat. Rev. Neurosci.24, 523–539 (2023)
Chen, B. et al. The inhibition of γ-aminobutyric acid B1 receptor regulates angiogenesis1 (2024)
Jones, A.N., Scheurlen, K.M., Macleod, A., Simon, H.L., & Galandiuk, S. Obesity and inflammatory factors in the progression of early-onset colorectal cancer. Cancers (Basel). https://doi.org/10.3390/cancers16071403 (2024)
Wolf, A. M. D. et al. Colorectal cancer screening for average-risk adults: 2018 guideline update from the American Cancer Society. CA Cancer J. Clin.68, 250–281 (2018)
Spaander, M. C. W. et al. Young-onset colorectal cancer. Nat. Rev. Dis. Prim.9, 21 (2023)
Tsvetikova, S. A. & Koshel, E. I. Microbiota and cancer: host cellular mechanisms activated by gut microbial metabolites. Int. J. Med. Microbiol.310, 151425 (2020)
Bansal, T., Alaniz, R. C., Wood, T. K. & Jayaraman, A. The bacterial signal indole increases epithelial-cell tight-junction resistance and attenuates indicators of inflammation. Proc. Natl. Acad. Sci. USA107, 228–233 (2010)
Acknowledgements
We thank the Translational Medicine Core Facility of Shandong University for consultation and instrument availability that supported this work
Funding
This study was supported by the National Natural Science Foundation of China grant 32271172 and 32471177 and the Distinguished Taishan Scholars in Climbing Plan (tspd20210321) (to Jx. Li). This work was supported in part by the National Natural Science Foundation of China grant 82472851 and the Shandong Provincial Natural Science Foundation (ZR2024MH052) (to W. Guo). This work was supported in part by the National Natural Science Foundation of China grant 82570648 (to X. Wang). This work was supported in part by the Jiangsu Specially-Appointed Professor Program and the antitumor new drug rapid translation public service platform of Jiangsu Province (BM2023002) (to D. Chen).
Author information
Author notes
These authors contributed equally: Wei Guo, Kaiyue Sun, Xia Wang
Authors and Affiliations
Department of Physiology, School of Basic Medical Sciences, Cheeloo College of Medicine, Shandong University, Jinan, China
Wei Guo, Kaiyue Sun, Xia Wang, Mengmeng Li, Zheng Li, Yi Yin, Tengfei Ma, Yikun Li, Jianbo Liu, Jiahao Zhang, Cuiyu Zhang, Panpan Feng, Ruijie Ma, Jiayi Ren, Jie Liu & Jingxin Li
Department of Colorectal Surgery, Department of General Surgery, Qilu Hospital, Shandong University, Jinan, China
Wei Guo, Tengfei Ma & Jiahao Zhang
Department of Neurosurgery, Children’s Hospital Affiliated to Shandong University (Jinan Children’s Hospital), Jinan, China
Xizan Yue
State Key Laboratory of Microbial Technology, Shandong University, Qingdao, China
Xiaoning Xu & Xiang Gao
Department of Systems Biomedicine, School of Basic Medical Sciences, Shandong University, Jinan, China
Changan Liu
Institute of Clinical Molecular Biology, University Hospital Schleswig-Holstein, Kiel, Germany
Dawei Chen
School of Basic Medicine and Clinical Pharmacy, China Pharmaceutical University, Nanjing, China
Dawei Chen
Institute of Translational Medicine, China Pharmaceutical University, Nanjing, China
Dawei Chen
Authors
- Wei GuoView author publications
Search author on:PubMed Google Scholar
- Kaiyue SunView author publications
Search author on:PubMed Google Scholar
- Xia WangView author publications
Search author on:PubMed Google Scholar
- Mengmeng LiView author publications
Search author on:PubMed Google Scholar
- Zheng LiView author publications
Search author on:PubMed Google Scholar
- Xizan YueView author publications
Search author on:PubMed Google Scholar
- Yi YinView author publications
Search author on:PubMed Google Scholar
- Tengfei MaView author publications
Search author on:PubMed Google Scholar
- Yikun LiView author publications
Search author on:PubMed Google Scholar
- Xiaoning XuView author publications
Search author on:PubMed Google Scholar
- Jianbo LiuView author publications
Search author on:PubMed Google Scholar
- Jiahao ZhangView author publications
Search author on:PubMed Google Scholar
- Cuiyu ZhangView author publications
Search author on:PubMed Google Scholar
- Panpan FengView author publications
Search author on:PubMed Google Scholar
- Ruijie MaView author publications
Search author on:PubMed Google Scholar
- Jiayi RenView author publications
Search author on:PubMed Google Scholar
- Jie LiuView author publications
Search author on:PubMed Google Scholar
- Changan LiuView author publications
Search author on:PubMed Google Scholar
- Xiang GaoView author publications
Search author on:PubMed Google Scholar
- Dawei ChenView author publications
Search author on:PubMed Google Scholar
- Jingxin LiView author publications
Search author on:PubMed Google Scholar
Contributions
Jx.L., W.G., D.C., K.S., and X.W. conceived and designed the study and wrote the draft manuscript. K.S., X.Y., Y.Y., T.M., Jb.L., M.L., and Z.L. performed the experiments. Yk.L., J.Z., and W.G. collected the clinical samples. J.R., R.M., and Je.L. were responsible for the ApcMin/+ mouse experiments. C.Z. and P.F. performed the 13C-isotopomer-resolved metabolic flux analysis and western blotting of CRC tissues. W.G. and C.L. performed the gut microbiota data analysis and contributed to the interpretation of the results. Jx.L., K.S., X.W., and D.C. analyzed the data and prepared the figures. X.G. and X.N.X. constructed the B. ovatusΔgadB strain. All authors reviewed and approved the final manuscript.
Ethics declarations
Competing interests
The authors declare no competing interests
Peer review
Peer review information
Nature Communications thanks the anonymous, reviewers for their contribution to the peer review of this work. A peer review file is available
Additional information
Publisher’s note Springer Nature remains neutral with regard to jurisdictional claims in published maps and institutional affiliations
Supplementary information
Supplementary Information (download PDF )
Description of Additional Supplementary File (download PDF )
Supplementary Data 1 (download XLS )
Supplementary Data 2 (download XLSX )
Reporting Summary (download PDF )
Transparent Peer Review file (download PDF )
Source data
Source Data (download XLSX )
Rights and permissions
Open Access This article is licensed under a Creative Commons Attribution-NonCommercial-NoDerivatives 4.0 International License, which permits any non-commercial use, sharing, distribution and reproduction in any medium or format, as long as you give appropriate credit to the original author(s) and the source, provide a link to the Creative Commons licence, and indicate if you modified the licensed material. You do not have permission under this licence to share adapted material derived from this article or parts of it. The images or other third party material in this article are included in the article’s Creative Commons licence, unless indicated otherwise in a credit line to the material. If material is not included in the article’s Creative Commons licence and your intended use is not permitted by statutory regulation or exceeds the permitted use, you will need to obtain permission directly from the copyright holder. To view a copy of this licence, visit http://creativecommons.org/licenses/by-nc-nd/4.0/.
About this article
Cite this article
Guo, W., Sun, K., Wang, X. et al. Obesity-driven microbial GABA depletion promotes metabolic rewiring and colorectal cancer progression.
Nat Commun17, 7404 (2026). https://doi.org/10.1038/s41467-026-76079-1
Received:14 October 2025
Accepted:20 July 2026
Published:27 July 2026
Version of record:27 July 2026
DOI
:https://doi.org/10.1038/s41467-026-76079-1
