


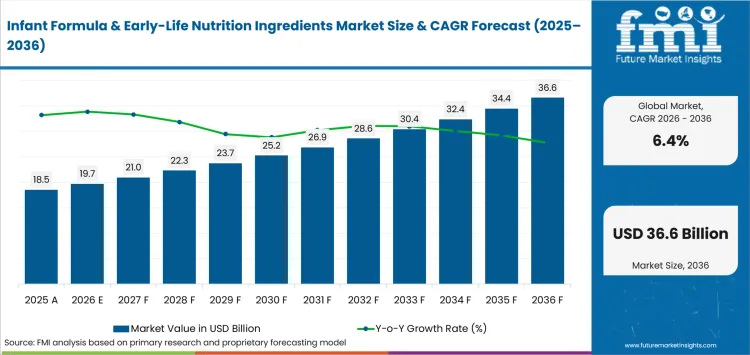
Infant Formula & Early-Life Nutrition Ingredients Market : Global Industry Analysis and Opportunity Assessment, 2036
Infant Formula & Early-Life Nutrition Ingredients Market : Global Industry Analysis and Opportunity Assessment, 2036
Buy Now
Infant Formula & Early-Life Nutrition Ingredients Market is segmented by Ingredient, Product, Form, and Region. Forecast Period from 2026 to 2036
- Market Size (2026): USD 19.7 Bn
- Forecast (2036): USD 36.6 Bn
- CAGR (2026 to 2036): 6.4%
| Metric | Value |
|---|---|
| 2025 Market Size | USD 18.5 billion |
| 2026 Market Size | USD 19.7 billion |
| 2036 Market Size | USD 36.6 billion |
| Forecast CAGR (2026-2036) | 6.4% |
| Leading Ingredient | Dairy Proteins |
| Dairy Proteins Share (2026) | 32.0% |
| Leading Product | Infant Formula |
| Infant Formula Share (2026) | 45.0% |
| Leading Form | Powder |
| Powder Share (2026) | 34.7% |
Page last updated on:July 29, 2026
Reviewed By Nandini Roy Choudhury
Cite this Report
Infant Formula & Early-Life Nutrition Ingredients Market
https://www.futuremarketinsights.com/reports/infant-formula-and-early-life-nutrition-ingredients-market
License
Methodology
How big is Infant Formula & Early-Life Nutrition Ingredients Market in 2026?
USD 19.7 billion in 2026 and USD 36.6 billion by 2036 at a 6.4% CAGR
Sales in infant formula & early-life nutrition ingredients market are projected to increase from USD 19.7 billion in 2026 to USD 36.6 billion by 2036 at a 6.4% CAGR. Formula manufacturers need inputs that preserve nutrient composition and microbial safety across repeated commercial batches. In July 2026, FDA asked the infant formula industry to apply greater vigilance during ingredient and source selection for powdered products. The action makes source traceability a direct qualification requirement for every commercial formula production program.
United States developers must register new formulas and submit a notification at least 90 days before market introduction. FDA launched Operation Stork Speed in March 2025 and expanded testing of formulas and ingredients for spore-forming contaminants. The American route raises the value of complete source records and plant controls during premarket review. Export programs face separate ingredient acceptance rules and finished-product requirements in each destination and regional launch sequence. Early-life formula products therefore need technical dossiers that match the local recipe and manufacturing route. Commercial timing improves as formula records and plant evidence progress together through each regulatory review stage. Repeated studies or delayed source decisions can disrupt launch schedules and raise operating costs across several countries.
Summary of the Infant Formula & Early-Life Nutrition Ingredients Market
| Market Signal | Commercial Impact |
|---|---|
| Demand and Growth Drivers | Ingredient safety and source traceability shape spending across regulated infant formula production in every major market. Manufacturers favor inputs that support nutritional design without increasing contamination risk or delaying national product registration.
|
| Product and Segment View | Segment positions reflect the nutritional duty and production risk carried by each named ingredient and product category. Formula developers evaluate functional performance beside stability and compliance across every intended commercial recipe and launch program.
|
| Geography and Growth Outlook | Country growth depends on how quickly approved ingredients enter registered formulas through local compliance and manufacturing routes. Import controls and plant location determine whether one technical file can support efficient national commercialization plans.
|
| Competitive Landscape | Competition separates broad early-life portfolios from developers focused on dairy proteins or microbiome ingredients across regulated formulas. Formula manufacturers compare regulatory evidence and application support beside dependable production across every target-country program.
|
| Analyst Perspective | Commercial success depends on proving ingredient performance inside the intended formula and its national approval route. Development teams should separate nutritional value from production reliability during qualification and commercial contract decisions.
– , Principal Analyst at Future Market Insights |
Source: FMI’s proprietary forecasting model and primary research
How is the infant formula & early-life nutrition ingredients market segmented?
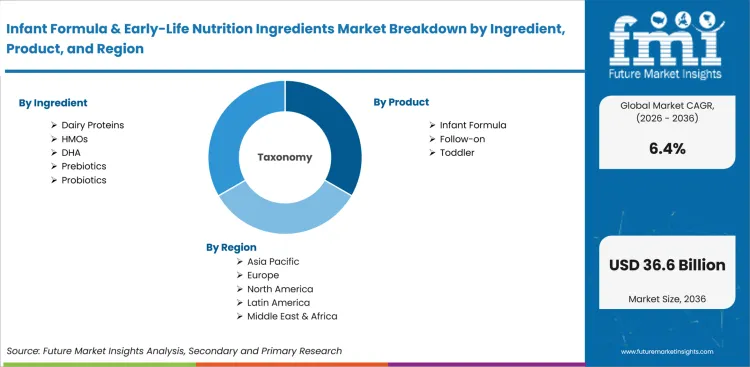
The infant formula & early-life nutrition ingredients industry is segmented by ingredient, product, form, and region
Ingredient analysis separates dairy proteins from HMOs and DHA while treating prebiotics and probiotics as distinct formulation inputs. Dairy proteins address biological protein quality while DHA supports fatty-acid delivery during early development and commercial formula production. HMOs and biotic ingredients require identity records that connect functional claims with the intended formula. Product analysis distinguishes infant formula from follow-on and toddler products through age-specific nutritional duties and registration requirements.
Form analysis compares powder with liquid and other commercial formats through storage needs and reconstitution behavior. The assessment also considers microbial control and distribution cost across each form during routine commercial supply. Regional analysis connects every category with national ingredient approvals and finished-formula requirements across the covered countries
What supports demand for dairy proteins within the ingredient category?
Formula developers use dairy proteins to deliver essential amino acids while controlling digestibility and finished-product stability across commercial batches. FDA issued final guidance in May 2026 for protein efficiency ratio studies used to demonstrate sufficient biological protein quality in new infant formulas. The defined study route raises the value of whey protein ingredients with consistent composition and complete
- By ingredient, dairy proteins are estimated to hold 34.9% in 2026 owing to their direct role in biological protein quality. Formula manufacturers compare amino acid delivery and processing behavior across each intended recipe and production line. A documented protein system gains commercial preference through stable results during heating and storage across repeated batches.
- Formula manufacturers increasingly purchase dairy proteins that retain solubility through heat treatment and shelf-life testing across the intended product range. Comparable milk protein systems help development teams separate raw-material limits from plant-processing failures during qualification. Clear failure attribution reduces repeated trials and supports practical release specifications for routine production contracts.
How does infant formula shape demand within the product category?
Infant formula carries detailed composition and quality duties as it can serve as the primary nutritional source during early development. Product qualification connects ingredient function with finished-formula safety and complete manufacturing records across every planned commercial recipe. Specialized probiotic ingredients require strain identity and intended-use evidence during regulated formulation and product-development work. The evidence helps technical teams assess compatibility without importing performance claims from unrelated foods or age groups.
- In 2026, infant formula is expected to lead the product category with 42.7% share due to its broad nutrient specifications and product-level manufacturing controls. In February 2026, FDA published a centralized list covering formulas available in the United States market. The resource helps formula companies confirm product status during reformulation work and national launch planning.
- Formula companies adopt new ingredients through controlled reformulation programs that protect nutrient delivery and microbial safety across each commercial recipe. Qualified prebiotic ingredient options gain value through documents that define intended use and manufacturing controls. Complete records reduce avoidable review questions and limit repeated plant trials during national registration and commercial production planning.
How is powder positioned within the form category?
Powder formats support efficient storage and distribution but require strict environmental controls during drying and final packing. In January 2025, FDA issued draft sanitation guidance for low-moisture ready-to-eat foods that includes powdered infant formula. The document addresses pathogen events involving dairy ingredients and finished powder products across commercial plants. Formula manufacturers must connect environmental monitoring with corrective action and release decisions throughout routine production.
- Powder is projected to hold 41.3% share in 2026 owing to its established processing base and distribution efficiency. Production economics remain attractive across extended storage periods and routes that do not require refrigerated transport. Manufacturers must control environmental contamination during drying and packing through dedicated sanitation and environmental monitoring programs. Final heat treatment cannot correct every low-moisture hazard that enters formula production through the plant environment.
- Production teams increasingly purchase powder ingredients that disperse consistently and preserve nutrient uniformity during dry blending or reconstitution. Stable protein ingredient blends can reduce rework and support repeatable release testing across high-volume production schedules. One validated powder process can serve several package sizes and distribution routes without changing the core formulation or quality-control plan.
What are the drivers, restraints, and opportunities in the infant formula & early-life nutrition ingredients market?
Ingredient approvals support specialized formulation, regulatory evidence slows cross-country launches, and scalable biosolutions create targeted commercial openings
- Driver:National ingredient approvals create a lawful commercial route for specialized microbial inputs within registered infant formulas.
- Restraint: Ingredient acceptance does not replace finished-formula evidence across national registration and manufacturing-notification routes for commercial products.
- Opportunity:Precision-fermented proteins can widen access to scarce milk components through scalable production and documented formula performance.
National approvals convert specialized microbial strains into ingredients that registered formulas can legally use across commercial product lines. In February 2026, China added Bifidobacterium longum subsp. infantis YLGB-1496 to its permitted infant-food strain list. The decision gives formula developers a defined route for evaluating the probiotic inside local products. Strain-specific safety records and stable processing performance determine whether the approval supports repeated commercial production. Formula manufacturers must also complete finished-product requirements before the ingredient enters routine national supply and registered formula portfolios.
Regulatory review slows adoption by separating ingredient acceptance from finished-formula compliance and the manufacturing evidence required for registered products. Commission Delegated Regulation (EU) 2016/127 sets composition and information requirements for infant formula across the European Union. Formula companies must connect every ingredient with the final recipe and intended age group during product assessment. An approval for one protein system cannot automatically support another formula composition or national route. Repeated product studies and notification work can extend launch timing across several regulated commercial markets worldwide.
Precision-fermented lactoferrin creates a commercial opening for a milk protein that remains difficult to obtain at broad scale. In July 2026, Novonesis and TurtleTree announced an agreement covering manufacturing scale-up and commercialization support for LF+. The partnership provides a defined route from production development toward early-life nutrition applications within regulated formula programs. Formula suitability and national regulatory acceptance determine whether the new route supports commercial orders in each country. The ingredient must also deliver reliable specifications across repeated industrial batches and established formula processes.
Which country CAGRs are profiled in the infant formula & early-life nutrition ingredients market?
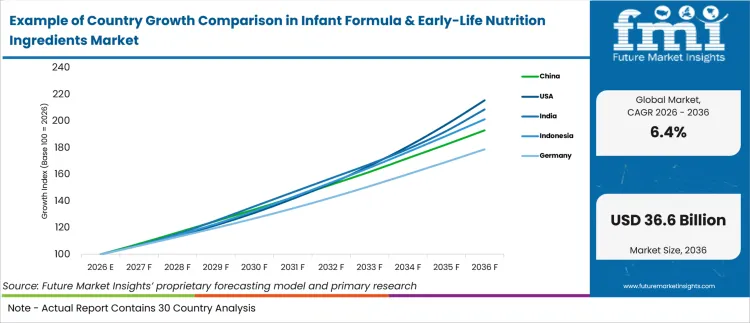
| Country | CAGR |
|---|---|
| China | 6.8% |
| USA | 6.5% |
| India | 7.6% |
| Indonesia | 7.2% |
| Germany | 6.0% |
How do country-level CAGRs compare in the infant formula & early-life nutrition ingredients market?
The country forecasts occupy a compact 1.6-percentage-point range, so approval routes create more commercial separation than headline growth rates. India and Indonesia form the upper pair with a measured 0.4-point gap between their approved forecasts. China and the USA create another close group with a 0.3-point difference between their growth rates. Germany remains 0.5 points below the USA and 1.6 points below India across the assessment period. The pattern indicates gradual differences in commercialization speed rather than a sharp division between mature and emerging markets.
- India combines the upper forecast position with a risk-based approval route that can lengthen the interval between ingredient submission and formula launch.
- Indonesia remains close to India but places greater operating weight on import traceability and rapid recall execution across distant supply chains.
- China occupies the middle range and links commercial access with registered formulas plus documented controls for direct dry-blend materials.
- The USA follows a separate federal route with stronger requirements for formula registration and complete ingredient-source records. Product testing adds another evidence layer for every planned commercial launch and registered formula change.
- Germany records the widest separation from India yet offers a defined regional route for evaluated protein hydrolysates in compliant finished formulas.
Comparable CAGRs can create different entry costs as approval evidence and local technical support determine usable access. An established country can deliver larger contracts despite a lower forecast rate if manufacturing and distribution are already scaled. The full report provides country-level CAGR analysis across North America, Latin America, Europe, East Asia, South Asia, Oceania and the Middle East and Africa
Country-wise Analysis
- Registered infant-formula plants in China must document raw-material controls for every ingredient entering commercial powder production. The China infant-formula ingredient sector is projected to record 6.8% CAGR during the assessment period, shaped by stricter control across registered powder plants. In March 2025, SAMR required direct dry-blend materials to meet infant-formula microbiological standards and strengthened audits for base-powder producers. The rules give approved ingredients a clear compliance route through local manufacturing and registered product systems. Imported materials create friction as overseas records must align with domestic testing and change-control requirements. Market entry depends on complete batch documentation and technical support that can respond during registration review.
- United States formula manufacturers operate under federal registration and product-level safety oversight for every commercial launch. FDA reported in April 2026 that more than 300 infant-formula samples generated more than 120,000 analytical data points. In the United States infant-formula ingredient demand is predicted to advance at 6.5% CAGR through 2036 due to a defined compliance and testing route. The surveillance program strengthens finished-product oversight and raises demand for records that connect analytical findings with individual ingredient sources. The established submission process gives ingredient developers a clear route into regulated national formula portfolios. Technical teams must answer testing questions consistently so planned production schedules remain workable across every registered product.
- India requires prior approval for food ingredients that are not standardized under national regulations and listed specifications. India’s infant-formula ingredient market is estimated to post 7.6% CAGR over the forecast period, supported by a formal risk-review pathway for specialized inputs. In June 2026, FSSAI updated the application status list for non-specified foods and ingredients under its approval regulations. The route enables lawful market entry but adds country-specific dossier work for every unstandardized ingredient. Overseas safety files may leave local questions about intended use or manufacturing controls partly unanswered. Incomplete responses can delay formula development despite an ingredient having acceptance in another national jurisdiction. Ingredient developers need local regulatory support and realistic review schedules that match each planned commercial launch.
- Indonesia regulates infant formula as processed food for special nutritional use and monitors risks linked with imported ingredients. Adoption of early-life nutrition ingredients in Indonesia is estimated to expand at 7.2% CAGR through 2036, shaped by strict import surveillance and distributor accountability. In January 2026, BPOM stopped distribution and temporary imports of specified formula batches following an international alert linked with possible cereulide contamination in ARA oil. The action demonstrates a direct regulatory route for rapid withdrawal across affected national supply chains. Import oversight supports consumer confidence but creates friction for manufacturers that cannot retrieve source records quickly. Local distributors need lot-level recall procedures and documented communication routes during product release and emergency withdrawal.
- Germany applies harmonized European Union composition requirements to infant and follow-on formula sold through national channels. Infant-formula ingredient demand in Germany is forecast to rise at 6.0% CAGR over the forecast period, supported by a defined regional route for verified hydrolysate ingredients. In March 2026, Commission Delegated Regulation (EU) 2026/743 added protein-related group F following a safety and suitability evaluation. The amendment enables compliant formulas to use the specified hydrolysate composition across European Union member states. German notification duties and product-specific evidence create material frictions during national commercialization and formula registration. Technical files must connect the permitted hydrolysate with each finished recipe and its planned national launch.
Who are the notable companies in the infant formula & early-life nutrition ingredients market?
dsm-firmenich, FrieslandCampina Ingredients, Arla Foods Ingredients, Fonterra, IFF, Kerry, and Novonesis are the notable companies profiled in this market
Competition separates broad infant-nutrition portfolios from companies focused on dairy proteins or microbiome ingredients across regulated formula programs. Formula manufacturers compare regulatory evidence and application support beside dependable production in every target country. Recent approvals and clinical work have expanded commercial routes for lactoferrin and MFGM ingredients across early-life nutrition applications. Separate programs are advancing probiotics and human milk oligosaccharides through verified regulatory or manufacturing milestones. Competitive strength depends on whether a company can connect ingredient identity with formula-specific evidence and reliable supply. Geographic reach creates value through local teams that can support registration and production questions during commercialization.
- dsm-firmenich and FrieslandCampina Ingredients combine regulated specialty ingredients with regional application support across early-life nutrition programs. dsm-firmenich secured HMO authorizations across China and two Southeast Asian countries in March 2026. FrieslandCampina Ingredients expanded regional development capacity through a Singapore application center opened in September 2025.
- Arla Foods Ingredients and Fonterra concentrate on dairy proteins for controlled early-life nutrition production across international formula programs. Arla reported in March 2026 that formula containing Lacprodan IF-3070 supported healthy growth during a 251-infant clinical study. Fonterra documented proteins and hydrolysates beside probiotics through its global ingredient network in August 2024.
- IFF and Kerry contribute probiotic technology through specialized nutrition portfolios and documented formulation support for early-life applications. IFF described strain-specific stability engineering and global application teams across commercial product formats in May 2026. Kerry detailed two human-milk probiotic strains for maternal and infant formulation programs in August 2025. Novonesis added a consolidated evidence base for BB-12 through a July 2025 peer-reviewed scientific review.
Competitive Benchmarking: Infant Formula & Early-Life Nutrition Ingredients Market
| Company | Commercial Ingredient Readiness | Regulatory or Clinical Evidence | Application and Scale Support | Geographic Reach |
|---|---|---|---|---|
| dsm-firmenich | High | High | Medium | Asia and international markets |
| FrieslandCampina Ingredients | Medium | High | High | United States and Asia-Pacific |
| Arla Foods Ingredients | Medium | High | Medium | Australia, Europe, and Asia |
| Fonterra | Medium | Medium | Medium | Global ingredient network |
| IFF | Medium | Medium | High | Global specialized-nutrition markets |
| Kerry | Medium | Medium | Medium | Asia-Pacific and international markets |
| Novonesis | Low | Low | High | Global development partnerships |
For commercial ingredient readiness, High requires multiple dated approvals or commercialization actions across ingredient classes or national markets. Medium requires one documented exact-market offer or an official report of active infant-nutrition sales during the review period. Low applies to dated research or precommercial work and never serves as a substitute for missing public evidence. For regulatory or clinical evidence, High requires product-specific approval or direct clinical validation in an infant-formula application. Medium applies to official technical evidence that supports infant nutrition use without product-specific regulatory authorization. Low applies to research evidence that has not reached current formula authorization or completed commercial validation. For application and scale support, High requires a dedicated facility or global application teams with a verified manufacturing agreement. Medium applies to documented technical support that covers one verified ingredient family or one geographic program. Low applies to scientific evidence without a verified route for application work or commercial scale-up.
Key Developments in the Infant Formula & Early-Life Nutrition Ingredients Market
- In April 2025, dsm-firmenich received Indian approval for GLYCARE 2FL human milk oligosaccharide in products intended for infants up to six months at a maximum use level of 1.2 grams per liter. The approval created a direct commercial route for 2’-FL in registered Indian formula products. Formula developers retain responsibility for connecting the authorized ingredient with each finished recipe and manufacturing dossier.
- In January 2025, FrieslandCampina Ingredients reported that Vivinal Lactoferrin received GRAS status for specified cow-milk-based infant and toddler formulas in the United States. The FDA response documents use within the stated formula categories and conditions while leaving finished-product responsibilities with each manufacturer. Formula companies retain responsibility for composition and manufacturing controls together with protein quality and premarket notification before each commercial formula launch.
- In July 2025, Arla Foods Ingredients reported Australian approval of Lacprodan MFGM-10 for infant-formula use following the Food Standards Australia New Zealand decision. Arla described the decision as its first early-life nutrition ingredient approval in Australia and reported an exclusive commercialization period. The action creates a defined MFGM route while formula manufacturers retain responsibility for final product compliance and production evidence.
- In September 2025, Novonesis received National Science Foundation funding for cell-free synthesis of longer human milk oligosaccharides with Stanford University and the University of California San Diego. The project targets more efficient production routes for complex HMOs that remain difficult to manufacture. The program represents research-stage capability development and requires later validation at industrial scale before it can support commercial infant-formula supply.
Key Players in the Infant Formula & Early-Life Nutrition Ingredients Market
Regulated Infant Nutrition Ingredient Portfolios
- dsm-firmenich
- FrieslandCampina Ingredients
- IFF
Dairy Protein and Formula Specialists
- Arla Foods Ingredients
- Fonterra
Microbiome and Infant Health Biosolutions
- Kerry
- Novonesis
Infant Formula & Early-Life Nutrition Ingredients Market – Report Scope
| Coverage field | Report scope |
|---|---|
| Market breakdown | Ingredient, product, form, and region. |
| Quantitative Units | USD Billion, CAGR in %. |
| Market Definition | Commercial ingredients used directly in infant formula and early-life nutrition products. The scope includes dairy proteins, HMOs, DHA, prebiotics, probiotics, and the named product and form categories. |
| Regions Covered | North America, Latin America, Europe, East Asia, South Asia, Oceania, and Middle East and Africa. |
| Countries Covered | China, USA, India, Indonesia, Germany, and 30+ countries within the regional model. |
| Key Companies Profiled | dsm-firmenich, FrieslandCampina Ingredients, Arla Foods Ingredients, Fonterra, IFF, Kerry, and Novonesis |
| Forecast Period | 2026 to 2036. |
| Approach | Hybrid bottom-up and top-down market sizing supported by primary interviews and official desk research. |
Infant Formula & Early-Life Nutrition Ingredients Market – Research Methodology
| Method | Approach |
|---|---|
| Primary Research | FMI analysts gathered input from manufacturers, service providers, technology developers, distributors, end users, procurement teams, and subject-matter experts. Interviews examined purchasing decisions, product or service evaluation, adoption barriers, approval requirements, pricing considerations, and expectations for technical or commercial support. Respondents were also asked what evidence is required before a trial, pilot, or initial order develops into regular purchasing. |
| Desk Research | Desk research covered government statistics, regulatory publications, trade data, industry associations, technical literature, standards, company filings, product information, and official corporate announcements. Sources were reviewed for relevance, publication date, geographic coverage, and consistency with the defined market scope. Claims relating to performance, applications, approvals, capacity, investment, and commercial activity were retained only when supported by credible public evidence. |
| Market Sizing and Forecasting | The market model combined the baseline value with historical performance, segment structure, pricing and volume indicators, adoption levels, company participation, and country-level demand conditions. Forecast assumptions considered economic activity, investment trends, regulatory developments, technology adoption, purchasing cycles, supply availability, and barriers to wider market use. Segment and regional estimates were reconciled before the final market total was calculated. |
| Data Validation | Estimates were checked against multiple independent indicators, including public data, company activity, trade patterns, industry developments, and findings from primary interviews. Validation also tested whether products, services, applications, and company revenues fell within the defined market boundaries. Adjacent categories, unsupported claims, overlapping revenues, and activities without direct market relevance were excluded to reduce double counting and maintain consistency across segments and countries. |
Infant Formula & Early-Life Nutrition Ingredients Market by Segments
Infant Formula & Early-Life Nutrition Ingredients Market segmented by Ingredient:
- Dairy Proteins
- HMOs
- DHA
- Prebiotics
- Probiotics
Infant Formula & Early-Life Nutrition Ingredients Market segmented by Product:
- Infant Formula
- Follow-on
- Toddler
Infant Formula & Early-Life Nutrition Ingredients Market segmented by Form:
- Powder
- Liquid
- Granules
- Paste
Infant Formula & Early-Life Nutrition Ingredients Market by Region:
- North America
- United States
- Canada
- Latin America
- Brazil
- Mexico
- Argentina
- Chile
- Western Europe
- Germany
- France
- United Kingdom
- Italy
- Spain
- Benelux
- Nordics
- Eastern Europe
- Poland
- Czech Republic
- Romania
- Hungary
- East Asia
- China
- Japan
- South Korea
- South Asia and Pacific
- India
- ASEAN
- Australia and New Zealand
- Middle East and Africa
- GCC Countries
- South Africa
- Türkiye
- Israel
Research
- USA Food and Drug Administration. (2026, July 13). Information for Infant Formula Manufacturers and Retailers.
- USA Food and Drug Administration. (2026, May 21). FDA Publishes Final Guidance on Protein Quality Studies for Infant Formula.
- USA Food and Drug Administration. (2026, February 26). FDA Augments and Improves Infant Formula Resources to Enhance Transparency, Safety, and Access for American Families.
- USA Food and Drug Administration. (2026, April 29). FDA Releases Results from Largest-Ever Testing of Infant Formula in the USA.
- USA Food and Drug Administration. (2025, March 18). HHS, FDA Announce Operation Stork Speed to Expand Options for Safe, Reliable, and Nutritious Infant Formula for American Families.
- USA Food and Drug Administration. (2025, January). Draft Guidance for Industry: Establishing Sanitation Programs for Low-Moisture Ready-to-Eat Human Foods and Taking Corrective Actions Following a Pathogen Contamination Event.
- Food Safety and Standards Authority of India. (2026, June 9). List of applications approved/rejected/closed/withdrawn/status (under process) under the Food Safety and Standards (Approval for Non-Specified Food and Food Ingredients) Regulations, 2017.
- National Health Commission of the People’s Republic of China. (2026, February 5). 解读《关于栀子油等22种“三新食品”的公告》(2026年第1号) [Interpretation of Announcement No. 1 of 2026 on 22 new foods].
- State Administration for Market Regulation. (2025, March 26). 市场监管总局关于进一步加强婴幼儿配方乳粉原辅料管理有关事宜的公告 [Announcement on further strengthening the management of raw and auxiliary materials for infant formula milk powder].
- Indonesian Food and Drug Authority. (2026, January 14). Penarikan Produk Formula Bayi Impor [Withdrawal of Imported Infant Formula Products].
- European Commission. (2016, February 2). Commission Delegated Regulation (EU) 2016/127 of 25 September 2015 Supplementing Regulation (EU) No 609/2013 as Regards the Specific Compositional and Information Requirements for Infant Formula and Follow-on Formula.
- European Commission. (2026, March 30). Commission Delegated Regulation (EU) 2026/743 of 30 March 2026 Amending Delegated Regulation (EU) 2016/127 as Regards the Protein-Related Requirements for Infant Formula and Follow-on Formula Manufactured from Protein Hydrolysates.
- dsm-firmenich. (2025, April 11). Boost for Infant Health: India Approves dsm-firmenich’s 2′-FL HMO.
- FrieslandCampina Ingredients. (2025, January 16). FrieslandCampina Ingredients’ Vivinal® Lactoferrin Achieves GRAS Status for US Infant Nutrition Market.
- Arla Foods Ingredients. (2025, July 22). Australia Approves Arla Foods Ingredients’ MFGM for Use in Infant Formula.
- dsm-firmenich. (2026, March 5). dsm-firmenich Strengthens HMO Offering in Asia with New Regulatory Approvals.
- FrieslandCampina Ingredients. (2025, September 15). FrieslandCampina Ingredients Expands R&D Capabilities with New State-of-the-Art Application Centre in Singapore.
- Arla Foods Ingredients. (2026, March 23). Infant Formula Containing Lacprodan® IF-3070 Supports Healthy Growth, Clinical Study Finds.
- Novonesis. (2025, September 17). NSF Awards Novonesis Funding to Advance Cell-Free Biomanufacturing of Human Milk Oligosaccharides.
- Novonesis. (2026, July 8). Novonesis and TurtleTree Enter Partnership to Support Commercialization of Lactoferrin.
- Fonterra Co-operative Group Limited. (2024, August 29). Shining a Spotlight on Our High Value Ingredients.
- International Flavors & Fragrances Inc. (2026, February 27). Annual Report for the Fiscal Year Ended December 31, 2025 [Form 10-K].
- International Flavors & Fragrances Inc. (2026, May 8). From Lab to Shelf: How IFF Designs Stability into Probiotics.
- Novonesis. (2025, July 8). New Landmark Scientific Review on the BB-12™ Probiotic Strain Published.
- Kerry. (2025, August 25). Human Milk Probiotics: The Next Big Thing in Maternal and Infant Health.
This bibliography is provided for reader reference and is not exhaustive. The full report contains the complete reference list and detailed citations
This Report Answers
- How large is the Infant Formula & Early-Life Nutrition Ingredients Market from 2026 through 2036?
- Which demand conditions support Dairy Proteins and HMOs together with DHA and microbiome-focused ingredient categories?
- Why does infant formula account for 45.0% of product share during the 2026 base year?
- How do manufacturing requirements and distribution economics differ across powder and other commercial forms?
- How do country growth rates compare across the five profiled national markets?
- Which national regulatory pathways affect ingredient approvals and finished-formula registration across major countries?
- How do notable companies compare through core nutrients and microbiome inputs together with formula-application support?
- Which current company developments influence HMO and lactoferrin commercialization alongside MFGM and protein ingredients?
- What should manufacturers test before wider ingredient purchasing or formula deployment decisions?
Frequently Asked Questions
What is driving growth in the infant formula & early-life nutrition ingredients market?
Specialized ingredient approvals and stricterered formula portfolios. Manufacturers also require repeatable performance across commercial batches before expanding routine purchasing for early-life nutrition products
Who are the key players in the infant formula & early-life nutrition ingredients market?
The profiled group includes dsm-firmenich and FrieslandCampina Ingredients alongside Arla Foods Ingredients and Fonterra across regulated formula applications. IFF and Kerry join Novonesis through microbiome ingredients that support specialized early-life nutrition development and commercial formulation
What is a notable restraint in the infant formula & early-life nutrition ingredients market?
Ingredient acceptance does not replace finished-formula compliance across national registration routes and manufacturing notification requirements. Repeated country dossiers can extend launch schedules and increase reformulation costs across otherwise similar commercial formula programs
Why should executives track the infant formula & early-life nutrition ingredients market?
Ingredient choices affect formula safety and production continuity across several registered products and manufacturing locations. Weak multiple formulas using the same ingredient
What business problem does the infant formula & early-life nutrition ingredients market address?
The market connects specialized nutrition inputs with regulated formula production across infant and toddler product categories. It helps manufacturers deliver defined nutrient functions without weakening batch consistency or product safety during commercial production
What should formula manufacturers and ingredient developers evaluate in the infant formula & early-life nutrition ingredients market?
Development teams should evaluate ingredient identity and intended use alongside processing stability across the proposed formula recipe. Regulatory documentation must also match each commercial formulation and its national approval route before planned market entry
What limits return on investment in the infant formula & early-life nutrition ingredients market?
Repeated qualification work across countries or production sites weakens returns on otherwise reusable ingredient platforms. Unstable supply can also disrupt several registered formulas and increase recovery costs across multiple manufacturing locations
What supports long-term confidence in the infant formula & early-life nutrition ingredients market?
Confidence depends on dependable capacity and traceable specifications across commercial batches and multiple manufacturing locations. Responsive technical support helps manufacturers manage formula changes without avoidable delays during national registration and routine production
Table of Content
- Key Takeaways
- Market Size and CAGR
- Top Growth Driver
- Fastest Growing Segment
- Leading Region
- Key Companies
- Emerging Opportunities
- Executive Summary
- Global Market Outlook
- Demand-side Trends
- Supply-side Trends
- Technology Roadmap Analysis
- Analysis and Recommendations
- Analyst Perspective (What is happening? Why now? What should investors know?)
- Key Questions Answered
- How large is the market?
- What is the CAGR?
- What are key trends?
- Which region dominates?
- Who are the leaders?
- Market Overview
- Market Coverage / Taxonomy
- Market Definition / Scope / Limitations
- Research Methodology
- Chapter Orientation
- Analytical Lens and Working Hypotheses
- Market Structure, Signals, and Trend Drivers
- Benchmarking and Cross-market Comparability
- Market Sizing, Forecasting, and Opportunity Mapping
- Research Design and Evidence Framework
- Desk Research Programme (Secondary Evidence)
- Expert Input and Fieldwork (Primary Evidence)
- Tooling, Models, and Reference Databases
- Data Engineering and Model Build
- Quality Assurance and Audit Trail
- Market Background
- Market Dynamics (Drivers, Restraints, Opportunity, Trends)
- Scenario Forecast (Optimistic, Likely, Conservative)
- Impact Analysis
- AI Impact
- Sustainability Impact
- Regulatory Impact
- Technology Impact
- Consumer / Buyer Analysis
- Purchase Drivers
- Adoption Barriers
- Buyer Journey
- Opportunity Map Analysis
- Product Life Cycle Analysis
- Supply Chain Analysis
- Investment Feasibility Matrix
- Value Chain Analysis
- PESTLE and Porter’s Analysis
- Regulatory Landscape
- Regional Parent Market Outlook
- Production and Consumption Statistics
- Import and Export Statistics
- Global Market Analysis and Forecast, 2021 to 2036
- Historical Market Size Value (USD Billion) Analysis, 2021 to 2025
- Current and Future Market Size Value (USD Billion) Projections, 2026 to 2036
- Y-o-Y Growth Trend Analysis
- Absolute $ Opportunity Analysis
- Global Market Pricing Analysis, 2021 to 2036
- Global Market Analysis and Forecast, By Ingredient, 2021 to 2036
- Introduction / Key Findings
- Historical Market Size Value (USD Billion) Analysis By Ingredient, 2021 to 2025
- Current and Future Market Size Value (USD Billion) Analysis and Forecast By Ingredient, 2026 to 2036
- Dairy Proteins
- HMOs
- DHA
- Prebiotics
- Probiotics
- Y-o-Y Growth Trend Analysis By Ingredient, 2021 to 2025
- Absolute $ Opportunity Analysis By Ingredient, 2026 to 2036
- Global Market Analysis and Forecast, By Product, 2021 to 2036
- Introduction / Key Findings
- Historical Market Size Value (USD Billion) Analysis By Product, 2021 to 2025
- Current and Future Market Size Value (USD Billion) Analysis and Forecast By Product, 2026 to 2036
- Infant Formula
- Follow-on
- Toddler
- Y-o-Y Growth Trend Analysis By Product, 2021 to 2025
- Absolute $ Opportunity Analysis By Product, 2026 to 2036
- Global Market Analysis and Forecast, By Form, 2021 to 2036
- Introduction / Key Findings
- Historical Market Size Value (USD Billion) Analysis By Form, 2021 to 2025
- Current and Future Market Size Value (USD Billion) Analysis and Forecast By Form, 2026 to 2036
- Powder
- Liquid
- Granules
- Paste
- Y-o-Y Growth Trend Analysis By Form, 2021 to 2025
- Absolute $ Opportunity Analysis By Form, 2026 to 2036
- Global Market Analysis and Forecast, By Region, 2021 to 2036
- Introduction
- Historical Market Size Value (USD Billion) Analysis By Region, 2021 to 2025
- Current Market Size Value (USD Billion) Analysis and Forecast By Region, 2026 to 2036
- North America
- Latin America
- Western Europe
- Eastern Europe
- East Asia
- South Asia and Pacific
- Middle East & Africa
- Market Attractiveness Analysis By Region
- North America Market Analysis and Forecast, By Country, 2021 to 2036
- Historical Market Size Value (USD Billion) Trend Analysis By Market Taxonomy, 2021 to 2025
- Market Size Value (USD Billion) Forecast By Market Taxonomy, 2026 to 2036
- By Country
- USA
- Canada
- By Ingredient
- By Product
- By Form
- By Country
- Market Attractiveness Analysis
- By Country
- By Ingredient
- By Product
- By Form
- Key Takeaways
- Latin America Market Analysis and Forecast, By Country
- Historical Market Size Value (USD Billion) Trend Analysis By Market Taxonomy, 2021 to 2025
- Market Size Value (USD Billion) Forecast By Market Taxonomy, 2026 to 2036
- By Country
- Brazil
- Mexico
- Chile
- Rest of Latin America
- By Ingredient
- By Product
- By Form
- By Country
- Market Attractiveness Analysis
- By Country
- By Ingredient
- By Product
- By Form
- Key Takeaways
- Western Europe Market Analysis and Forecast, By Country
- Historical Market Size Value (USD Billion) Trend Analysis By Market Taxonomy, 2021 to 2025
- Market Size Value (USD Billion) Forecast By Market Taxonomy, 2026 to 2036
- By Country
- Germany
- UK
- Italy
- Spain
- France
- Nordic
- BENELUX
- Rest of Western Europe
- By Ingredient
- By Product
- By Form
- By Country
- Market Attractiveness Analysis
- By Country
- By Ingredient
- By Product
- By Form
- Key Takeaways
- Eastern Europe Market Analysis and Forecast, By Country
- Historical Market Size Value (USD Billion) Trend Analysis By Market Taxonomy, 2021 to 2025
- Market Size Value (USD Billion) Forecast By Market Taxonomy, 2026 to 2036
- By Country
- Russia
- Poland
- Hungary
- Balkan & Baltic
- Rest of Eastern Europe
- By Ingredient
- By Product
- By Form
- By Country
- Market Attractiveness Analysis
- By Country
- By Ingredient
- By Product
- By Form
- Key Takeaways
- East Asia Market Analysis and Forecast, By Country
- Historical Market Size Value (USD Billion) Trend Analysis By Market Taxonomy, 2021 to 2025
- Market Size Value (USD Billion) Forecast By Market Taxonomy, 2026 to 2036
- By Country
- China
- Japan
- South Korea
- By Ingredient
- By Product
- By Form
- By Country
- Market Attractiveness Analysis
- By Country
- By Ingredient
- By Product
- By Form
- Key Takeaways
- South Asia and Pacific Market Analysis and Forecast, By Country
- Historical Market Size Value (USD Billion) Trend Analysis By Market Taxonomy, 2021 to 2025
- Market Size Value (USD Billion) Forecast By Market Taxonomy, 2026 to 2036
- By Country
- India
- ASEAN
- Australia & New Zealand
- Rest of South Asia and Pacific
- By Ingredient
- By Product
- By Form
- By Country
- Market Attractiveness Analysis
- By Country
- By Ingredient
- By Product
- By Form
- Key Takeaways
- Middle East & Africa Market Analysis and Forecast, By Country
- Historical Market Size Value (USD Billion) Trend Analysis By Market Taxonomy, 2021 to 2025
- Market Size Value (USD Billion) Forecast By Market Taxonomy, 2026 to 2036
- By Country
- Kingdom of Saudi Arabia
- Other GCC Countries
- Türkiye
- South Africa
- Other African Union
- Rest of Middle East & Africa
- By Ingredient
- By Product
- By Form
- By Country
- Market Attractiveness Analysis
- By Country
- By Ingredient
- By Product
- By Form
- Key Takeaways
- Key Countries Market Analysis
- USA
- Pricing Analysis
- Market Share Analysis, 2025
- By Ingredient
- By Product
- By Form
- Canada
- Pricing Analysis
- Market Share Analysis, 2025
- By Ingredient
- By Product
- By Form
- Mexico
- Pricing Analysis
- Market Share Analysis, 2025
- By Ingredient
- By Product
- By Form
- Brazil
- Pricing Analysis
- Market Share Analysis, 2025
- By Ingredient
- By Product
- By Form
- Chile
- Pricing Analysis
- Market Share Analysis, 2025
- By Ingredient
- By Product
- By Form
- Germany
- Pricing Analysis
- Market Share Analysis, 2025
- By Ingredient
- By Product
- By Form
- UK
- Pricing Analysis
- Market Share Analysis, 2025
- By Ingredient
- By Product
- By Form
- Italy
- Pricing Analysis
- Market Share Analysis, 2025
- By Ingredient
- By Product
- By Form
- Spain
- Pricing Analysis
- Market Share Analysis, 2025
- By Ingredient
- By Product
- By Form
- France
- Pricing Analysis
- Market Share Analysis, 2025
- By Ingredient
- By Product
- By Form
- India
- Pricing Analysis
- Market Share Analysis, 2025
- By Ingredient
- By Product
- By Form
- ASEAN
- Pricing Analysis
- Market Share Analysis, 2025
- By Ingredient
- By Product
- By Form
- Australia & New Zealand
- Pricing Analysis
- Market Share Analysis, 2025
- By Ingredient
- By Product
- By Form
- China
- Pricing Analysis
- Market Share Analysis, 2025
- By Ingredient
- By Product
- By Form
- Japan
- Pricing Analysis
- Market Share Analysis, 2025
- By Ingredient
- By Product
- By Form
- South Korea
- Pricing Analysis
- Market Share Analysis, 2025
- By Ingredient
- By Product
- By Form
- Russia
- Pricing Analysis
- Market Share Analysis, 2025
- By Ingredient
- By Product
- By Form
- Poland
- Pricing Analysis
- Market Share Analysis, 2025
- By Ingredient
- By Product
- By Form
- Hungary
- Pricing Analysis
- Market Share Analysis, 2025
- By Ingredient
- By Product
- By Form
- Kingdom of Saudi Arabia
- Pricing Analysis
- Market Share Analysis, 2025
- By Ingredient
- By Product
- By Form
- Türkiye
- Pricing Analysis
- Market Share Analysis, 2025
- By Ingredient
- By Product
- By Form
- South Africa
- Pricing Analysis
- Market Share Analysis, 2025
- By Ingredient
- By Product
- By Form
- USA
- Market Structure Analysis
- Competition Dashboard
- Competition Benchmarking
- Market Share Analysis of Top Players
- By Regional
- By Ingredient
- By Product
- By Form
- Emerging Startups
- Innovation Benchmarking
- Competition Analysis
- Competition Deep Dive
- dsm-firmenich
- Overview
- Product Portfolio
- Profitability by Market Segments
- Sales Footprint
- Strategy Overview
- Marketing Strategy
- Product Strategy
- Channel Strategy
- FrieslandCampina
- Arla Foods Ingredients
- Fonterra
- IFF
- Kerry
- BASF
- dsm-firmenich
- Case Studies
- Success Stories
- Recent Developments
- Competition Deep Dive
- Assumptions & Acronyms Used
- Table 1: Global Market Value (USD Billion) Forecast by Region, 2021 to 2036
- Table 2: Global Market Value (USD Billion) Forecast by Ingredient, 2021 to 2036
- Table 3: Global Market Value (USD Billion) Forecast by Product, 2021 to 2036
- Table 4: Global Market Value (USD Billion) Forecast by Form, 2021 to 2036
- Table 5: North America Market Value (USD Billion) Forecast by Country, 2021 to 2036
- Table 6: North America Market Value (USD Billion) Forecast by Ingredient, 2021 to 2036
- Table 7: North America Market Value (USD Billion) Forecast by Product, 2021 to 2036
- Table 8: North America Market Value (USD Billion) Forecast by Form, 2021 to 2036
- Table 9: Latin America Market Value (USD Billion) Forecast by Country, 2021 to 2036
- Table 10: Latin America Market Value (USD Billion) Forecast by Ingredient, 2021 to 2036
- Table 11: Latin America Market Value (USD Billion) Forecast by Product, 2021 to 2036
- Table 12: Latin America Market Value (USD Billion) Forecast by Form, 2021 to 2036
- Table 13: Western Europe Market Value (USD Billion) Forecast by Country, 2021 to 2036
- Table 14: Western Europe Market Value (USD Billion) Forecast by Ingredient, 2021 to 2036
- Table 15: Western Europe Market Value (USD Billion) Forecast by Product, 2021 to 2036
- Table 16: Western Europe Market Value (USD Billion) Forecast by Form, 2021 to 2036
- Table 17: Eastern Europe Market Value (USD Billion) Forecast by Country, 2021 to 2036
- Table 18: Eastern Europe Market Value (USD Billion) Forecast by Ingredient, 2021 to 2036
- Table 19: Eastern Europe Market Value (USD Billion) Forecast by Product, 2021 to 2036
- Table 20: Eastern Europe Market Value (USD Billion) Forecast by Form, 2021 to 2036
- Table 21: East Asia Market Value (USD Billion) Forecast by Country, 2021 to 2036
- Table 22: East Asia Market Value (USD Billion) Forecast by Ingredient, 2021 to 2036
- Table 23: East Asia Market Value (USD Billion) Forecast by Product, 2021 to 2036
- Table 24: East Asia Market Value (USD Billion) Forecast by Form, 2021 to 2036
- Table 25: South Asia and Pacific Market Value (USD Billion) Forecast by Country, 2021 to 2036
- Table 26: South Asia and Pacific Market Value (USD Billion) Forecast by Ingredient, 2021 to 2036
- Table 27: South Asia and Pacific Market Value (USD Billion) Forecast by Product, 2021 to 2036
- Table 28: South Asia and Pacific Market Value (USD Billion) Forecast by Form, 2021 to 2036
- Table 29: Middle East & Africa Market Value (USD Billion) Forecast by Country, 2021 to 2036
- Table 30: Middle East & Africa Market Value (USD Billion) Forecast by Ingredient, 2021 to 2036
- Table 31: Middle East & Africa Market Value (USD Billion) Forecast by Product, 2021 to 2036
- Table 32: Middle East & Africa Market Value (USD Billion) Forecast by Form, 2021 to 2036
- Figure 1: Global Market Pricing Analysis
- Figure 2: Global Market Value (USD Billion) Forecast 2021-2036
- Figure 3: Global Market Value Share and BPS Analysis by Ingredient, 2026 and 2036
- Figure 4: Global Market Y-o-Y Growth Comparison by Ingredient, 2026-2036
- Figure 5: Global Market Attractiveness Analysis by Ingredient
- Figure 6: Global Market Value Share and BPS Analysis by Product, 2026 and 2036
- Figure 7: Global Market Y-o-Y Growth Comparison by Product, 2026-2036
- Figure 8: Global Market Attractiveness Analysis by Product
- Figure 9: Global Market Value Share and BPS Analysis by Form, 2026 and 2036
- Figure 10: Global Market Y-o-Y Growth Comparison by Form, 2026-2036
- Figure 11: Global Market Attractiveness Analysis by Form
- Figure 12: Global Market Value (USD Billion) Share and BPS Analysis by Region, 2026 and 2036
- Figure 13: Global Market Y-o-Y Growth Comparison by Region, 2026-2036
- Figure 14: Global Market Attractiveness Analysis by Region
- Figure 15: North America Market Incremental Dollar Opportunity, 2026-2036
- Figure 16: Latin America Market Incremental Dollar Opportunity, 2026-2036
- Figure 17: Western Europe Market Incremental Dollar Opportunity, 2026-2036
- Figure 18: Eastern Europe Market Incremental Dollar Opportunity, 2026-2036
- Figure 19: East Asia Market Incremental Dollar Opportunity, 2026-2036
- Figure 20: South Asia and Pacific Market Incremental Dollar Opportunity, 2026-2036
- Figure 21: Middle East & Africa Market Incremental Dollar Opportunity, 2026-2036
- Figure 22: North America Market Value Share and BPS Analysis by Country, 2026 and 2036
- Figure 23: North America Market Value Share and BPS Analysis by Ingredient, 2026 and 2036
- Figure 24: North America Market Y-o-Y Growth Comparison by Ingredient, 2026-2036
- Figure 25: North America Market Attractiveness Analysis by Ingredient
- Figure 26: North America Market Value Share and BPS Analysis by Product, 2026 and 2036
- Figure 27: North America Market Y-o-Y Growth Comparison by Product, 2026-2036
- Figure 28: North America Market Attractiveness Analysis by Product
- Figure 29: North America Market Value Share and BPS Analysis by Form, 2026 and 2036
- Figure 30: North America Market Y-o-Y Growth Comparison by Form, 2026-2036
- Figure 31: North America Market Attractiveness Analysis by Form
- Figure 32: Latin America Market Value Share and BPS Analysis by Country, 2026 and 2036
- Figure 33: Latin America Market Value Share and BPS Analysis by Ingredient, 2026 and 2036
- Figure 34: Latin America Market Y-o-Y Growth Comparison by Ingredient, 2026-2036
- Figure 35: Latin America Market Attractiveness Analysis by Ingredient
- Figure 36: Latin America Market Value Share and BPS Analysis by Product, 2026 and 2036
- Figure 37: Latin America Market Y-o-Y Growth Comparison by Product, 2026-2036
- Figure 38: Latin America Market Attractiveness Analysis by Product
- Figure 39: Latin America Market Value Share and BPS Analysis by Form, 2026 and 2036
- Figure 40: Latin America Market Y-o-Y Growth Comparison by Form, 2026-2036
- Figure 41: Latin America Market Attractiveness Analysis by Form
- Figure 42: Western Europe Market Value Share and BPS Analysis by Country, 2026 and 2036
- Figure 43: Western Europe Market Value Share and BPS Analysis by Ingredient, 2026 and 2036
- Figure 44: Western Europe Market Y-o-Y Growth Comparison by Ingredient, 2026-2036
- Figure 45: Western Europe Market Attractiveness Analysis by Ingredient
- Figure 46: Western Europe Market Value Share and BPS Analysis by Product, 2026 and 2036
- Figure 47: Western Europe Market Y-o-Y Growth Comparison by Product, 2026-2036
- Figure 48: Western Europe Market Attractiveness Analysis by Product
- Figure 49: Western Europe Market Value Share and BPS Analysis by Form, 2026 and 2036
- Figure 50: Western Europe Market Y-o-Y Growth Comparison by Form, 2026-2036
- Figure 51: Western Europe Market Attractiveness Analysis by Form
- Figure 52: Eastern Europe Market Value Share and BPS Analysis by Country, 2026 and 2036
- Figure 53: Eastern Europe Market Value Share and BPS Analysis by Ingredient, 2026 and 2036
- Figure 54: Eastern Europe Market Y-o-Y Growth Comparison by Ingredient, 2026-2036
- Figure 55: Eastern Europe Market Attractiveness Analysis by Ingredient
- Figure 56: Eastern Europe Market Value Share and BPS Analysis by Product, 2026 and 2036
- Figure 57: Eastern Europe Market Y-o-Y Growth Comparison by Product, 2026-2036
- Figure 58: Eastern Europe Market Attractiveness Analysis by Product
- Figure 59: Eastern Europe Market Value Share and BPS Analysis by Form, 2026 and 2036
- Figure 60: Eastern Europe Market Y-o-Y Growth Comparison by Form, 2026-2036
- Figure 61: Eastern Europe Market Attractiveness Analysis by Form
- Figure 62: East Asia Market Value Share and BPS Analysis by Country, 2026 and 2036
- Figure 63: East Asia Market Value Share and BPS Analysis by Ingredient, 2026 and 2036
- Figure 64: East Asia Market Y-o-Y Growth Comparison by Ingredient, 2026-2036
- Figure 65: East Asia Market Attractiveness Analysis by Ingredient
- Figure 66: East Asia Market Value Share and BPS Analysis by Product, 2026 and 2036
- Figure 67: East Asia Market Y-o-Y Growth Comparison by Product, 2026-2036
- Figure 68: East Asia Market Attractiveness Analysis by Product
- Figure 69: East Asia Market Value Share and BPS Analysis by Form, 2026 and 2036
- Figure 70: East Asia Market Y-o-Y Growth Comparison by Form, 2026-2036
- Figure 71: East Asia Market Attractiveness Analysis by Form
- Figure 72: South Asia and Pacific Market Value Share and BPS Analysis by Country, 2026 and 2036
- Figure 73: South Asia and Pacific Market Value Share and BPS Analysis by Ingredient, 2026 and 2036
- Figure 74: South Asia and Pacific Market Y-o-Y Growth Comparison by Ingredient, 2026-2036
- Figure 75: South Asia and Pacific Market Attractiveness Analysis by Ingredient
- Figure 76: South Asia and Pacific Market Value Share and BPS Analysis by Product, 2026 and 2036
- Figure 77: South Asia and Pacific Market Y-o-Y Growth Comparison by Product, 2026-2036
- Figure 78: South Asia and Pacific Market Attractiveness Analysis by Product
- Figure 79: South Asia and Pacific Market Value Share and BPS Analysis by Form, 2026 and 2036
- Figure 80: South Asia and Pacific Market Y-o-Y Growth Comparison by Form, 2026-2036
- Figure 81: South Asia and Pacific Market Attractiveness Analysis by Form
- Figure 82: Middle East & Africa Market Value Share and BPS Analysis by Country, 2026 and 2036
- Figure 83: Middle East & Africa Market Value Share and BPS Analysis by Ingredient, 2026 and 2036
- Figure 84: Middle East & Africa Market Y-o-Y Growth Comparison by Ingredient, 2026-2036
- Figure 85: Middle East & Africa Market Attractiveness Analysis by Ingredient
- Figure 86: Middle East & Africa Market Value Share and BPS Analysis by Product, 2026 and 2036
- Figure 87: Middle East & Africa Market Y-o-Y Growth Comparison by Product, 2026-2036
- Figure 88: Middle East & Africa Market Attractiveness Analysis by Product
- Figure 89: Middle East & Africa Market Value Share and BPS Analysis by Form, 2026 and 2036
- Figure 90: Middle East & Africa Market Y-o-Y Growth Comparison by Form, 2026-2036
- Figure 91: Middle East & Africa Market Attractiveness Analysis by Form
- Figure 92: Global Market – Tier Structure Analysis
- Figure 93: Global Market – Company Share Analysis
Thank you!
You will receive an email from our Business Development Manager. Please be sure to check your SPAM/JUNK folder too
