


Published onData Blog
Can income keep up with the rising cost of a healthy diet? New CoAHD data offer fresh insights
July 27, 2026
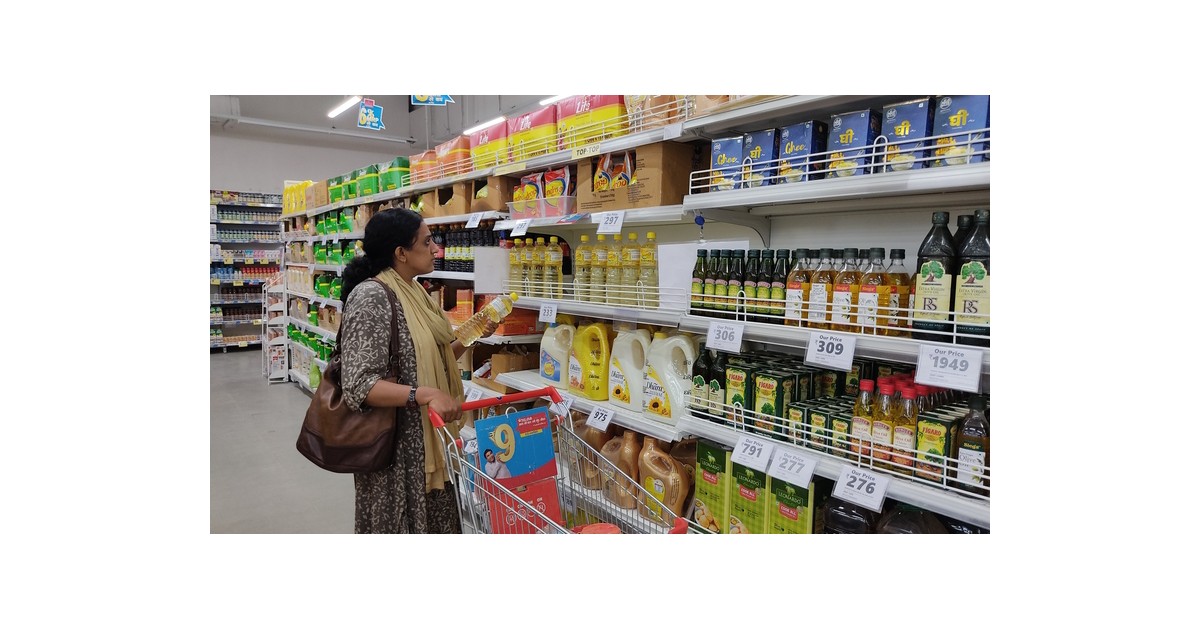
The latest Cost and Affordability of a Healthy Diet estimates show that while healthy diet costs continue to rise in many countries, affordability ultimately depends on both prices and household incomes. Pictured, a woman buying groceries in Bhopal, Madhya Pradesh, India. / Image: Shutterstock
Can people afford the foods needed for a healthy diet? The answer depends not only on food prices and nutrition needs, but also on incomes, markets, and broader economic conditions
The latest Cost and Affordability of a Healthy Diet (CoAHD) estimates, jointly produced by the Food and Agriculture Organization of the United Nations (FAO) and the World Bank Group, provide an updated picture of whether healthy diets are within reach across countries, regions, and income groups. The latest estimates are featured in the newly released The State of Food Security and Nutrition in the World 2026, the United Nations’ annual flagship report on global food security and nutrition
Beyond the headline numbers, we delve into how diet costs and affordability together shape economic access to healthy diets
What the latest data show
The population-weighted global average cost of a healthy diet, defined as the minimum cost of purchasing a healthy diet basket composed of locally available foods that meet dietary guidelines, reached 4.28 Purchasing Power Parity (PPP) dollars in 2025. At the same time, about 2.7 billion people — roughly one third of the world’s population — were unable to afford the diet
The cost varies substantially across World Bank country income groups and regions. Lower-middle-income economies had the highest average cost in 2025, at 4.36 PPP dollars per person per day, and also saw a steep rise since 2017 — an increase of 47.8 percent. High-income economies, meanwhile, recorded the highest year-over-year increase in 2025 alone, with average cost rising by 3.5 percent to 4.20 PPP dollars, and by 47.9 percent since 2017. By contrast, low-income economies experienced a reversal in recent years, with the average cost decreasing after peaking in 2023.
Among World Bank regions, Latin America and the Caribbean recorded the highest cost of a healthy diet in most years, reaching 4.91 PPP dollars per person per day in 2025. North America had the lowest regional cost, at 3.02 PPP dollars per person per day in 2025
Building on last year’s data release blog, which highlighted uneven progress in the affordability of a healthy diet, this year’s estimates confirm that divergence is deepening rather than narrowing
Globally, the number of people unable to afford a healthy diet fell by over 108 million. However, the pictures differ across country groups. In low-income economies the number rose from 482 million to 488 million between 2024 and 2025, while the lower-middle-income country group recorded the greatest progress, with a decline of 78 million people
Sub-Saharan Africa was the only World Bank region where the number of people unable to afford a healthy diet increased, rising by 13 million to 954 million. All other regions recorded improvements, with South Asia seeing the largest reduction, at 72 million people
The prevalence of unaffordability explains the difference: in most income groups and the world it fell enough to reduce the number of people unable to afford a healthy diet, despite the growing population, resulting in an improvement. In the low-income group, however, prevalence remained essentially stagnant — declining only slightly from an average of 77.5 percent in 2017 to 76.1 percent in 2025 despite an easing in the average cost of a healthy diet
A similar story is evident across World Bank regions: Sub-Saharan Africa also showed little progress, with prevalence remaining above 70 percent, while the Middle East, North Africa, Afghanistan, and Pakistan remained above 40 percent
Diet costs and affordability: mapping the path to healthy diet access
The indicators of the cost of a healthy diet and that of affordability capture two related but distinct dimensions of healthy diet access
· The cost indicator reflects the least-cost combination of locally available foods needed for a healthy diet, based on observed prices across six major food groups. It provides a national average benchmark for healthy diet cost
· The affordability indicator assesses this cost in relation to the income distribution within a country, recognizing that households must be able to cover both food and basic non-food needs.
Using data for 2021, the latest International Comparison Program (ICP) benchmark year with detailed global food price data, the chart groups observations by above- or below-median diet costs and unaffordability rates
· Above-median diet cost and above-median unaffordability:These countries face a dual constraint: healthy diets are costly, and income distributions imply that many households cannot afford them. Improving access may require both lowering the diet cost through better food systems, markets, trade, and supply chains, and strengthening low-income households’ purchasing power through income growth, jobs, and social protection. In this category, more than half fall into the low- or lower-middle-income groups, but this dual constraint is not limited to the poorest economies.
· Below-median diet cost but above-median unaffordability:These countries point more clearly to a purchasing-power problem. Even if healthy diets are relatively less costly, many households still cannot afford them, due to generally low and/or unequal incomes. This group is dominated by low- and lower-middle-income economies, reinforcing the role of limited household re
· Above-median diet cost but below-median unaffordability:In these economies, healthy diets are relatively costly, but unaffordability affects a smaller share of the population. Mostly upper-middle- and high-income economies, this group shows how stronger purchasing power can offset higher diet costs. Cost-side actions remain relevant, however, especially for improving access among marginalized and vulnerable populations. Demand-side measures can complement these efforts
· Below-median diet cost and below-median unaffordability:These economies have more favorable economic access conditions. This group consists mostly of high-income economies, where relatively lower diet costs coincide with stronger household purchasing power
Strengthening CoAHD indicator production and data quality
This year’s release includes several refinements to improve the quality, consistency, and transparency of the CoAHD indicators:
· Greater consistency across estimates. Affordability estimates now use international poverty lines in 2021 PPPs, aligning the cost and affordability sides of the CoAHD framework with the 2021 ICP benchmark results
· Improved aggregate cost estimates. Regional and global average cost estimates now use population weights, so aggregates better reflect the costs faced by people across countries. Simple averages remain available in the databases
· Updated income-group analysis. Affordability estimates use the latest World Bank income classifications available at the time of production, supporting consistency with the reporting cycle
Beyond this year’s release, FAO, the World Bank, and partners have also established a Technical Advisory Group to support methodological review, quality assurance, policy relevance, and future improvements of the CoAHD indicators
These efforts reflect an ongoing commitment to make the CoAHD indicators more reliable, comparable, and responsive to user needs as demand grows for timely data on healthy diet monitoring
Explore the latest CoAHD estimates through:
· World Bank Food Prices for Nutrition DataHub
· FAOSTAT: Cost and Affordability of a Healthy Diet (CoAHD)
The authors gratefully acknowledgeMizuki Yamanakafor preparing the PPP indicators used in the CoAHD estimates and advising on their application, as well asInyoung Songfor her contributions to data visualization. We also thank colleagues across the World Bank and FAO data teams for their collective support in producing and disseminating the CoAHD data in a timely manner
Haishan Fu
Chief Statistician of the World Bank Group and Director of the Development Data Group
More Blogs By Haishan
José Rosero Moncayo
Director of Statistics Division and Chief Statistician, Food and Agriculture Organization (FAO)
More Blogs By José Rosero
Yan Bai
Economist, Development Data Group, World Bank
More Blogs By Yan
Valentina Conti
Statistician of Statistics Division, Food and Agriculture Organization of the United Nations (FAO)
More Blogs By Valentina
Marko Rissanen
Program Manager, Development Data Group, World Bank
More Blogs By Marko
Carlo Cafiero
Senior Statistician and Economist of Statistics Division, Food and Agriculture Organization of the United Nations (FAO)
More Blogs By Carlo
