


Download PDF
Abstract
Depression is a major contributor to the global burden of diseases with substantial socioeconomic consequences. Here, to estimate the economic effects of depression, we developed a macroeconomic model using data from the World Bank and Global Burden of Disease Study 2021. The model estimated the impact of depression on labor force participation, educational attainment and work experience, adjusted for age and sex. The projected global economic burden from 2025 to 2050 is estimated at US$12 trillion (2024 US dollars), representing 0.460% of annual global gross domestic product. When suicide-related deaths attributable to depression are accounted for, based on an assumed 60% attribution rate representing the upper bound of estimates in the literature, the overall economic burden increases to US$14 trillion. The highest economic burdens are observed in the United States and China. Relative to regional gross domestic product, the impact is greatest in North America. Reduced labor force participation and productivity were identified as the predominant drivers of this cost. The macroeconomic burden of depression is substantial and inequitably distributed globally. These findings underscore the importance of addressing depression as a public health and economic concern. Reducing the health burden of depression could yield economic returns by supporting productivity and capital accumulation.
Depression is a leading contributor to the global burden of mental disorders worldwide, as measured by disability-adjusted life years (DALYs)1,2. It is characterized by a persistent low mood or loss of interest in previously pleasurable activities, rather than temporary sadness3. It was estimated that approximately 322 million people were living with depression globally in 2023 (around 127 million in males and 196 million in females), corresponding to an age-standardized prevalence rate of 3,810 per 100,000 population (3,005 and 4,611 per 100,000 population in males and females, respectively)1. The COVID-19 pandemic had further intensified this burden. A study estimated that the global prevalence of depression and anxiety increased by 27.6% and 25.6%, respectively, in the first year of the pandemic4. Another meta-analysis including over one million participants also found that 31% of children and adolescents showed depressive symptoms during this period, a substantial rise compared with pre-pandemic levels5. The associated DALY rate is projected to rise to 641 per 100,000 population by 20506.
Previous studies consistently show that depression imposes a substantial societal and economic burden in selected countries7,8,9,10,11,12,13. Evidence from both high- and middle-income countries suggests considerable healthcare costs and productivity losses associated with depression7,10,12. However, existing estimates are largely derived from selected countries and specific settings, limiting cross-country comparability. Evidence also remains particularly limited in low- and middle-income countries, where reliable prevalence estimates and other key data are often lacking13. Consequently, comparable country-level projections of the burden of depression and their economic consequences are still needed to better understand the global distribution of this burden and to inform policy responses.
The economic burden of depression has been primarily assessed through cost-of-illness (COI) analyses14,15,16,17, microsimulation models18,19, generalized linear models based on cross-sectional survey data12,20,21,22,23 and the value of a statistical life method13 to estimate the economic value of health losses. COI analyses14,15,16,17 provide intuitive estimates of direct and indirect costs but do not account for broader economic adjustment mechanisms. Microsimulation models18,19 allow detailed modeling of individual-level heterogeneity but are often data intensive and limited in scope. Regression-based approaches12,20,21,22,23 using cross-sectional data are useful for identifying associations between depression and economic outcomes but may not capture dynamic effects on the economy. Value of a statistical life-based approaches13 capture the overall welfare loss associated with morbidity and mortality, but do not explicitly model impacts on economic output or production processes. As a result, these approaches do not fully capture the macroeconomic consequences of depression24,25. This gap highlights the need for approaches that can capture economy-wide impacts.
To address these limitations, our study applied a macroeconomic model based on economic growth theory, integrating the morbidity attributable to depression as a key factor shaping the buildup of both physical and human capital to estimate the economic burden of 154 countries from 2025 to 2050. The modeling framework has been previously validated in assessments of noncommunicable diseases, road injuries, COVID-19 and key risk factors (for example, air pollution, tobacco use)26,27,28,29,30,31,32,33.
Results
Economic burden by country
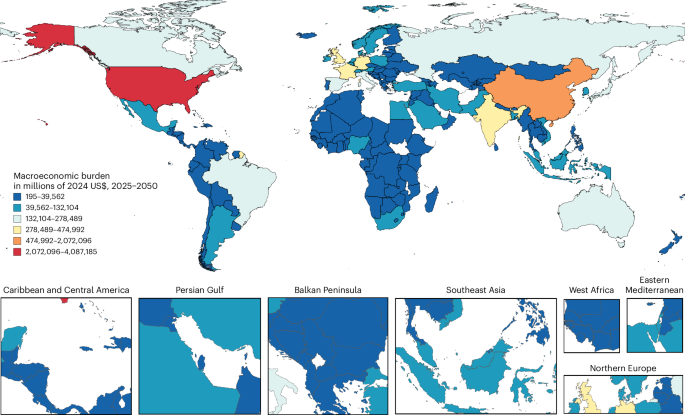
Table 1 presents findings from 154 countries with complete data. The United States bears the highest economic burden attributable to depression, estimated at US$4,087 billion, followed by China (US$2,072 billion) and the United Kingdom (US$475 billion). In terms of gross domestic product (GDP) proportions, Lesotho faces the heaviest economic burden at 0.769%, followed closely by Uganda at 0.751% and Togo at 0.735%. When measured per person, Switzerland shows the highest cost at about US$12,251, slightly above Ireland at US$11,882 and Norway at US$11,685. The geographical distribution of the economic burden and its proportion of GDP are illustrated in Figs. 1 and 2, respectively. Our analysis projects the global macroeconomic burden of depression to be US$12 trillion (95% uncertainty intervals (UI), US$10–15 trillion) between 2025 and 2050, using a 2% discount rate. Our results also imply that the economic burden of depression is equivalent to an annual tax of 0.460% (95% UI, 0.384%–0.551%) on global output, or an average per capita burden of US$1,429 (95% UI, US$1,192–1,710) over the period of 2025–2050. Economic burdens of 154 countries in different years are shown in Supplementary Table 4 in Appendix C.
The map shows the projected cumulative macroeconomic burden attributable to depression across 154 countries and territories from 2025 to 2050, estimated using a health-augmented macroeconomic model. Economic losses reflect reductions in effective labor supply associated with depression morbidity, together with the effects of treatment-related expenditures on capital accumulation. Countries are shaded according to the magnitude of estimated economic losses, with darker red colours indicating larger cumulative burdens. The highest absolute economic burdens are concentrated in the United States and China, followed by several countries in Europe and East Asia. Regional insets are included to improve visualization of geographically smaller regions and territories. Countries or territories without sufficient data are shown in white. Basemap from Natural Earth (https://www.naturalearthdata.com/).
Source data
The map shows the projected macroeconomic burden of depression expressed as a percentage of total GDP across 154 countries and territories from 2025 to 2050, based on a health-augmented macroeconomic model. Burden estimates reflect reductions in effective labor supply associated with depression morbidity and the diversion of treatment-related expenditures from savings and investment. Countries are shaded according to burden levels, with darker red colours indicating higher relative economic losses. The highest relative burdens are concentrated in parts of sub-Saharan Africa, North America and Europe, whereas lower relative burdens are observed in parts of East Asia and Latin America. Regional insets are included to improve visualization of geographically smaller regions and territories. Countries or territories without sufficient data are shown in white. Basemap from Natural Earth (https://www.naturalearthdata.com/).
Source data
Economic burden by World Bank region and income group
Analysis of the economic burden by World Bank region revealed notable disparities (Table 2). Expressed as a percentage of GDP, the burden was highest in North America (0.599%), followed by Europe and Central Asia (0.506%) and sub-Saharan Africa (0.493%). The East Asia and Pacific regions showed the lowest relative burden (0.351%). The per capita economic burden ranged widely, from US$229 in sub-Saharan Africa to US$10,730 in North America. Consequently, the total aggregate economic burden was greatest in North America (US$4,339 billion) and Europe and Central Asia (US$3,099 billion), while sub-Saharan Africa recorded the lowest (US$375 billion). Stratification by income group indicated that the highest relative burden has materialized in low-income countries (0.566% of GDP), corresponding to an aggregate loss of US$108 billion and US$134 per capita. By contrast, upper-middle-income countries showed the lowest relative burden (0.371% of GDP).
Extended Data Table 1 reveals a disparity between the geographic distribution of economic losses estimated in our study and the DALYs attributable to depression from the Global Burden of Disease (GBD) study6. While depression is projected to result in 51 million DALYs in 2025 and 65 million DALYs in 2050 globally, the economic burden is disproportionately distributed relative to both population size and DALYs. For instance, sub-Saharan Africa, which accounts for 15 million DALYs (22.7%) of the global total in 2050, bears only US$375 billion (3.0%) of the estimated US$12 trillion in economic losses projected for the period 2025–2050. Conversely, Europe and Central Asia, with 7 million DALYs (10.6%) in 2050, accounts for a substantially larger share of the economic burden, totaling US$3 trillion (24.9%) over the same period. East Asia and Pacific face a substantial burden in both health and economic terms, contributing 12 million DALYs (24.5%) of the global total in 2025, 13 million DALYs (20.3%) in 2050 and US$3,035 billion (24.4%) of the overall economic loss. Projections indicate a shift in the distribution of DALYs, with an increasing proportion occurring in low-income and lower-middle-income countries and a corresponding decrease in high-income countries. By 2050, lower-middle-income countries are expected to contribute 47.7% of the global DALYs attributable to depression.
Roles of physical capital decline in the economic burden of depression
Our analysis quantified the proportion of the total economic burden of depression attributable to declines in physical capital from 2025 to 2050. The contribution of physical capital decline was consistently smaller than that of labor force reductions. Globally, the proportion of the total economic burden linked to physical capital decline is projected to increase from 1.203% in 2025 to 9.027% by 2050. Substantial regional heterogeneity was observed (Fig. 3). In 2025, capital contribution is highest in North America at 1.847% and lowest in sub-Saharan Africa at 0.286%. In 2050, North America is projected to have the highest proportion (13.039%), while sub-Saharan Africa is projected to have the lowest (3.421%). Across income groups in 2050 (Fig. 4), high-income countries are projected to experience the highest share (10.905%), followed by upper-middle-income (6.570%), lower-middle-income (3.918%) and low-income countries (2.956%).
The blue charts depict the economic burden attributable to physical capital decline, while the orange charts represent the economic burden associated with labor force reduction. The red lines illustrate the temporal trends in the proportional contribution of physical capital decline to the total economic burden. The cumulative economic burden is adjusted for discounting at a rate of 2% per year
Source data
The blue charts depict the economic burden attributable to physical capital decline, while the orange charts represent the economic burden associated with labor force reduction. The red lines illustrate the temporal trends in the proportional contribution of physical capital decline to the total economic burden. The cumulative economic burden is adjusted for discounting at a rate of 2% per year
Source data
Sensitivity analyses
Supplementary Tables 5 and 6 show the stability of our results by changing all input parameters at once. The results show that the estimated global economic burden of depression dropped slightly to US$10,928 billion, or about US$1,256 per person—figures that are still close to the main estimate of US$12,435 billion and US$1,429 per person. Supplementary Tables 7–10 show additional tests using different discount rates of 0% and 3%. With no discounting (0%), the global economic burden rose sharply to US$16,113 billion, or US$1,852 per person. By contrast, using a 3% rate lowered the total to US$10,997 billion (US$1,264 per person), just below the main estimate based on a 2% rate. Although the absolute numbers shifted under these conditions, the overall pattern stayed the same: the United States, China and the United Kingdom consistently showed the highest economic burdens, while the Central African Republic, Comoros and Guinea-Bissau remained among the lowest.
When the upper bound of GDP was used as an input to the model (Supplementary Tables 11 and 12), the total economic burden amounts to US$13,868 billion, corresponding to 0.457% of GDP. When the lower-bound of GDP was used as an input to the model (Supplementary Tables 13 and 14), the total economic burden is US$11,101 billion, corresponding to 0.462% of GDP. These results are broadly consistent with the baseline estimates. To reflect the substantial cross-country variation in reported treatment costs (Supplementary Table 2), we conducted sensitivity analyses by varying treatment costs. Under the upper-bound scenario, the economic burden reaches 0.832% of GDP (Supplementary Tables 15 and 16), while under the lower-bound scenario, it declines to 0.439% (Supplementary Tables 17 and 18), both of which remain consistent with the baseline estimate.
Incorporating mortality increases the estimated economic burden, but it does not materially alter the overall magnitude of the results. Under the assumption that 60% of suicide deaths are attributable to depression, the economic burden share increases to 0.512%, representing nearly a 10% increase compared with the baseline (Supplementary Tables 19 and 20). Under the assumption that 16% of suicide deaths are attributable to depression, the economic burden share rises only slightly to 0.474% (Supplementary Tables 21 and 22). These findings suggest that, while depression-related mortality contributes to the total burden, morbidity-related productivity losses remain the dominant driver in the model.
Discussion
This study provides a full global estimate of the economic burden of depression over time using a macroeconomic modeling approach. Our results highlight several important insights. First, we project that depression will result in a cumulative global economic loss of US$12 trillion between 2025 and 2050, equivalent to 0.460% of the total projected cumulative global GDP. Second, this work represents a systematic attempt to estimate the macroeconomic burden of depression across 154 countries, contributing to 96% of the total population. Third, our findings reveal substantial cross-country heterogeneity in both the health and economic consequences of depression. Among the main drivers, lower labor force participation stands out as the primary way depression affects the economy, while the decline in physical capital investment has a smaller role.
Most studies examining the economic burden of depression classify costs into three groups: direct medical, direct nonmedical and indirect costs. Direct medical costs cover spending on healthcare services such as hospital stays, clinic visits and medication. Direct nonmedical costs include things such as transportation and caregiving. Indirect costs arise mainly from lost productivity, when people miss work, struggle to perform at their usual level, or die prematurely9. While useful, this traditional framework often overlooks the broader effects depression has on macroeconomic growth over time. Studies have shown that every US$1 invested in scaling up treatment for depression and anxiety yields a return of US$4 in improved health and productivity34. Therefore, rather than viewing treatment costs as a drain on economic resources, they should be considered strategic investments that contribute to human capital development and economic growth. Adopting a macroeconomic perspective that accounts for the cumulative effects of depression on human and physical capital formation offers a more accurate estimation of its economic burden. Our perspective mirrors methods used to study the economic effects of other major health issues and highlights why funding mental health is essential for sustainable economic growth35.
Our results are broadly comparable to existing evidence. For example, the World Health Organization has estimated that depression and anxiety together cause around US$1.15 trillion (in 2013 USD) in global losses each year (equivalent to about US$1.55 trillion in 2024 USD, roughly 1.040% of global GDP)34,36. Given lower per-person costs for anxiety34,37 despite comparable prevalence, depression probably accounts for a larger share of the combined economic burden, broadly consistent with our global estimates. Differences between our estimates and previous studies largely reflect variations in methodological approaches (Supplementary Table 23). In China, the estimated direct medical costs7 are substantially lower than our burden, as our framework additionally captures broader economic impacts, including the cumulative effects of medical costs on physical capital accumulation. By contrast, the US study using incremental costs yields estimates broadly consistent with ours, suggesting that empirically derived excess costs associated with depression may approximate real-world economic impacts8. By comparison, studies applying the human capital approach, such as those from the United States9, Romania10 and Switzerland11, report substantially higher estimates. These approaches directly value lost productivity, particularly due to premature mortality, by multiplying lost work time by wages. By contrast, our model incorporates macroeconomic adjustment mechanisms, whereby labor-market replacement mitigates part of the productivity loss when individuals exit the workforce. As a result, while economic losses remain substantial, they are lower than estimates based purely on forgone earnings.
Previous studies have shown that depression is associated with productivity losses through reduced employment, absenteeism, presenteeism and premature mortality9,35. For example, COI studies of treatment-resistant depression and major depression with suicide risk have estimated substantial indirect productivity costs from reduced employment, absenteeism, presenteeism and premature death38. Cross-country studies have also shown that depression-related absenteeism and presenteeism costs vary markedly across countries, with presenteeism often accounting for a large share of workplace productivity loss39. In addition, systematic reviews have shown that estimates of work impairment and productivity-loss costs associated with depression vary substantially across studies because of differences in study populations, measurement instruments and definitions of productivity loss40. This heterogeneity limits their direct use as standardized inputs for long-term macroeconomic projections across 154 countries and territories. Therefore, in this study, years lived with disability (YLDs) were used as standardized indicators of functional health loss that may affect effective labor supply, thereby supporting cross-country comparability within the macroeconomic modeling framework6,41. In addition, relatively few previous macroeconomic burden studies of depression have incorporated suicide-related mortality into long-term economic projections. In our sensitivity analyses, inclusion of suicide-related mortality resulted in higher projected macroeconomic losses across regions and income groups, suggesting that the overall economic burden of depression may be underestimated when mortality effects are excluded.
Compared with other major illnesses such as cancer or chronic obstructive pulmonary disease30,32, depression stands out for its especially high burden of illness. Several factors help explain this pattern. First, depression affects a large share of the global population. It has been reported that nearly one billion people worldwide live with some form of mental disorder42, and about 322 million people experience depression globally in 20231. Second, depression typically emerges early in life37. Depression typically appears during adolescence or early adulthood, a stage when people are pursuing education, starting careers and building families. Because it can last for many years, or even a lifetime, its effects accumulate over time. By contrast, many cancers and other major physical illnesses are more often diagnosed later in life. Third, depression makes it hard to work and be productive. The main symptoms of depression, such as low energy, trouble concentrating and loss of motivation, make it hard for a person to do their everyday tasks and work. This leads to substantial losses in productivity and reduced workforce participation. As a result, despite having lower direct mortality rates than cancer or chronic obstructive pulmonary disease, depression still imposes an immense global health burden.
Disparities in the economic burden of nations and regions are evident. For example, Lesotho, Uganda and Togo face the highest economic burden as a percentage of GDP. According to GBD 2021 Forecasting Collaborators6, the global age-standardized YLD rate for depression in Lesotho, Uganda and Togo is consistently higher than the global average over the period 2022–2050, which helps explain the relatively high economic burden observed in these countries. Furthermore, high-income countries shoulder much of the depression economic burden. In North America, the overall health burden is particularly high, probably tied to both the widespread presence of mental health conditions and the limits of mental health services. The per-person economic impact is greatest in North America, Europe and Central Asia, which may reflect the higher levels of education and human capital in these regions. In upper-middle-income countries, the burden is lower (around 0.371% of the GDP). One reason for this gap could be the relatively low rate of depression reported in China, whose large population and economy largely influence this income group’s overall figures.
To lessen the global economic impact of depression, we need to work together to make sure that inexpensive, evidence-based therapies are available and that supportive policies are in place. Internet-based cognitive behavioral therapy is one of the most cost-effective solutions, especially in low- and middle-income countries. With low delivery expenses due to digital platforms and less clinician involvement, internet-based cognitive behavioral therapy offers a highly scalable solution that can achieve high benefit-to-cost ratios43. Government policy support is also important for reducing the burden of depression. Increasing investment in mental health services, especially through integration into primary care, can extend access, eliminate stigma and promote early intervention, for an estimated yearly cost of only US$1–5 per capita in low-resource countries44. Addressing the broader social determinants of mental health and combating stigma can further amplify the effectiveness of these interventions, enhancing their cost-efficiency and creating a sustainable path toward improving global mental health outcomes45.
This study has several limitations that warrant consideration. First, while mortality related to suicide is incorporated in sensitivity analyses, our model does not fully capture non-suicide mortality associated with depression. Depression may increase mortality risk through multiple pathways, including comorbid conditions and health-related behaviors. Our estimates should be interpreted as conservative with respect to the broader mortality consequences of depression. Second, while our dataset consisted of 154 countries and territories, representing 96% of the global population, the exclusion of the remaining 4% may limit the generalizability of our findings to some extent. Third, our estimation of treatment costs for depression relied primarily on US-based data scaled by country-specific health expenditure, which may not accurately reflect global treatment patterns. However, given that treatment costs constitute a relatively small proportion of the overall economic burden of depression, this potential bias is unlikely to substantially affect our primary conclusions. Fourth, prevalence estimates were mostly based on household surveys, which are often not nationally representative and rely on self-reported questionnaires rather than clinical diagnosis. Cultural differences in reporting depressive symptoms may introduce measurement bias and affect cross-country comparability. However, the GBD study estimation frameworks apply standardized methods to harmonize these data and remain as a comprehensive source available for global analysis. Fifth, although depression is associated with substantial productivity losses, available productivity estimates remain heterogeneous across countries and study settings. Therefore, YLDs were used as standardized indicators of functional health loss to support cross-country comparability rather than as direct measures of productivity loss.
Overall, depression places a heavy strain on the global economy, accounting for about 0.460% of the world’s annual GDP. This burden, however, is uneven across regions. North America faces the greatest impact at 0.599% of GDP, followed by Europe and Central Asia at 0.506%, and sub-Saharan Africa at 0.493%. These numbers highlight an urgent need to strengthen global efforts aimed at preventing and treating depression, ensuring that investment in mental health becomes a priority to reduce its wide-reaching economic and social costs.
Methods
Data sources
This study used officially published and publicly available data from 154 countries and territories. Savings rates were obtained from the World Bank, GDP projections from the GBD Health Financing Collaborator Network46 and incidence and prevalence data from the GBD 2021 Forecasting Collaborators6. Treatment costs for depression in the United States were derived from a previous study47, which systematically estimated national healthcare and public health spending by condition. Based on these official data sources, we aimed to provide an objective estimation of the economic burden of depression. Comprehensive details regarding the data sources for disease, population, labor, education and macroeconomic indicators, along with the parameter values and data sources used in the macroeconomic model, are provided in Appendix A and Supplementary Table 1. To ensure that the results are more accessible, all cost estimates were standardized and expressed in 2024 US dollars.
Macroeconomic model
We estimated the macroeconomic burden of depression across 154 countries and territories that met our inclusion criteria for complete data availability. Depression was defined according to the standardized classification system used in the GBD study48. We directly calculated the macroeconomic burden of depression for 154 countries using the health macroeconomic model described in detail in previous studies and in Appendix B. We calculated all age–sex-specific morbidity rates, education levels, population sizes and labor force participation rates to estimate the economic burden of depression for each country in our model.
In our economic framework, depression imposes substantial economic costs through three interrelated mechanisms that collectively diminish both human and physical capital. First, these disorders reduce the available labor supply mainly through morbidity effects as illness-related productivity declines and absenteeism impair workforce efficiency. Second, depression also slows down the process of building capital. When people struggle with depression, their spending habits often change as they may use savings to cover medical bills that insurance does not fully pay for. At the same time, higher insurance premiums and greater public healthcare spending place pressure on the broader financial system. Together, these factors reduce overall savings and investment. Some of this money simply shifts from general spending to healthcare, but when funds move away from productive investments and into medical costs, the long-term impact can be serious as it weakens both capital growth and productivity, ultimately limiting future economic development. This combined effect on labor and capital highlights how depression affects the economy in ways that go far beyond the immediate cost of treatment. Different from previous studies26,27,28,29,30,31,32, deaths associated with depression are often recorded under other causes, such as cardiovascular diseases or suicide, rather than being directly attributed to depression itself 49,50,51. This makes it challenging to accurately estimate mortality specifically linked to depression.
Specifically, we estimate the economic burden of depression by translating morbidity into changes in effective labor supply and capital accumulation within a macroeconomic framework. For labor input, we use age–sex-specific prevalence of depression from GBD projections and apply disability weights to adjust effective labor supply. Disability weight represents proportional loss of functional health on a standardized 0–1 scale and is used in the GBD framework to estimate nonfatal health loss52. In this study, instead of interpreting them as direct measures of productivity loss, they were used as standardized indicators of reductions in functional health capacity associated with depression, which may affect effective labor supply at the population level within the health-augmented macroeconomic framework. Related approaches have been used in previous burden-of-disease and productivity-loss studies of health conditions, such as depression38, uncorrected presbyopia53 and myopia54. These studies incorporated disability-based measures together with economic or labor-related indicators to estimate the broader health and productivity consequences associated with disease burden. These estimates are combined with country-specific demographics, baseline labor participation rates, human capital, education and working experience to construct effective labor supply across countries. Mortality attributable to depression is not included in the main analysis owing to challenges in depression attribution. To assess its potential impact, we incorporate mortality in sensitivity analyses (Appendix D) by applying alternative assumptions on the proportion of suicide deaths attributable to depression. In addition, treatment costs are incorporated as a reduction in resources available for savings and investment, thereby affecting the trajectory of capital accumulation over time. The magnitude of this effect is determined using country-specific macroeconomic inputs, including GDP, savings rates and health expenditure levels. Details of treatment cost inputs and cross-country extrapolations are provided in Supplementary Table 1.
Statistical analyses
To estimate the macroeconomic burden of depression, we compared total output (GDP) for the period 2025–2050 under two scenarios: (1) the status quo scenario with no interventions to mitigate morbidity from depression relative to current and projected rates and (2) the counterfactual scenario assuming complete elimination of depression. The macroeconomic burden of depression was then quantified as the cumulative difference in projected annual GDP for these two scenarios. Different from previous studies26,27,28,29,30,31,32, this study uses prevalence and incidence rates derived from the GBD study6 to estimate the average duration time (Supplementary Table 3) of depression. The baseline estimate is computed subject to a yearly discount rate of 2%, and the results are also provided for discount rates of 0% and 3%.
We performed sensitivity analyses by varying morbidity rates across all 154 countries. Baseline estimates were derived using mean morbidity rates from the GBD study. To account for uncertainty, we calculated both lower- and upper-case scenarios using the lower and upper limits of the GBD data. For the main analysis, we used a 2% discount rate. Additional sensitivity analyses were conducted using alternative discount rates (0% and 3%) and variations in key model parameters. As GDP per capita is subject to considerable uncertainty, we re-ran the model using the upper and lower bounds of GDP to assess the differences compared with the baseline results. In addition, because treatment costs vary across regions, we reviewed studies from multiple countries55,56,57 to compare their estimates with those reported in a previous study47. To account for this variation and the uncertainty in cost estimates, we incorporated upper and lower bounds of treatment costs into the model as part of sensitivity analyses, allowing us to assess how differences in treatment costs affect the results relative to the baseline.
Notably, the GBD study did not include suicide-related deaths in its estimates of mortality attributable to depression. To account for the potential contribution of mortality, we incorporated suicide deaths as a sensitivity analysis. While global suicide estimates are available58, the proportion attributable specifically to depression remains uncertain. Existing literature indicates that approximately 16%–60% of suicide deaths are linked to underlying depression59,60,61,62,63. Based on the literature, we applied a range of 16%–60% to total suicide deaths to estimate depression-attributable mortality. These adjusted mortality estimates were then incorporated into the model to assess their impact on the overall economic burden. All sensitivity analysis results are provided in Appendix D.
Ethics and inclusion statement
This analysis was not submitted for institutional ethical approval because all data used in this study were aggregate level, de-identified and publicly available. No direct human participant recruitment, intervention, primary data collection or access to identifiable individual-level records was involved. The GBD study estimates draw on epidemiological data and statistical modeling from countries and territories worldwide, including low- and middle-income countries. The World Bank, United Nations World Population Prospects, International Labour Organization and Barro Lee Educational Attainment Database provide publicly available national and regional data on economic output, population, labor force participation and educational attainment. These data sources are relevant to countries and regions across diverse geographic and socioeconomic settings. The authorship team jointly contributed expertise in global health, economics, epidemiology and public health. Roles and responsibilities were agreed upon by all authors.
Reporting summary
Further information on research design is available in the Nature Portfolio Reporting Summary linked to this article
Data availability
All data used in this study were obtained from publicly available repositories and databases, including the Global Burden of Disease (GBD) Study database (https://ghdx.healthdata.org/), the World Bank Open Data platform (https://data.worldbank.org/), the United Nations World Population Prospects database (https://population.un.org/wpp/), the International Labour Organization database (https://ilostat.ilo.org/) and the Barro-Lee Educational Attainment Database (http://www.barrolee.com/). Detailed descriptions of the data sources, parameter values and processing procedures are provided in the Methods and Appendix A. No new datasets were generated for this study. Source data are provided with this paper.
Code availability
The code used for the macroeconomic modeling analyses and generation of descriptive tables and figures is publicly availableing-depression
References
GBD 2023 Disease and Injury and Risk Factor Collaborators. Burden of 375 diseases and injuries, risk-attributable burden of 88 risk factors, and healthy life expectancy in 204 countries and territories, including 660 subnational locations, 1990–2023: a systematic analysis for the Global Burden of Disease Study 2023. Lancet406, P1873–P1922 (2025)
Fan, Y., Fan, A., Yang, Z. & Fan, D. Global burden of mental disorders in 204 countries and territories, 1990–2021: results from the global burden of disease study 2021. BMC Psychiatry25, 486 (2025)
Malhi, G. S. & Mann, J. J. Depression. Lancet392, 2299–2312 (2018)
Santomauro, D. F. et al. Global prevalence and burden of depressive and anxiety disorders in 204 countries and territories in 2020 due to the COVID-19 pandemic. Lancet398, 1700–1712 (2021)
Deng, J. et al. Prevalence of mental health symptoms in children and adolescents during the COVID-19 pandemic: a meta-analysis. Ann. N. Y. Acad. Sci.1520, 53–73 (2023)
GBD 2021 Forecasting Collaborators. Burden of disease scenarios for 204 countries and territories, 2022–2050: a forecasting analysis for the Global Burden of Disease Study 2021. Lancet403, 2204–2256 (2024)
Ding, R. et al. Medical service utilisation and direct medical cost of depression: a cross-sectional analysis of urban medical claims data from China. BMJ Open12, e056422 (2022)
Greenberg, P. E., Fournier, A. A., Sisitsky, T., Pike, C. T. & Kessler, R. C. The economic burden of adults with major depressive disorder in the United States (2005 and 2010). J. Clin. Psychiatry76, 155–162 (2015)
Greenberg, P. et al. The economic burden of adults with major depressive disorder in the United States (2019). Adv. Ther.40, 4460–4479 (2023)
Iordache, M. M. et al. Depression in Central and Eastern Europe: how much it costs? Cost of depression in Romania. Healthcare11, 921 (2023)
Tomonaga, Y. et al. The economic burden of depression in Switzerland. Pharmacoeconomics31, 237–250 (2013)
Chodavadia, P., Teo, I., Poremski, D., Fung, D. S. S. & Finkelstein, E. A. Prevalence and economic burden of depression and anxiety symptoms among Singaporean adults: results from a 2022 web panel. BMC Psychiatry23, 104 (2023)
Arias, D., Saxena, S. & Verguet, S. Quantifying the global burden of mental disorders and their economic value. EClinicalMedicine54, 101675 (2022)
Niazi, S. K & Bobo W. V. The economic burden of treatment-resistant depression: Cost-of-illness perspective. in Managing Treatment-ResistantDepression: Road to Novel Therapeutics 23–45 (Academic Press, 2022)
Torres-Granados, G. I. et al. The economic costs of insomnia comorbid with depression and anxiety disorders: an observational study at a sleep clinic in Mexico. Sleep Biol. Rhythms21, 23–31 (2023)
Mercedes, B. P. D. C., Nunes da Silva, E., Carregaro, R. L. & Miasso, A. I. Economic burden of depression in Brazil: a cost-of-illness study based on productivity losses and healthcare costs between 2010 to 2018. Expert Rev. Pharmacoecon. Outcomes Res.23, 181–189 (2023)
Zhu, L., Ferries, E., Suthoff, E., Namjoshi, M. & Bera, R. Economic burden and antidepressant treatment patterns among patients with major depressive disorder in the United States. J. Manag. Care Spec. Pharm.28, S2–S12 (2022)
Ghanbarian, S. et al. A Canadian simulation model for major depressive disorder: study protocol. Pharmacoecon. Open8, 493–505 (2024)
Seabury, S. A. et al. Measuring the lifetime costs of serious mental illness and the mitigating effects of educational attainment. Health Aff.38, 652–659 (2019)
Neo, J. W. et al. Excess costs of depression among a population-based older adults with chronic diseases in Singapore. BMC Public Health24, 3119 (2024)
Zhao, X. et al. Clinical and economic burden of anxiety/depression among older adult COPD patients: evidence from the COPD-AD China Registry study. Front. Psychiatry14, 1221767 (2024)
Prasartpornsirichoke, J. et al. The prevalence and economic burden of treatment-resistant depression in Thailand. BMC Public Health23, 1541 (2023)
Joshi, K., Cambron-Mellott, M. J., Costantino, H., Pfau, A. & Jha, M. K. The real-world burden of adults with major depressive disorder with moderate or severe insomnia symptoms in the United States. J. Affect. Disord.323, 698–706 (2023)
Jo, C. Cost-of-illness studies: concepts, scopes, and methods. Clin. Mol. Hepatol.20, 327–337 (2014)
The World Health Report: Health Systems Financing: The Path to Universal Coverage (World Health Organization, 2010)
Bloom, D. E., Chen, S., Kuhn, M. & Prettner, K. in Live Long and Prosper? The Economics of Ageing Populations (ed. Bloom, D. E.) (VoxEU.org and Centre for Economic Policy Research (CEPR), 2019)
Chen, S., Kuhn, M., Prettner, K. & Bloom, D. E. Noncommunicable diseases attributable to tobacco use in China: macroeconomic burden and tobacco control policies. Health Aff.38, 1832–1839 (2019)
Chen, S. & Bloom, D. E. The macroeconomic burden of noncommunicable diseases associated with air pollution in China. PLoS ONE14, e0215663 (2019)
Bloom, D. E. et al. The economic burden of chronic diseases: estimates and projections for China, Japan, and South Korea. J. Econ. Ageing17, 100163 (2020)
Chen, S. et al. Estimates and projections of the global economic cost of 29 cancers in 204 countries and territories from 2020 to 2050. JAMA Oncol.9, 465–472 (2023)
Chen, S. et al. The global macroeconomic burden of Alzheimer’s disease and other dementias: estimates and projections for 152 countries or territories. Lancet Glob. Health12, e1534–e1543 (2024)
Chen, S. et al. The global economic burden of chronic obstructive pulmonary disease for 204 countries and territories in 2020–50: a health-augmented macroeconomic modelling study. Lancet Glob. Health11, e1183–e1193 (2023)
Chen, S. et al. The global macroeconomic burden of diabetes mellitus. Nat. Med.32, 126–138 (2026)
Chisholm, D. et al. Scaling-up treatment of depression and anxiety: a global return on investment analysis. Lancet Psychiatry3, 415–424 (2016)
Trautmann, S., Rehm, J. & Wittchen, H. U. The economic costs of mental disorders: do our societies react appropriately to the burden of mental disorders? EMBO Rep.17, 1245–1249 (2016)
World Mental Health Today: Latest Data (World Health Organization, 2025)
Solmi, M. et al. Age at onset of mental disorders worldwide: large-scale meta-analysis of 192 epidemiological studies. Mol. Psychiatry27, 281–295 (2022)
Sousa, R. D. et al. Treatment-resistant depression and major depression with suicide risk—the cost of illness and burden of disease. Front. Public Health10, 898491 (2022)
Evans-Lacko, S. & Knapp, M. Global patterns of workplace productivity for people with depression: absenteeism and presenteeism costs across eight diverse countries. Soc. Psychiatry Psychiatr. Epidemiol.51, 1525–1537 (2016)
Rojanasarot, S., Bhattacharyya, S. K. & Edwards, N. Productivity loss and productivity loss costs to United States employers due to priority conditions: a systematic review. J. Med. Econ.26, 262–270 (2023)
Andrews, G., Sanderson, K. & Beard, J. Burden of disease: Methods of calculating disability from mental disorder. Br. J. Psychiatry173, 123–131 (1998)
GBD Mental Disorders Collaborators. Global, regional, and national burden of 12 mental disorders in 204 countries and territories, 1990–2019: a systematic analysis for the Global Burden of Disease Study 2019. Lancet Psychiatry9, 137–150 (2022)
Zhou, W. et al. Cost utility analysis of internet-based cognitive behavioral therapy for major depressive disorder: randomized controlled trial. J. Med. Internet Res.27, e67567 (2025)
Cubillos, L. et al. The effectiveness and cost-effectiveness of integrating mental health services in primary care in low- and middle-income countries: systematic review. BJPsych Bull.45, 40–52 (2021)
Siddiqui, S. et al. Scaling up community-delivered mental health support and care: a landscape analysis. Front. Public Health10, 992222 (2022)
Global Burden of Disease Collaborative Network Gross Domestic Product Per Capita 1960–2050—FGH 2023 (Institute for Health Metrics and Evaluation, accessed 1 October 2025); https://ghdx.healthdata.org/record/ihme-data/global-gdp-per-capita-1960-2050-fgh-2023
Dieleman, J. L. et al. Tracking US health care spending by health condition and county. JAMA333, 1051–1061 (2025)
GBD 2021 Diseases and Injuries CollaboratorsGlobal incidence, prevalence, years lived with disability (YLDs), disability-adjusted life-years (DALYs), and healthy life expectancy (HALE) for 371 diseases and injuries in 204 countries and territories and 811 subnational locations, 1990–2021: a systematic analysis for the Global Burden of Disease Study 2021. Lancet403, 2133–2161 (2024)
Huang, Y., Chen, X. & Cai, X. The non-linear association between depression scores and all-cause mortality: a cohort study based on NHANES 2005–2018 data. Sci. Rep.15, 15492 (2025)
Chen, X. et al. Depression and health outcomes: an umbrella review of systematic reviews and meta-analyses of observational studies. Transl. Psychiatry15, 298 (2025)
Russ, T. C. et al. Association between psychological distress and mortality: individual participant pooled analysis of 10 prospective cohort studies. BMJ345, e4933 (2012)
Salomon, J. A. et al. Disability weights for the Global Burden of Disease 2013 study. Lancet Glob. Health3, e712–e723 (2015)
Frick, K. D., Joy, S. M., Wilson, D. A., Naidoo, K. S. & Holden, B. A. The global burden of potential productivity loss from uncorrected presbyopia. Ophthalmology122, 1706–1710 (2015)
Naidoo, K. S. et al. Potential lost productivity resulting from the global burden of myopia: systematic review, meta-analysis, and modeling. Ophthalmology126, 338–346 (2019)
Vieta, E. et al. Epidemiology and costs of depressive disorder in Spain: the EPICO study. Eur. Neuropsychopharmacol.50, 93–103 (2021)
Yamabe, K., Liebert, R., Flores, N. & Pashos, C. L. Health-related quality of life outcomes, economic burden, and associated costs among diagnosed and undiagnosed depression patients in Japan. Clinicoecon. Outcomes Res.11, 233–243 (2019)
Dhodi, D. K., Sinha, S. R., Dawer, F. & Chavan, M. S. A prospective cross-sectional study to evaluate the economic burden of patients diagnosed with depression in a tertiary care hospital. Int. J. Basic Clin. Pharmacol.9, 722–725 (2020)
GBD Suicide Collaborators.Global, regional, and national burden of suicide, 1990-2021: a systematic analysis for the Global Burden of Disease Study 2021. Lancet Public Health10, e189–e202 (2025)
Arafat, S. M. Y. et al. Depression and suicidal behavior in South Asia: a systematic review and meta-analysis. Glob. Ment. Health9, 181–192 (2022)
Juan, Y. C. et al. Population-attributable fraction of psychiatric and physical disorders for suicide among older adults in Taiwan. J. Affect. Disord.360, 88–96 (2024)
Arafat, S. M. Y., Khan, M. A. S., Knipe, D. & Khan, M. M. Population attributable fractions of clinical and social risk factors for suicide in Bangladesh: finding from a case-control psychological autopsy study. Brain Behav.11, e2409 (2021)
Wang, J. et al. The association between depression and all-cause, cause-specific mortality in the Chinese population—China, 2010–2022. China CDC Wkly.6, 1022–1027 (2024)
Ng, C. W. M., How, C. H. & Ng, Y. P. Depression in primary care: assessing suicide risk. Singapore Med. J.58, 72–77 (2017)
Acknowledgements
We thank the Institute for Health Metrics and Evaluation and the Global Burden of Disease Study collaborators for providing publicly available disease burden estimates. We also acknowledge the World Bank, the United Nations Department of Economic and Social Affairs, Population Division, the International Labour Organization and the Barro Lee Educational Attainment Database for making the demographic, economic, labor market and educational data used in this study openly accessible
Funding
Z.C. and S.C. disclose support for the research of this work from the Noncommunicable Chronic Diseases-National Science and Technology Major Project (Project Number 2023ZD0506000), S.C. discloses support for the research of this work from the Non-profit Central Research Institute Fund of the Chinese Academy of Medical Sciences (2022-ZHCH330-01), S.C. and T.W.B. disclose support for the research of this work from Horizon Europe (HORIZON-MSCA-2021-SE-01; Project Number 101086139-PoPMeD-SuSDeV). The funders had no role in the study design, data collection, data analysis, data interpretation or writing of the report.
Author information
Author notes
These authors contributed equally: Zhong Cao, Yuheng Luo
Authors and Affiliations
Heidelberg Institute of Global Health, Faculty of Medicine and University Hospital, Heidelberg University, Heidelberg, Germany
Zhong Cao, Till Winfried Bärnighausen & Simiao Chen
School of Health Policy and Management, Chinese Academy of Medical Sciences & Peking Union Medical College, Beijing, China
Yuheng Luo
Department of Health Policy and Management, Gillings School of Global Public Health, University of North Carolina at Chapel Hill, Chapel Hill, NC, USA
Lirui Jiao
School of Population Medicine and Public Health, Chinese Academy of Medical Sciences & Peking Union Medical College, Beijing, China
Wenjin Chen & Simiao Chen
Vienna University of Economics and Business (WU), Department of Economics, Vienna, Austria
Klaus Prettner
Vienna Institute of Demography, Austrian Academy of Sciences, Vienna, Austria
Michael Kuhn
Harvard T.H. Chan School of Public Health, Harvard University, Boston, MA, USA
David E. Bloom
Department of Epidemiology and Biostatistics and Institute for Global Health Sciences University of California, San Francisco, CA, USA
Dean T. Jamison
Authors
- Zhong CaoView author publications
Search author on:PubMed Google Scholar
- Yuheng LuoView author publications
Search author on:PubMed Google Scholar
- Lirui JiaoView author publications
Search author on:PubMed Google Scholar
- Wenjin ChenView author publications
Search author on:PubMed Google Scholar
- Klaus PrettnerView author publications
Search author on:PubMed Google Scholar
- Michael KuhnView author publications
Search author on:PubMed Google Scholar
- David E. BloomView author publications
Search author on:PubMed Google Scholar
- Dean T. JamisonView author publications
Search author on:PubMed Google Scholar
- Till Winfried BärnighausenView author publications
Search author on:PubMed Google Scholar
- Simiao ChenView author publications
Search author on:PubMed Google Scholar
Contributions
Z.C. and Y.L. contributed equally as co-first authors. Z.C. contributed to the study design and drafted the paper. Y.L. contributed to the acquisition, analysis or interpretation of data. S.C. obtained funding, developed the methodology and conceived the study. L.J., W.C., K.P., M.K., D.E.B., D.T.J. and T.W.B. contributed to the critical revision of the paper for important intellectual content. S.C. and Z.C. had full access to all the data in the study and take responsibility for the integrity of the data and the accuracy of the data analysis.
Ethics declarations
Competing interests
The authors declare no competing interests
Peer review
Peer review information
Nature Medicine thanks Hai Fang, Preston Ngo and the other, anonymous, reviewer(s) for their contribution to the peer review of this work. Primary Handling Editor: Ming Yang, in collaboration with the Nature Medicine team
Additional information
Publisher’s note Springer Nature remains neutral with regard to jurisdictional claims in published maps and institutional affiliations
Extended data
Supplementary information
Supplementary Information (download PDF )
Supplementary Discussion and Tables 1–23
Reporting Summary (download PDF )
Source data
Source Data Figs. 1–4 (download XLSX )
Statistical
Rights and permissions
Open Access This article is licensed under a Creative Commons Attribution 4.0 International License, which permits use, sharing, adaptation, distribution and reproduction in any medium or format, as long as you give appropriate credit to the original author(s) and the source, provide a link to the Creative Commons licence, and indicate if changes were made. The images or other third party material in this article are included in the article’s Creative Commons licence, unless indicated otherwise in a credit line to the material. If material is not included in the article’s Creative Commons licence and your intended use is not permitted by statutory regulation or exceeds the permitted use, you will need to obtain permission directly from the copyright holder. To view a copy of this licence, visit http://creativecommons.org/licenses/by/4.0/.
About this article
Cite this article
Cao, Z., Luo, Y., Jiao, L. et al. Global economic burden of depression in 154 countries from 2025 to 2050.
Nat Med (2026). https://doi.org/10.1038/s41591-026-04548-7
Received:19 January 2026
Accepted:25 June 2026
Published:28 July 2026
Version of record:28 July 2026
DOI
:https://doi.org/10.1038/s41591-026-04548-7
