


Download PDF
Abstract
Type 2 inflammation is coordinated by remarkably durable CD4+ T helper 2 (TH2) cell responses, yet the cellular architecture that drives this chronic inflammation and prevents exhaustion remains poorly understood. To define the TH2 landscape in chronic type 2 inflammation, we established a mouse model of long-term pulmonary allergen exposure, finding that type 2 inflammation was broadly sustained over time and included an expanded T cell factor 1-expressing progenitor-like population. In vivo, lung TH2 progenitors were sufficient to both initiate and sustain type 2 inflammation, coupling self-renewal with effector cell differentiation. Transcriptomic and spatial deconstruction of chronic pulmonary TH2 responses identified interleukin-7 receptor signaling and lung tissue B cell infiltration in the context of tertiary lymphoid structure formation as key factors contributing to the maintenance of TH2 progenitors. Our data define the TH2 progenitor as a distinct cellular state arising during pathogenic chronic type 2 inflammation with a central role in sustaining TH2 responses over time.
Subjects
- Chronic inflammation
- Immunological memory
T helper 2 (TH2) cells and type 2 innate lymphoid (ILC2) cells orchestrate type 2 inflammation in barrier tissues in allergic disease and helminth infection1. These responses are often chronic and involve continuous exposure to an antigen, as seen with persistent gastrointestinal parasitic infection and environmental aeroallergens, such as dust and mold. Parts of the TH2 lineage have been defined, including effector TH2 cells in acute sensitization2,3,4,5,6,7 and resident memory T (TRM) cells in recall responses to episodic exposures8,9,10,11,12,13,14,15. However, the cellular and mechanistic basis of chronic type 2 inflammation is poorly understood.
Chronic antigen exposure canonically drives T cell exhaustion, including during chronic infection and cancer16. Despite the diversity of the TH2 populations identified17, it remains unclear how TH2 cells sustain type 2 inflammation without becoming exhausted. In human allergic diseases with a chronic antigen burden, we defined tissue progenitor TH2 cells with self-renewal capacity that mirrors cellular states seen in chronic infection and cancers, and which may be important for long-term disease pathogenesis18. These cells are defined by coexpression of the Wnt family transcription factors TCF1 and LEF1, which are crucial for lymphocyte memory19. It is increasingly appreciated that other instances of human pathology, including autoimmune disease20,21,22,23,24,25, may share a common cellular architecture wherein stem and progenitor T cell populations sustain chronic responses.
The environmental cues that modulate tissue progenitor T cells remain poorly understood. Moreover, the relative mechanistic roles of memory, progenitor and effector cells in yielding a particular tissue phenotype or clinical outcome, particularly when defined in human studies, have been elusive. To interrogate the differentiation, maintenance and functional role of tissue progenitor TH2 cells, we studied chronic allergic inflammation using a mouse model of pulmonary type 2 inflammation with poly-allergen sensitization that recapitulates key elements of human asthma.
Results
A model of chronic pulmonary type 2 inflammation
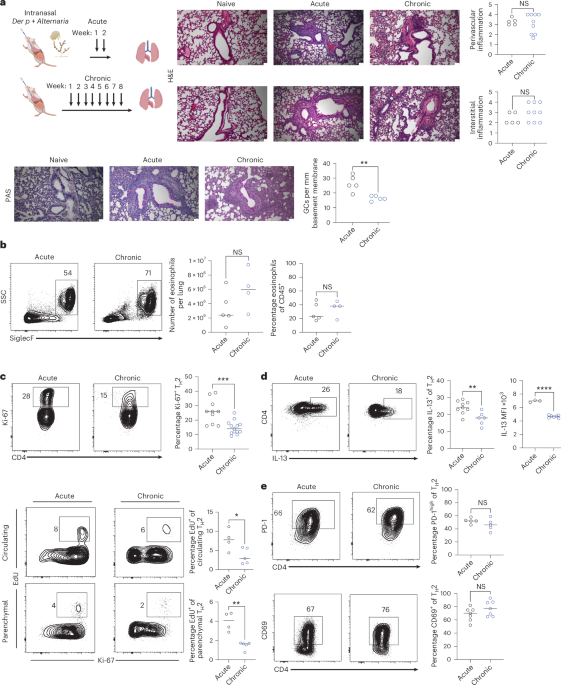
Human allergic respiratory disease is often characterized by chronic inflammation and concomitant exposure to multiple allergens. To model this pathophysiology, we administered Alternaria alternata (‘Alternaria’) and house dust mite (Dermatophagoidespteronyssinus(‘Der p’) extracts weekly for two (acute phase) or eight (chronic phase) weeks. At both time points, we found robust type 2 inflammatory responses, including interstitial and perivascular inflammation, goblet cell (GC) metaplasia and tissue eosinophil infiltration (Fig. 1a,b). Type 2 inflammation was broadly sustained despite chronicity, with similar levels of cellular infiltration and modestly decreased GC metaplasia. Allergen challenge induced infiltration of intraparenchymal GATA3+ TH2 cells and GATA3+ regulatory T (Treg) cells (Extended Data Fig. 1a)26. The ILC2 compartment was comparable between acute and chronic challenge (Extended Data 1b). We quantified proliferation (Ki-67 expression and 5-ethynyl-2′-deoxyuridine (EdU) incorporation) and effector cytokine (interleukin-13 (IL-13)) production, finding both to be marginally reduced at the chronic time point but persistent (Fig. 1c,d). KLRG1, a marker of tissue GATA3+ Treg cells27,28, was expressed on a subset of TH2 and Treg cells; few tissue TH2 cells expressed CD62L (Extended Data Fig. 1c,d). There were no temporal differences in expression of the inhibitory receptor and activation marker programmed cell death protein 1 (PD-1) or the resident memory/activation marker CD69 (Fig. 1e). TIM3 was expressed by a fraction of TH2 cells, while TIGIT29, CTLA4 and FR4 were increased in the chronic state (Extended Data Fig. 1e,f). The follicular helper T (TFH) markers BCL6 and CXCR5 were minimally expressed in tissue TH2 but were observed in the mediastinal lymph node (mLN) (Extended Data Fig. 1g). Together, these results indicate that type 2 pulmonary inflammation, including tissue remodeling, is broadly sustained over months of challenge, with TH2 cells exhibiting features of chronic activation.
a, Top Left: Schematic of acute and chronic model of polysensitization and challenge with Alternaria and Der p. Middle: Representative hematoxylin and eosin (H&E) images of lungs from naive, acute (2 weeks) and chronic (8 weeks) time points of mice sensitized and challenged with Alternaria/Der p. Top Right: Quantification of perivascular inflammation and interstitial inflammation through H&E staining at the indicated time points. NS, not significant, One-way analysis of variance (ANOVA) with Holm–Šidák correction for multiple comparisons. Bottom left: Representative periodic acid–Schiff (PAS)-stained images from naive, acute sensitization and chronic allergen challenge. Bottom right: Quantification of numbers of GCs per millimeter of basement membrane at the indicated time points. **P < 0.01. ****P < 0.0001. One-way ANOVA with Holm–Šidák correction for multiple comparisons. n = 5 acute, n = 9 chronic. b, Representative flow cytometry gating of tissue (CD45 intravascular (IV) label negative) eosinophils (CD45+CD11c−Ly6G−TCRβ−CD19−SiglecF+). Middle: Number of eosinophils per lung. Right: Percentage eosinophils of CD45+ cells per lung, at acute and chronic time points. Two-tailed t-test. n = 5 acute, n = 4 chronic. c, Top: Ki-67 expression by TH2 cells at the indicated time points and quantification. Bottom: EdU incorporation by circulating (top) and tissue (bottom) TH2 cells at the indicated time points. *P < 0.05, **P < 0.01, ***P < 0.001. Two-tailed t-test. n = 10 acute, n = 12 chronic. d, IL-13 expression at the acute and chronic time points by TH2 cells and quantification of marker-positive cells as well as IL-13 MFI. **P < 0.01. ****P < 0.0001. Two-tailed t-test. n = 9 acute, n = 6 chronic. e, PD-1 and CD69 expression at the acute and chronic time points for TH2 cells and quantification of marker-positive cells. **P < 0.01, ***P < 0.001. Two-tailed t-test. n = 5 acute, n = 5 chronic. For all plots, TH2 cells are gated as CD4+CD44+CD45(IV)−Foxp3−GATA3+. n indicates biological replicates; the line denotes the median; all statistical tests are two-tailed. Panel a created in BioRender; Kratchmarov, R. https://biorender.com/sj5keaa (2026).
In the context of chronic viral infections and tumors, a stem or progenitor-like subset of the responding T cell compartment30 expressing the transcription factor TCF1 (refs. 31,32,33) can sustain adaptive immunity. Therefore, we assessed TCF1 expression patterns in TH2 cells, finding that TCF1 and ST2 (IL-33 receptor) were reciprocally expressed and marked two broad cellular states: TCF1+ST2− and TCF1−ST2+, and a mixed/intermediate TCF1+ST2+ compartment (Fig. 2a). TCF1+ST2− were expanded at the chronic time point; while some TCF1+ST2− cells could be found at the acute time point, the mean fluorescence intensity (MFI) of TCF1 was significantly lower. Tcf7Gfp mice34 demonstrated corresponding Tcf7Gfp+ST2−, Tcf7Gfp−ST2− and Tcf7Gfp−ST2+ subsets (Fig. 2a). As shown by direct transcription factor staining after sorting, the Tcf7Gfp+ST2− compartment included a substantial proportion of GATA3+Foxp3− TH2 cells at the chronic but not acute time point (Fig. 2b). These findings reveal the accumulation of TCF1+ TH2 cells over time, suggesting an exaggerated parallel to the emergence of TCF1+ stem-like progenitors in chronic infection and cancer16,35 and mirroring the expanded TH2 progenitor population observed in human allergic disease18.
a, Left: Expression of TCF1 and ST2 by TH2 cells. Middle: Quantification of the percentage of TCF1+ST2− cells. Right: Quantification of the percentage of TCF1−ST2+ cells. Far Right: Quantification of TCF1 MFI among TCF1+ST2− cells. *P < 0.05, **P < 0.01, ****P < 0.0001. Two-tailed t-test. n = 5 acute, n = 5 chronic. The line denotes the median. b, Upper left: Experimental approach for defining TH2 subsets through sensitization and allergen challenge of Tcf7Gfp reporter mice and fluorescence-activated cell sorting (FACS). Upper right: Representative gating of Tcf7Gfp and ST2 at the indicated time points for CD44+TCRβ+CD4+ T cells. Bottom: Expression of GATA3 and Foxp3 by the indicated subsets as indexed by transcription factor staining after sorting. ****P < 0.0001. One-way ANOVA with Holm–Šidák correction for multiple comparisons. n = 8 acute, n = 5 chronic. For all plots, n indicates biological replicates; all statistical tests are two-tailed. Panel b created in BioRender; Kratchmarov, R. https://biorender.com/xf57ypg (2026).
TH2 progenitors self-renew, populate the effector compartment and sustain pulmonary disease
We used an adoptive transfer approach to test the progenitor capacity of TCF1+ TH2 cells. Using LY108 as a surrogate marker (Extended Data Fig. 2a,b), candidate progenitor (LY108+ST2−), intermediate (LY108+ST2+) and effector (LY108−ST2+) TH2 populations were sorted and transferred into naive congenic hosts (Fig. 3a)36,37. After adoptive transfer, mice were sensitized for 2 weeks with Der p/Alternaria; the fate of the engrafted cells was analyzed. All three transferred populations were recovered after transfer, with significantly higher numbers of progenitor-derived cells present in the lungs and mLN compared with transferred effector cells (Fig. 3b). We also observed increased proliferation in the transferred progenitor TH2 cells (Extended Data Fig. 2c). The fate of each transferred population differed, with progenitor TH2 cells yielding progenitor, intermediate and effector phenotype cells, while transferred effector cells only produced further effector TH2 cells. Transferred intermediate cells differentiated into intermediate and effector populations (Fig. 3b). To unequivocally establish the differentiation potential of TH2 subsets, we used Tcf7Gfp mice. We sorted candidate Tcf7Gfp+ ST2− and Tcf7Gfp- ST2+ populations and adoptively transferred into naive congenic recipients (Extended Data Fig. 2d). Tcf7Gfp+ ST2− donor cells yielded significantly more progeny after transfer and recapitulated the predicted population hierarchy, differentiating into TCF1+ST2+ and TCF1−ST2+ cells, while self-renewing the TCF1+ST2− compartment (Extended Data Fig. 2e,f). To test the role of TCF1 expression, we generated conditional deleter mice by crossing CD4-CreERT2 and Tcf7GfploxP/loxP strains. This approach allowed us to avoid confounding factors associated with germline or constitutive CD4-Cre deletion where naive T cell differentiation38 and acute TH2 differentiation39 are compromised. Despite incomplete deletion efficiency in the inflamed lung (Extended Data Fig. 2g), partial inducible deletion of Tcf7 at the chronic time point resulted in decreased TH2 cell numbers and decreased bronchus-associated lymphoid tissue (BALT) area and tissue inflammation, indicating that expression of TCF1 contributes to progenitor cell maintenance (Fig. 3c). These data confirm that the GATA3+TCF1+ST2− TH2 population has progenitor potential, coupling self-renewal with effector generation, and support a model in which differentiation from progenitor to effector is unidirectional30,40,41.
a, Schematic of adoptive transfer model to track cell fate. b, Upper left: Representative flow cytometry gating of transferred donor CD45.1+ progenitor, intermediate or effector cells, distinguished from CD45.2+ host cells. Upper right: Quantification of total cell numbers recovered from each donor population in the lung and mLN. Lower left: Representative flow cytometry gating of TCF1 and ST2 expression by GATA3+Foxp3−CD45.1+ donor cells. Bottom right: Quantification of numbers of recovered cells of each phenotype after transfer of donor cells of each phenotype. *P < 0.05, **P < 0.01, ***P < 0.001. All others, NS. One-way ANOVA with Holm–Šidák’s correction for multiple comparisons. n = 10 for all transferred populations. c, Left: Schematic of conditional Tcf7 ablation model. Right: Quantification of the number of lung tissue eosinophils and tissue TH2 cells, as well as inflammation score and BALT area in tamoxifen-treated mice of each genotype. The results shown include three independent experiments, each with littermate-matched controls. *P < 0.05. Two-tailed t-test. n = 10 Tcf7loxP/loxP, n = 4 CD4−CreERT2Tcf7loxP/loxP. d, Schematic of adoptive transfer model of disease causality with TCRβ knockout recipient mice. e, Upper left: Representative H&E staining of lungs after adoptive transfer of the indicated populations. Upper right: Quantification of inflammation score. ***P < 0.001. One-way ANOVA with Holm–Šidák’s correction for multiple comparisons. n = 5 control, n = 7 progenitor and n = 4 effector transfer recipients. Bottom left: Representative flow cytometry plots of tissue eosinophils after adoptive transfer of indicated TH2 populations into TCRβ knockout recipient mice. Middle: Quantification of total number of eosinophils per lung. Right: Quantification of eosinophils as a percentage of CD45+ cells in the lung. *P < 0.05, **P < 0.01. n = 7 control, n = 6 progenitor and n = 3 effector transfer recipients. For all plots, TH2 cells are gated as CD4+CD44+CD45(IV)−Foxp3−GATA3+; n indicates biological replicates and the line denotes the median; all statistical tests are two-tailed. Panels created in BioRender: a, Kratchmarov, R. https://biorender.com/v9gj38h (2026); c, Kratchmarov, R. https://biorender.com/3j2xx3o (2026); d, Kratchmarov, R. https://biorender.com/v9gj38h (2026).
To assess the functional contribution of TH2 subsets to disease, we asked which cells were sufficient to initiate and sustain lung inflammation. We sorted progenitor or effector TH2 populations from the lung at the chronic time point and transferred these cells to T cell receptor beta (TCRβ)-deficient recipient mice before sensitization (Fig. 3d). Mice that received progenitor cells showed robust type 2 inflammation, including GC hyperplasia, interstitial alveolar infiltrates and prominent eosinophilic infiltration, all significantly higher than that induced by TH2 effector cells (Fig. 3e). Only transferred progenitor cells induced ILC2 cell proliferation, a readout of cross-cellular activation42 (Extended Data Fig. 2h). We also assessed TH2 differentiation and tissue eosinophilia at an early time point (day 5) and found increased numbers of TH2 cells after TH2 progenitor transfer. Eosinophilic infiltration was not significantly different, suggesting that transferred TH2 effectors were functional early (Extended Data Fig. 2i). These data demonstrate that TCF1-expressing TH2 progenitors are both required and sufficient to confer robust type 2 inflammation, while TH2 effectors induce only limited tissue eosinophilia.
Context-specific TH2 progenitor differentiation
We considered whether differentiation of tissue progenitor TH2 cells was a broadly conserved feature of type 2 inflammation by tracking this cell population across multiple different disease models. We first profiled TH2 responses in a short-term model of Alternaria monosensitization. TCF1 is required for initial TH2 differentiation through repression of interferon-γ and induction of GATA3 (ref. 39); we reasoned that TCF1+ cells might infiltrate the lung early after sensitization. However, tissue TH2 cells uniformly downregulated TCF1 expression compared with bystander GATA3− cells and Treg cells (Extended Data Fig. 3a). Analysis of single-cell RNA sequencing (scRNA-seq) data from mouse nose early after sensitization with Alternaria43 showed a similar phenotype as TH2 cells lacked the Tcf7 transcript (Extended Data Fig. 3b,c and Supplementary Table 1).
We next considered a model of chronic intestinal type 2 inflammation. The helminth Heligmosomoides bakeri establishes a chronic infection in the gut, inducing TH2 responses in the lamina propria and draining mesenteric lymph nodes (mesLNs). Mice were infected with H. bakeri and the TH2 response was assessed at acute (day 18) and chronic (day 42) time points in the gut mucosa and mesLNs. In this model, inflammation and productive infection persists for months, as indexed by fecal egg shedding (Fig. 4a). TH2 cells were uniformly CD62L− and expressed the alarmin receptor interleukin-17 receptor B (IL-17RB) (interleukin-25 receptor)44, with extensive cell proliferation at the acute and chronic time points (Extended Data Fig. 3d,e). We assessed TCF1 expression and identified three distinct subsets when stratified according to KLRG1 coexpression (TCF1+KLRG1−, TCF1−KLRG1− and TCF1−KLRG1+). Most TH2 in the lamina propria were TCF1− in contrast to the mesLNs (Fig. 4b). The frequencies of the TH2 subsets were unchanged between the acute and chronic time points in the mucosa, while TCF1+KLRG1− cells were significantly increased at the chronic time point in the mesLNs. We observed similar levels of IL-17RB expression across the three subsets. Proliferation was significantly decreased in both the mucosa and mesLNs at the chronic time point (Extended Data Fig. 3e). These results indicate that chronic helminth infection does not lead to accumulation of a TH2 progenitor population in tissue and suggest that long-term responses to these infections may require contributions from secondary lymphoid tissue45,46. We also analyzed scRNA-seq data from another mouse model of type 2 intestinal disease, eosinophilic esophagitis, which is thought to be driven by TH2 cells47,48,49,50. An expanded TH2 cluster was observed but showed minimal Tcf7 expression (Extended Data Fig. 3f).
a, Schematic of acute and chronic models of helminth infection in the gastrointestinal tract. Bottom left: Quantification of H. bakeri eggs per gram of feces. Right: Quantification of TH2 cells as a percentage of CD4+CD44+Foxp3− cells in the lamina propria. Two-tailed t-test. n = 6 acute, n = 5 chronic. b, Left: Expression of TCF1 and KLRG1 by CD4+CD44+GATA3+Foxp3− TH2 cells in the lamina propria (top) and mesLN (bottom). Right: Quantification of frequencies of TCF1+KLRG1−, TCF1− KLRG1− and TCF1−KLRG1+ cells. **P < 0.01. One-way ANOVA with Holm–Šidák’s correction from multiple comparisons. n = 4 acute, n = 4 chronic. c, Representative gating and frequencies of TCF1+ST2− TH2 cells in the lung and nose during chronic allergen challenge. ***P < 0.001. Paired sample t-test. n = 6. d, Representative gating and frequencies of TCF1+ST2− TH2 cells after treatment with no drug or FTY720. Middle: Number of TCF1+ST2− TH2 cells per lung. Right: Tissue inflammation score. Two-tailed t-test. Left: n = 8. Right: n = 5. e, Left: Schematic of antigen-specific chronic pulmonary type 2 inflammation model. Middle: Representative 2W1S tetramer staining in the lung for TH2 cells after allergen challenge with Derp/Alternaria/2W1S. Right: Total number of 2W1S tetramer-positive cells in the lung, after antigen withdrawal or during chronic stimulation. Far right: Percentage Ki-67+ TH2 cells after antigen withdrawal or during chronic allergen challenge. *P < 0.05, **P < 0.01. Two-tailed t-test. n = 3 chronic, n = 5 antigen withdrawal. f, Left: Expression of TCF1 and ST2 by 2W1S tetramer-positive TH2 cells. Middle: Percentage of indicated subsets among tetramer-positive TH2 cells. ***P < 0.001, ****P < 0.0001. One-way ANOVA with Holm–Šidák’s correction from multiple comparisons. Right: Number of cells per lung of each TH2 subset. ****P < 0.0001. One-way ANOVA with Holm–Šidák’s correction from multiple comparisons. n = 3 chronic, n = 5 antigen withdrawal. For all plots, TH2 cells are gated as CD4+CD44+CD45(IV)−Foxp3−GATA3+ unless otherwise specified. n indicates biological replicates and the line denotes the median; all statistical tests are two-tailed. Panels created in BioRender: a, Kratchmarov, R. https://biorender.com/rcmgn9e (2026); c, Kratchmarov, R. https://biorender.com/rqtsqya (2026).
We also considered whether the tissue microenvironment might influence TH2 progenitor differentiation by characterizing the TH2 compartment in the nose, the site of antigen introduction in our model. Interestingly, nasal TH2 cells lacked a substantial TCF1+ST2− progenitor population, and GATA3+ Treg infiltration was also lower (Fig. 4c and Extended Data Fig. 3g). Taken together, our observations across multiple tissues and models of type 2 inflammation suggest that tissue TH2 progenitor accumulation is not a broad feature of type 2 responses but rather is context-specific.
Mechanisms of TH2 compartment maintenance
We assessed whether TH2 progenitor maintenance required ongoing replenishment from an LN reservoir by treating mice with FTY720 to block LN egress. There were no significant differences in the frequency or cell number of tissue TCF1+ST2− TH2 progenitors, percentage of Ki-67+TH2 cells or TCF1 MFI, despite efficient depletion of T cells from the circulation (Fig. 4d and Extended Data Fig. 3h,i). Tissue inflammation was also unchanged after FTY720 treatment (Fig. 4d). These results demonstrate that TH2 tissue progenitor cells can be uncoupled from circulating and LN-resident cells for several weeks while maintaining productive inflammation.
Local signals from antigen-presenting cell populations can provide instructive cues to tissue-resident T cell populations, and TCR signaling can regulate progenitor CD8+ T cell maintenance51. Therefore, we investigated the role of antigen-driven TCR signals in tissue TH2 progenitor maintenance by using a model that allowed for tracking of antigen-specific T cell populations. We sensitized mice with the peptide 2W1S26,42, administered intranasally with Der p/Alternaria weekly, and tracked antigen-specific TH2 cells with fluorescently labeled tetramers (Fig. 4e). 2W1S+ T cells recapitulated the progenitor/intermediate/effector distribution seen for polyclonal Der p/Alternaria-induced TH2 cells (Fig. 4f). To determine whether TCR signaling regulated the distribution of TH2 subsets, we sensitized mice with 2W1S/Der p/Alternaria for 6 weeks and then withdrew 2W1S while continuing Der p/Alternaria challenge for an additional 4 weeks. After antigen withdrawal, the frequency of TCF1+ST2− cells trended higher although it did not meet statistical significance, while the total number of these cells remained constant, suggesting that survival/maintenance of TH2 progenitors does not require ongoing TCR stimulation via presented antigen. Reciprocally, both the frequency and number of TCF1−ST2+ effector cells decreased after antigen withdrawal (Fig. 4f). These results indicate that tissue progenitor cells are maintained at steady state levels in an inflamed environment in the absence of antigen for at least one month.
The TCF1+ST2− TH2 compartment arises in the face of chronic antigen stimulation and is associated with ongoing proliferation, cytokine production and tissue pathology, suggesting that the state of these cells is distinct from that of resting resident memory cells. To assess phenotypic differences between chronic type 2 inflammation and resting memory, we treated mice with Der p/Alternaria for 8 weeks and then either continued allergen challenge for an additional 8 weeks (‘chronic’), withdrew all allergens for 8 weeks (‘rest’) or withdrew stimulation for 7 weeks and then restimulated with one dose of Der p/Alternaria (‘recall’) (Extended Data Fig. 4a). Tissue inflammation and tissue remodeling decreased after 2 months of rest, while type 2 inflammation was sustained over 4 months of chronic challenge. Recall responses were brisk, as a single dose of Der p/Alternaria was sufficient to reinduce inflammation at levels comparable to chronic stimulation. Tissue eosinophilia resolved during the resting phase, while recall and chronic conditions were characterized by similar levels of eosinophilia (Extended Data Fig. 4b). We then compared the TH2 compartment across these conditions. Frequencies of TCF1+ST2− cells were similar between resting, recall and chronically stimulated TH2 cells (Extended Data Fig. 4c). PD-1 expression identified three populations, PD-1hi, PD-1int and PD-1lo, on both circulating and tissue cells (Extended Data Fig. 4d). Most TH2 cells were PD-1int or PD-1lo in the resting memory condition, while chronically stimulated and recall TH2 cells had high levels of PD-1 expression, suggesting dynamic adaptation to activation. CD69 expression, which marks resident memory T cells but is also a marker of recent TCR stimulation, was similar between conditions (Extended Data Fig. 4e). These surface marker expression patterns suggest that the TCF1+ST2− compartment has overlapping features of chronic activation, residency and memory. Taken together, these findings demonstrate that specialized TH2 responses are associated with chronicity.
scRNA-seq defines the transcriptional signature of TH2 progenitors
To obtain an unbiased profile of TH2 diversity across time, we performed scRNA-seq and paired single-cell TCR sequencing (scTCR-seq) of lung CD4+ T cells (Fig. 5a, Extended Data Fig. 5a and Supplementary Table 2). We identified diverse clusters of TH2 effector cells (acute effector 1/2, and chronic effector 1/2) (Fig. 5b,c). The acute effector 2 cluster was predominantly characterized by an interferon-response signature, similar to cells previously identified during acute sensitization with Der p or dog dander4,52, while acute effector 1 expressed high levels of Il5, Il13 and Pparg3. Il4 expression was relatively increased in chronic effectors (Fig. 5c). Expression of Il17rb, encoding the interleukin-25 receptor, and Nmur1, encoding a neuropeptide receptor implicated in ILC2 and memory TH2 responses15,53,54,55 were prominent in chronic effector clusters.
a, Uniform manifold approximation and projection (UMAP) of all lung tissue (CD45(IV)−) lung CD4+CD44+ T cells from acute and chronic time points of the Alternaria/Der p allergen challenge. Right: UMAP split according to acute and chronic time points. b, Quantification of frequencies of each cluster at the acute and chronic time points for each mouse. The box plot covers the full range of values; the line denotes the mean. c, FeaturePlots of key lineage-defining transcripts and effector cytokines, split according to acute and chronic time points. d, Left: FeaturePlot of the interferon module. Top right: Split violin plots of the interferon module for progenitor, intermediate and proliferating clusters. Bottom right: Quantification of the interferon module for the indicated clusters at the acute and chronic time points. a.u., arbitrary unit; ***P < 0.001, ****P < 0.0001. One-way ANOVA with Holm–Šidák’s correction for multiple comparisons. n = 3. e, Left: UMAP of integrated CD4+ T cells from LCMV clone 13 and chronic allergy (week 8 chronic time point from Fig. 5a). Right: UMAP split according to disease state. f, Left: Split violin plots of stemness module for the indicated clusters. Quantification of stemness module for the indicated clusters. ****P < 0.0001. One-way ANOVA with Holm–Šidák’s correction for multiple comparisons. n = 3 allergy, n = 6 clone 13. g, Left: UMAP of integrated CD4+ T cells from resting memory/recall allergy Aspergillus Fumigatus model and chronic allergy (week 8 chronic time point cells from a. Right: UMAP split according to disease state. h, Left: Split violin plots of stemness module for the indicated clusters. Quantification of stemness module for the indicated clusters. ****P < 0.0001. One-way ANOVA with Holm–Šidák’s correction for multiple comparisons. n = 3 allergy, n = 3 recall.
There were two distinct clusters of Treg cells, one of which was highly enriched at the chronic time point (Fig. 5b). While Il10 and Areg (encoding amphiregulin) expression was similar between acute and chronic Treg cells, the chronic Treg subset expressed Tff1, encoding the trefoil family factor 1 protein, which has been implicated in barrier tissue maintenance56 and is expressed by Treg cells in pulmonary fibrosis57. These features suggest that chronic Treg responses during type 2 inflammation may be associated with tissue remodeling. There was also broad Areg expression by effector TH2 clusters, which is consistent with prior work suggesting a pathogenic role for amphiregulin in TH2-driven fibrosis58.
Tcf7, S1pr1, Slamf6 and Klf2 expression marked two clusters of less differentiated cells, denoted ‘progenitor’ and ‘intermediate’ (Extended Data Fig. 5a). A small fraction of cells in the progenitor cluster expressed Bcl6, a transcription factor critical for TFH and memory/progenitor responses59 (Extended Data Fig. 5b). There was minimal Cxcr5 expression, although Il21 expression increased with chronicity, suggesting that a chronic allergen challenge may be associated with differentiation of peripheral T helper-like cells60. Cells in the intermediate cluster expressed high levels of TOX, a transcription factor implicated in exhausted CD8+ T cell responses61,62,63 and moderate levels of Il1rl1 (Extended Data Fig. 5a).
We performed pseudobulk analysis to identify differentially expressed transcripts between clusters. Chronic effector 1 cells expressed heightened levels of Il4 and the AP1 family transcription factors JUN and FOS, and the Ikaros-family transcripts Ikzf1 and Ikzf3. Acute effector 1 cells expressed higher levels of IL5 and IL13, as well as the activation marker Tnfrsf4, encoding OX40, and the inhibitory receptor Tigit. Acute effector 1 cells also expressed higher levels of Dgat1, encoding the enzyme diacylglycerol O-acyltransferase 1, implicated in lipid droplet synthesis and ILC2 function64. Chronic effector 2 cells were marked by Prdm1 and Ikzf3 expression and had evidence of a differential cytokine production profile including Il10 (Extended Data Fig. 5c and Supplementary Tables 3 and 4).
To define transcriptomic differences associated with self-renewal, we focused on the progenitor, intermediate and proliferating 3 (the dominant proliferating) clusters. Progenitor and intermediate cluster cells during the acute phase expressed higher levels of many transcripts encoding interferon-response elements, including Ifi27I2a, Bst2 and Irf7 (Extended Data Fig. 6a,b and Supplementary Tables 5–7). Progenitors also showed higher expression of the CGRP receptor subunit Ramp3 (ref. 65). Intermediate cells expressed higher levels of Il21 after chronic allergen challenge, of note given the role of interleukin-21 in amplifying TH2 responses2. Izumo1r, encoding a folate receptor-like protein66 with a role in Treg67 and TFH cells68, was more highly expressed by progenitor cells at the chronic phase. Proliferating cluster cells at the chronic time point expressed higher levels of Tcf7 and Ltb, in contrast to higher levels of interferon-response transcripts at the acute phase (Extended Data Fig. 6c). We constructed an interferon-response module based on prior studies of T cells in human inflammatory disease42 and scored cells for the progenitor, intermediate and proliferating 3 clusters. Expression of the interferon-response module was significantly higher in all three clusters during the acute phase (Fig. 5d).
scTCR-seq highlights TH2 clonal lineages
Functional analyses suggested that progenitor cells could serve as a cellular reservoir for effector populations. To further define developmental relationships, we used scTCR-seq. TCR sequences were used as genetic barcodes to track cells across clonal expansion18. Large and hyperexpanded clones were detected and found across clusters (Extended Data Fig. 7a), with acute and chronic effectors showing low clonal diversity (Extended Data Fig. 7b). We assessed clonal overlap between clusters in the TH2 lineage, omitting innate and invariant cells and T helper 17(TH17) cells (Extended Data Fig. 8c). There was clonal overlap between the progenitor cluster and each of the effector and intermediate clusters, while overlap between TH2 effectors, cytotoxic cells and Treg cells was limited, as was overlap between progenitors and Treg cells. We calculated a clonal expansion index between clones common to the progenitor cluster and each other cluster to infer clonal expansion directionality (Methods)18. Using the progenitor cluster as the candidate starting node, we observed significant positive clonal expansion indices into the four effector clusters and the intermediate cluster. Clonal expansion was neutral for overlapping progenitor/Treg clones and progenitor/cytotoxic clones (Extended Data Fig. 7d,e).
Integrated transcriptomic analysis differentiates TH2 progenitors
Progenitor TH2 cells share features with progenitor CD4+ TH1 cells defined in chronic infection69,70,71. However, TH1 cells become exhausted, which contrasts the ongoing stable type 2 inflammation observed in our model. Therefore, we used a multi-model, comparative bioinformatic approach to identify transcriptomic differences between TH2 progenitors and TH1 progenitors in lymphocytic choriomeningitis virus (LCMV) clone 13 infection, a model with ongoing viremia and features of T cell dysfunction. We observed a predictable divergence in effector cells, with five LCMV-specific effector clusters (LCMV 1–5) and one ‘allergy effector’ cluster (Fig. 5e and Supplementary Table 8). Notably, progenitor, progenitor/TFH and TFH clusters demonstrated overlap between models, allowing for direct comparison (Extended Data Fig. 8a). To define transcriptomic differences between the exhausted (clone 13) and chronic allergy (Alternaria/Der p) cell states (Supplementary Tables 9 and 10), we assigned a broad ‘checkpoint’ module score to all cells, integrating surface receptor and transcription factor transcripts (Methods)72. The checkpoint module was highly expressed on LCMV effector cells, and on Treg cells, and lowest on progenitors and TFH cells (Extended Data Fig. 8b). We performed pseudobulk analysis to capture differentially expressed transcripts. Progenitors from the allergic state expressed higher levels of the glucocorticoid receptor Nr3c1, which has been implicated in tissue adaptation and CD8 memory cell fate specification73, as well as the NF-κB subunit Nfkb1. In the allergic setting, the progenitor cluster expressed higher levels of ZEB1, a transcription factor required for efficient memory cell differentiation74, as well as STAT5B and BACH2, key regulators of stem-like CD8+ T cells75,76. Conversely, progenitor and progenitor/TFH cells in chronic infection expressed interferon-response genes and the proteasome subunits Psmb8/Psmb9 (Extended Data Fig. 8c and Supplementary Tables 9 and 10). Gene set enrichment analysis identified key divergent pathways from the Hallmark collection77, including IL-2/STAT5 signaling, heme metabolism, ultraviolet response and androgen response, while cells from chronic infection redemonstrated elevated interferon responses and myc and PI3K/mTOR signaling, which are indicative of an anabolic inflammatory state (Extended Data Fig. 8d). These results suggest the presence of divergent underlying metabolic programs, of note given the bioenergetic insufficiency seen in chronic infection78 and role of catabolism in self-renewal79.
We reasoned that because gene regulatory networks (‘regulomes’) defined by intertwined transcription factor modules often govern complex cell states, combinatorial transcription factor sets might best capture divergent cell fates. Single-cell CRISPR screens have unveiled the roles of such regulomes in controlling CD8+ T cell stemness in cancer80; therefore, we constructed a ‘core memory’ module and a ‘stemness’ module based on tumor-infiltrating CD8+ T cells81 (Methods). Expression of the core memory module was equivalent between the chronic infection and allergic states, suggestive of a common longevity mechanism (Extended Data Fig. 8e). However, expression of the stemness module was enriched in progenitor and progenitor/TFH-like cells in the allergic state (Fig. 5f). Conversely, expression of the interferon-response module was elevated in the setting of chronic infection (Extended Data Fig. 8e)82,83, further suggesting a role for interferon signaling in suppressing stemness and promoting exhaustion33,69. Taken together, these results highlight a stemness module that can be uncoupled from a shared longevity module.
We also sought to determine transcriptomic differences between TH2 cells during chronic antigen exposure and in the resting memory and recall states11 (Fig. 5g and Supplementary Table 11). We identified four conserved effector clusters (effectors 1–4) (Extended Data Fig. 9a) and two Treg clusters, one of which (Treg 2) was enriched in the memory and recall state. Expression of Tcf7 and Slamf6 delineated two memory and progenitor-like clusters (memory/progenitor 1 and 2). We applied the ‘checkpoint’ module (Extended Data Fig. 9b) to chronic and memory and recall type 2 inflammation (Extended Data Fig. 9b). Expression was broadly higher in the chronic allergen state, with the highest levels observed in the effector clusters, indicating that a chronic allergen challenge imparts a distinct activation state. We then compared transcriptional differences between chronic and memory and recall cells. Progenitor cells again expressed higher levels of the glucocorticoid receptor Nr3c1 and the transcription factors AFF3, IKZF3 and TOX. Conversely, resting cells expressed higher levels of the antiapoptotic factors BCL2 and MCL1 (ref. 84) (Extended Data Fig. 9c and Supplementary Tables 12 and 13). When quantifying the core memory and stemness modules, we observed an increase in stemness during chronic allergen exposure (Fig. 5h and Extended Data Fig. 9d). A separate set of transcripts, denoted as the resting memory module, was enriched in the memory and recall state (Extended Data Fig. 9d). Thus, progenitor TH2 cells in the chronic allergen challenge are divergent from resting memory and defined by a stemness module.
TH2 progenitor differentiation is modulated by the lung microenvironment
We next sought to identify lung microenvironment factors that could modulate TH2 progenitor cell differentiation by characterizing the whole-lung parenchyma through scRNA-seq (Fig. 6a). Clusters of airway structural cells, including AT1, AT2, club cells, GCs and ciliated epithelial cells, were identified, as well as stromal cells, including a mesothelial cluster, myofibroblast-like cells, peribronchial and adventitial fibroblasts and several clusters of endothelial cells (arterial, capillary, venular and lymphatic). Distinct myeloid populations were identified, including conventional type 1 (cDC1) and type 2 (cDC2) dendritic cells, migratory DCs and TREM2+ macrophages, as well as granulocytes, including eosinophils and neutrophils (Fig. 6b). B cell, plasma cell and eosinophil frequencies were increased in chronic inflammation, while myeloid clusters were decreased (Fig. 6c). To define the transcriptomic states associated with acute or chronic type 2 inflammation, we performed covarying neighborhood analysis85. Neighborhoods associated with chronicity were predominantly found in B cell, plasma cell, eosinophil and fibroblast clusters (Fig. 6d). We then performed pseudobulk analysis to define differentially expressed genes. Peribronchial fibroblasts upregulated expression of Cxcl12, the ligand for CXCR4, as well as factors involved in tissue remodeling (Adamtsl1, Mmp2, Col24a1) and the endothelial signaling factor Mdk (Fig. 6e). Peribronchial fibroblasts also upregulated the expression of Tnfsf13b, encoding B-cell-activating factor. This transcriptional profile was suggestive of a lymphoid tissue organizer cell-like phenotype, indicating a possible role in organizing tissue microdomains.
a, UMAP of all lung CD45+TCRβ− and CD45−TCRβ− cells from the acute and chronic time points of Alternaria/Der p allergen challenge. b, Dot plot of cluster-defining transcripts for UMAP in a. c, Frequencies of the indicated clusters from a at the acute and chronic time points. The line indicates the mean frequency and the box ranges cover all biological replicates. d, Covarying neighborhood analysis of whole-lung transcriptional space from panel a. Left: FeaturePlot of neighborhood coefficients; association with chronic time point is colored in red, association with acute time point is colored in blue. Right: Violin plot of neighborhood coefficients meeting a false discovery rate (FDR) < 0.1 threshold for each Louvain cluster, positive values indicating association with chronic state. e, Pseudobulk differential expression analysis of peribronchial fibroblasts comparing acute and chronic time points. The vertical dashed line denotes a fold change cutoff of 0.5. The horizontal dashed line denotes a significance cutoff of 0.01 according to FDR. f, UMAP of T cells from Fig. 5a integrated with candidate interacting partners from panel a. g, Significant cell–cell interactions between TH2 progenitor cells and each ‘sender’ cluster, identified using CellChat analysis.
We predicted cell–cell interactions by integrating our T cell (Fig. 5a) and whole-lung (Fig. 6a) scRNA-seq datasets through CellChat86 to identify receptor–ligand pairs (Fig. 6f and Extended Data Fig. 10a). Key statistically significant interactions included ICOS–ICOSL, CD80–CD86, PD-L1–PD-L2 and CXCL12–CXCR4, with multiple candidate ‘sender’ clusters identified, suggesting redundant cell–cell interactions (Fig. 6g). In settings of chronic inflammation, ectopic lymphoid structures, including BALT and tumor-associated tertiary lymphoid structures (TLS), can develop87. Indeed, we saw the emergence of lymphoid aggregates consistent with BALT formation during the chronic allergen challenge (Extended Data Fig. 10b). Therefore, we performed spatial transcriptomics to understand the tissue architecture. We defined tissue microdomains88, which highlighted broad reorganization of the lung parenchyma (Fig. 7a,b). While canonical airway domains could be identified in acute inflammation, chronicity was associated with obliteration of the airway tree and emergence of denser infiltrates of plasmablasts and myeloid inflammatory cells. Myeloid-dominant inflammatory domains exhibited evidence of alternative activation with elevated Gnmb1 and Spp1 expression. TLS dominated by B and T cells could be found throughout the lung, often in proximity with organized ‘fibroblast hubs’ that expressed Cxcl12, as well as transcripts suggestive of aberrant myofibroblast and pericyte-like cell states (Tagln, Acta2, Myh11) (Fig. 7b and Extended Data Fig. 10c). The identification of this fibroblast hub, in combination with (1) increased Cxcl12 expression by lymphoid tissue organizer cell-like fibroblasts (Fig. 6d), (2) putative CXCL12–CXCR4 interaction identified through receptor–ligand analysis and (3) heightened expression of Cxcr4 on progenitor TH2 cells (Extended Data Fig. 10d), suggest that this axis may be important for tissue homing. These results are consistent with a generalized model of CXCL12-producing fibroblasts organizing longevity niches89 and serving as a node for tissue retention in inflammatory contexts90.
a, UMAP of BANKSY-defined tissue domains from spatial transcriptomics of acute and chronic time points. b, Left: H&E staining of acute and chronic time point lung sections. Right: Zoomed overlay of indicated transcriptionally defined tissue microdomains on H&E section. c, Left: Frequencies of circulating and lung tissue B cells at the indicated time points. ***P < 0.001. ****P < 0.0001. One-way ANOVA with Holm–Šidák’s correction for multiple comparisons. n = 11. Right: Identification of germinal center B cells using flow cytometry. Plots are representative of at least five biological replicates. For the box and whisker plots, the line denotes the median, the box range denotes the 25th to 75th percentiles and the whiskers show the minimum and maximum values. d, Left: UMAP of subclustered B cells and plasma cells from Fig. 6a. Right: Dot plot of cluster-defining transcripts. e, Top: Schematic of model for the depletion of tissue B cells. Middle: Frequencies of circulating (CD45(IV)+CD19+) and tissue (CD45(IV)−CD19+) B cells at the chronic time point after treatment with isotype control or CD20-depleting antibody. Plots are representative of four biological replicates. Right: Quantification of BALT surface area and TH2 progenitor cell number in control IgG or anti-CD20-treated mice. *P < 0.05. ***P < 0.001. Two-tailed t-test. n = 10 per group. The line denotes the median; the error bars denote the s.e.m. For all plots, TH2 cells are gated as CD4+CD44+CD45(IV)−Foxp3−GATA3+ unless otherwise specified. n indicates biological replicates; all statistical tests are two-tailed. b, Scale bars: 800 μM and 400 μM (zoomed overlay).
T–B cell interactions in chronic type 2 inflammation
Given the identification of B cells as possible TH2 interacting partners and the expansion of a B cell niche defined by peribronchial fibroblasts, we interrogated the tissue B cell compartment. B cell frequencies increased with chronicity and included BCL6+ germinal center cells (Fig. 7c). We informatically subclustered B and plasma cells, identifying eight distinct clusters. Mature GC B cells expressed Aicda and Fas, while mixed naive/resting B cells expressed Pax5 and Cxcr4. Pre-GC B cells exhibited an antigen-presenting phenotype (Ciita, Btla and Icosl expression). Early activated B cells expressed Myc, while memory B cells expressed Cd9, Fcrl5 and Cd274, encoding PD-L1. Interestingly, there was also a prominent Il5r-expressing memory cell population, of note given the infiltration of inflamed human nasal tissues by IL5R+ antibody-secreting cells91 (Fig. 7d).
As B cells can instruct differentiation and maintenance of tumor-reactive stem and progenitor CD8+ T cells92,93, are the dominant constituent of TLS and express ligands known to regulate T cell function, we asked whether B cells modulate TH2 progenitor cell maintenance. B cell depletion with anti-CD20 antibody led to marked reduction in the BALT area. Notably, we also observed a decrease in TH2 progenitor cell numbers (Fig. 7e). These findings suggest that TH2 tissue progenitor cells are partially maintained through B cell interactions in the context of BALT.
Comparative immunology of tissue and LN-resident TH2 progenitors
We reasoned that understanding TH2 cell states in the draining LN would further define the unique functional properties of tissue TH2 progenitors. We performed scRNA-seq of paired mLN CD4+ T cells (Fig. 8a). Cells from the mLN largely clustered separately from the lung and were enriched for two memory/progenitor clusters expressing high levels of Tcf7, Klf2 and Sell (Fig. 8b). We performed differential expression analysis comparing tissue progenitor TH2 to the two mLN-resident memory and progenitor clusters. Tissue progenitors expressed high levels of the receptors Il7r and Icos, associated with TRM differentiation94 as well as Rora and Bhlhe40 (ref. 95) (Fig. 8c). Progenitors also showed increased expression of the glucocorticoid receptor Nr3c1, of note given its heightened expression in human TH2 progenitors18 and ILC2s96 (Fig. 8c). Tissue TH2 progenitors also showed evidence of ongoing activation, with Nr4a1 and Nr4a3 expression.
a, Left: UMAP of integrated lung and mLN CD4+CD44+CD45(IV)− T cells from the acute and chronic time point of Alternaria/Der p allergen challenge. Right: UMAP split according to organ. b, Dot plot of cluster-defining transcripts. c, Pseudobulk differential expression analysis of tissue progenitor TH2 cells and LN progenitor/memory-1 (left) and memory-2 (right) clusters. The vertical dashed line denotes a fold change cutoff of 0.5. The horizontal dashed line denotes a significance cutoff of 0.01 by FDR. d, Violin plot of Il7 expression by lung cells from Fig. 6a. e, UMAP of reclustered fibroblast clusters from Fig. 6a. f, Dot plot of fibroblast cluster-defining transcripts. g, Violin plot showing expression of key SHH-related signaling transcripts in fibroblast clusters. h, Schematic of model for blockade of IL-7/IL-7R signaling during chronic Alternaria/Der p allergen challenge. i, Representative flow cytometry plots of TCF1 and ST2 expression by Th2 cells (gated as CD4+CD44+CD45(IV)−Foxp3−GATA3+) in mice treated with isotype or anti-IL-7R antibody. Right: Quantification of TH2 progenitor (TCF1+ST2−) cells. *P < 0.05. The line denotes the median. Two-tailed t-test. n = 8. j, Quantification of the indicated cell types in mice treated with control IgG or anti-IL-7R antibody. Results shown include two independent experiments. *P < 0.05. The line denotes the median. Two-tailed t-test. n = 8. Panel h created in BioRender; Kratchmarov, R. https:// biorender.com/49ynq7w (2026).
As IL-7-IL-7R signaling regulates naive T cell differentiation and circulating memory cell maintenance, we considered whether tissue TH2 progenitors might rely on this signaling pathway97. The Il7 transcript was detected in lymphatic endothelial cells (LECs), as well as in fibroblasts and other structural cells (Fig. 8d). While LECs express IL-7 in homeostasis98 and inflammation99, fibroblast IL-7 expression accompanies a dysregulated epithelial cell Sonic Hedgehog (SHH) signaling axis100. We subclustered fibroblasts and identified alveolar and interstitial, adipogenic, adventitial, myofibroblast-like and Thy1-expressing cells (Fig. 8e,f). As in inflamed emphysematous lung, several fibroblast clusters expressed the Hedgehog family effector transcript Gli1, while Hhip, encoding Hedgehog inhibitory protein, a negative regulator of excessive SHH tone, was seen in alveolar/interstitial fibroblasts. Il7 was expressed by adventitial and myofibroblast-like cells, alongside LECs, which is indicative of multiple possible sources of IL-7 (Fig. 8g). To test the requirement of IL-7-IL-7R signaling in TH2 progenitor cell maintenance, we administered IL-7R antibody intranasally. After 1 month of local blockade, we found significantly decreased TH2 progenitor cells and a trend toward decreased tissue eosinophilia (Fig. 8h,i). Tissue Treg cells, neutrophils and ILC2s were all unaffected by IL-7R blockade, indicating selective sensitivity of the TH2 progenitor compartment (Fig. 8j). Taken together, these findings identify tissue-specific transcriptional adaptations in TH2 progenitor cells and a tissue niche with local production of IL-7.
Discussion
It is increasingly appreciated that aberrant stem and progenitor CD4+ T cell responses are critical to the pathogenesis of autoimmune20,21,22,23,24 and type 2 inflammatory disease18. These progenitor cell states constitute key therapeutic targets for disease-modifying cellular therapies. Although the factors that sustain these states remain unclear, further studies will clarify the interplay between TH2 cells and the tissue microenvironment, including specialized DC subsets101, cytokine-rich niches46,99 and cross-talk with ILC2 (refs. 102,103), all of which may modulate chronic inflammation.
The identification of distinct niches in homeostasis, chronic inflammation and memory contexts99,104 will aid in therapeutic design. Stromal populations are likely a key regulator of tissue lymphocytes, providing instructive cues through local cytokine and chemokine gradients. Given redundant sources of cytokines in inflamed tissue, as well as converging signaling inputs, it is possible that effective therapeutic targeting of lymphocytes will require combinatorial use of antibodies targeting orthogonal pathways, as seen in cancer. While IL-7 is important for lung progenitor cell responses, other cytokines may serve as key trophic factors in other contexts. Indeed IL-33, a barrier tissue alarmin, has been shown to sustain CD8+ T cell responses in disseminated viral infection105; TSLP, another type 2 alarmin, is also repurposed in viral infection to modulate recall responses106. Concurrently, barrier tissues encounter a range of viral, bacterial and fungal pathogens and symbionts, the effects of which are difficult to capture in mouse models. Overlapping type 1, type 2 and type 3 inflammation is probably the typical tissue cytokine milieu encountered by lymphocytes; signals from type 1 inflammation may modulate access of pathogenic TH2 cells to survival niches107.
Chronic type 2 inflammation drives differentiation of progenitor-like TH2 cells exhibiting transcriptomic features of stemness, layered onto a core memory module, and with the capacity to sustain lung inflammation in the face of ongoing antigen exposure. We propose an essential TH2 cell state that sustains type 2 inflammation and whose transcriptional signature can be uncoupled from conventional memory and exhausted T cells. The cell fate bifurcation between progenitor/memory and effector states is a critical juncture whose balance is tightly regulated in lymphocyte differentiation108, as well as in tumor-reactive endogenous109,110 and chimeric antigen receptor T cells111. Thus, we propose a redirection of therapeutic strategies from late-stage mediator blockade and effector cell targeting toward eradication of the cellular reservoir that sustains the adaptive immune response.
Methods
Mice, chemicals and allergic sensitization
All animal experimentation was approved by the Brigham & Women’s Hospital Institutional Animal Care and Use Committee. Mice were maintained on a 12-h/12-h dark/light cycle at 22 °C, 42% humidity and were fed 5053 PicoLab rodent diet (LabDiet). Mouse strains in this study include B6 CD45.1 (B6.SJL-PtprcaPepcb/BoyJ), TCRβ knockout (B6.129P2-Tcrbtm1Mom/J), Tcf7Gfp (B6(Cg)-Tcf7tm1Hhx/J), CD4CreERT2 (B6(129×1)-Tg(Cd4-cre/ERT2)11Gnri/J) and C57BL/6J, all from the Jackson Laboratory; 8–12-week-old mice were used for all experiments. A. alternata extract and Der p extract were purchased from Stallergenes Greer; 6 μg of Der p and 12.5 μg Alternaria were used for each challenge. Mice were anesthetized with isoflurane and extracts were applied after dilution in normal saline. Adoptive transfers and intravascular antibody labeling were all performed using retroorbital injection. A total of 10,000–20,000 cells of the indicated TH2 populations were adoptively transferred to each recipient mouse; equal numbers of TH2 subsets were used for comparisons, for example, 10,000 progenitors versus 10,000 effectors from a given donor mouse. The 2W1S peptide (amino acid sequence: EAWGALANWAVDSA) was obtained from GenScript and reconstituted at 2 mg ml−1 in PBS. Trace amounts of NaOH were added dropwise to the PBS to facilitate solubility of 2W1S in a slightly alkaline environment. 2W1S I-AB tetramers were provided by the National Institutes of Health Tetramer Core facility. For experiments with FTY720 (Sigma-Aldrich), the compound was dissolved in 7.5% dimethyl sulfoxide, 92.5% H2O at 3 mg ml−1 to generate stock solutions and then diluted further in H2O before intraperitoneal dilution for a final dose of 20 μg per mouse (1 mg kg−1). FTY720 was administered every 48 h for 2 weeks. For the B cell depletion experiments, mice were treated with anti-CD20 antibody (clone MB20-11, BioXCell) at 250 μg intraperitoneally for one dose, followed by 50 μg intranasal doses every 48 h for 2 weeks. For the IL7R blockade experiments, mice were treated with anti-IL-7R antibody (clone A7R34, BioXCell) intranasally, 50 μg per dose, three times weekly for 4 weeks. Tamoxifen was reconstituted in sunflower oil at 20 mg ml−1; 100 μl was administered daily via intraperitoneal injection for five consecutive days. For the in vivo cell cycle analysis, mice were injected with 1 mg EdU (Cayman Chemical) 16 h before being killed; incorporated EdU was detected with the Click-iT fluorescent Azide Alexa Fluor 647 reagent (Thermo Fisher Scientific).
Lung histology
Lung lobes were rinsed in PBS and then fixed for 24 h in 4% paraformaldehyde and embedded in paraffin. Sections were stained using H&E to quantify the inflammatory cell infiltrate. A blinded pathologist imaged bronchovascular bundles from at least six different fields for each lung; cellular infiltration was graded on a scale of 0–4, with 0 denoting no inflammation and 4 indicating severe inflammation. The BALT area was also quantified as square millimeters of lung tissue, in blinded fashion. To evaluate GC metaplasia, PAS staining was performed on 5-mm paraffin sections. GCs were quantified in the bronchial epithelium of at least four independent bronchovascular bundles for each lung. Data are presented as GCs per mm of basement membrane. For immunofluorescence imaging of tissues, lung lobes were fixed for 24 h in 4% paraformaldehyde, embedded in O.C.T. medium and frozen for sectioning.
Nasal mucosa preparation
Mouse snouts were collected from euthanized mice by initially making incisions along both sides of the lower jaw, followed by a circumferential cut at the skull base to detach the head. The skin was carefully removed, and the skull was isolated from the surrounding muscle and brain tissues. The zygomatic arches were excised and longitudinal incisions along the frontal bone exposed the nasal cavity. Under a dissecting microscope, the nasal mucosa was scraped away using a scalpel until only bone remained visible. The collected mucosa was then incubated at 37 °C for 60 min in 750 µl of 10% FCS-Roswell Park Memorial Institute medium containing 2 mg ml−1 collagenase type IV (Worthington) and 10 µg ml−1 DNase I (Sigma-Aldrich). After incubation, the digested mucosa was vortexed for 30 s and further dissociated by triturating with an 18-gauge syringe needle, followed by a 21-gauge needle. The cell suspension was passed through a 70-µm cell strainer, washed once with FACS buffer and prepared for extracellular staining.
Helminth infection and tissue preparation
H.bakeri larvae were raised and maintained as described previously112. For H. bakeri infections, mice were infected via oral gavage with 200 L3 larvae and euthanized at acute (day 18) or chronic (day 42) time points to collect tissues for analysis using flow cytometry. For small intestine lamina propria preparations, similar methods to Mayer et al. were used113. Briefly, mice were anesthetized with 2,2,2-tribromoethanol (Avertin) (Sigma-Aldrich); the small intestine was nicked at the duodenum and transected at the cecum and flushed with 20 ml 37 °C HBSS (no Ca2+/Mg2+) + 10 mM HEPES. Mice were then perfused through the heart with 30 ml of 30 mM EDTA + 10 mM HEPES in HBSS (no Ca2+/Mg2+). Three minutes after initiating perfusion, the first 10 cm of the proximal small intestine were collected, Peyer’s patches were removed, tissue was fileted open, cut into 2–3-cm sections and transferred to 35 ml ice-cold HBSS (no Ca2+/Mg2+) + 10 mM HEPES and shaken vigorously for 30 s to release epithelial cells. Intestinal pieces were filtered through a mesh and stored in HBSS + 5% FCS on ice and then transferred into pre-warmed digest buffer composed of Roswell Park Memorial Institute medium (with Ca2+/Mg2+) supplemented with 20% FCS (Biowest), 1 mg ml−1 collagenase A (Sigma-Aldrich), 10 mM HEPES, 1 mg ml−1 DNase I (Sigma-Aldrich) and shaken at 200 rpm at 37 °C for 30 min. Tissues were vortexed and cells were passed through a 100-µm filter, washed with ice-cold HBSS (no Ca2+/Mg2+) + 10 mM HEPES, then passed through a 40-µm filter and washed with HBSS (no Ca2+/Mg2+) + 10 mM HEPES. Cells were then centrifuged for 5 min at 500g and the supernatant was discarded. Pelleted cells were then washed and stained for flow cytometry. To prepare mesLNs, LNs were resected, stored in HBSS + 5% FCS on ice, mashed through a 70-µm filter into DPBS and washed once with DPBS.
Flow cytometry
For intracellular staining of transcription factors and cytokines, cells were fixed/permeabilized for 25 min at room temperature with the FoxP3 Transcription Factor Staining Buffer Kit (eBioscience). All intracellular staining was performed at 4 °C for 1 h. For assessment of responses to cytokine stimulation, cells were stimulated with phorbol 12-myristate 13-acetate/ionomycin for 4 h. All samples were run on a BD Fortessa or BD Symphony. Tetramer staining was performed at room temperature for 1 h. Data were analyzed using FlowJo (v.10).
scRNA-seq and scTCR-seq
For the analysis of the CD4+ T cell subsets, lung cells were isolated after allergen challenge with Alternaria and Der p at the indicated times and sorted as CD45+TCRβ+CD4+CD44+CD45(IV)−CD8−CD19− on a BD FACSAria Fusion using a 70-μm nozzle. Single-cell suspensions were loaded at a cell density of 50,000 cells per chip using the Chromium Single-Cell Next GEM 5′ Reagent Kit (V3, 10X Genomics) according to the manufacturer’s instructions. Gene expression matrices were generated using Cell Ranger. We removed low-quality cells with fewer than 200 measured genes and a high percentage of mitochondrial transcripts (>12%), analyzing a total of 17,036 lung cells after quality control. All subsequent steps were performed using standard functions in Seurat (NormalizeData, FindVariableFeatures, ScaleData, RunPCA, FindNeighbors, FindClusters, RunUMAP) with default parameters and a 0.5-resolution. The analysis package scCustomize was used to generate some of the plots114. Several clusters containing cells that are not part of the TH2 lineage were identified, including TH17 cells expressing Rorc and Il23r, natural killer T cells expressing Zbtb16 and an innate-like cluster with lower Cd3e, Cd4 and Lck expression as well as some Trdv4 and Tcrg-C4 expression (Extended Data Fig. 6a). An Eomes+ cytotoxic cluster with granzyme expression was present. These clusters were not analyzed further in this manuscript.
For the scTCR-seq analysis, TCR sequences were associated with each cell barcode and analyzed with standard functions using the package scRepertoire115. Clonal overlap was visualized as a Circos plot using the package Circlize. Individual TCR clones per cells were visualized on the UMAP space in black highlight. We defined a clonal expansion index based on the concept that a T cell clone proliferates as it terminally differentiates into effector cells, such that there should be more cells of the differentiated state present, and positive expansion indices are consistent with the starting node occupying a less differentiated state. To calculate the pairwise expansion indices for overlapping clones, we divided the number of cells expressing a TCR sequence in the putative effector cluster by the number of cells expressing that TCR sequence in the root cluster. Positive values indicate clonal expansion in the effector cluster, while negative values indicate clonal expansion in the root cluster.
For analysis of whole-lung lysates, equal numbers of live CD45+TCRβ− and CD45−TCRβ− cells were sorted from four mice at the acute time point and four mice at the chronic time point and loaded onto 10X sequencing chips with the On-Chip Multiplexing platform; single-cell libraries were prepared using the Chromium Single-Cell Next GEM 3′ Reagent Kit (V3, 10X Genomics). Cell–cell interaction analysis was performed with the package Cellchat86 using an integrated transcriptomic space containing cells identified from the Fig. 6a scRNA-seq dataset and the Fig. 5a T cell scRNA-seq dataset. All statistically significant receptor–ligand interactions are presented in Extended Data Fig. 10a, while several key pairs are shown in Fig. 6. Covarying neighborhood analysis was performed using the package rCNA85.
Integrated bioinformatic analysis
Several publicly available scRNA-seq datasets were analyzed including: acute Alternaria (GSE245074)43; resting memory/recall A. fumigatus (GSE190795)11; and LCMV clone 13 infection (GSE181474 (ref. 37) and GSE182320 (ref. 70)). For all analyses of previously published datasets, we download the available CellRanger output files and then analyzed them using the same Seurat pipeline as for our scRNA-seq studies. We removed low-quality cells with fewer than 200 measured genes and a high percentage of mitochondrial transcripts (>12%). All subsequent steps were performed using standard functions in Seurat (NormalizeData, FindVariableFeatures, ScaleData, RunPCA, FindNeighbors, FindClusters, RunUMAP) with default parameters and a 0.75-resolution. To compare chronic type 2 inflammation and chronic infection or resting TH2 memory, respectively, we integrated the scRNA-seq datasets using the Harmony74 algorithm to mitigate batch effect with parameters λ = 0.3 and θ = 4. ‘ModuleScores’ were derived using the Seurat AddModuleScore function, which calculates an average z-score of each transcript’s deviation from an expected mean in comparison to a control set of transcripts. Transcripts included in the respective modules included: core memory module: Tcf7, Lef1, Foxo1, Sell, S1pr1, Satb1, Ets1, Pou2f2; stemness module: Aff3, TCF12, Bach2, Fli1, Ikzf3, Mef2a; resting memory module: Bcl2, S1pr1, Mcl1, Klf2, Ly6a; and interferon-response module: Ifi27l2a, Ifi27, Ifitm1, Ifitm2, Ifi203, Ifitm1, Isg15, Ifit3, fit2, Ifit1, Isg20, Iigp1, Irf7, BST2, Oas1a, Oas2, Oas3, Trim56, Trim22, Rnf213.
Pseudobulk differential expression analysis
To define differentially expressed transcripts between time points from the scRNA-seq data, a pseudobulk approach was applied. Each cluster from the UMAP space was considered separately and mice were treated as biological replicates. The average counts for each transcript in a given cluster were calculated; DESeq2 was used to determine differentially expressed transcripts with ‘time point’ defined as the ‘group’ for the differential expression contrast model. We excluded transcripts that had a minimum average count of less than ten in a given cluster.
Visium HD spatial transcriptomics
Formalin-fixed, paraffin-embedded tissue blocks were generated from lungs of mice at the acute and chronic time points of allergen challenge. Then, 10-μM tissue slices were cut and mounted onto standard microscopy slides. High-resolution H&E images were obtained using an Olympus VS200 Slide Scanner. Following the manufacturer’s instructions (10X Genomics, CD000685, rev. A), slides were dried at 42 °C for 3 h, dehydrated overnight, baked at 60 °C for 30 min and deparaffinized/decrosslinked. Probe hybridization, RNA removal and probe amplification were performed, followed by transfer and image alignment using Cytassist. Downstream libraries were sequenced using an Illumina NextSeq 2000, targeting at least 200 million reads per slide. The Space Ranger software (10X Genomics) was used for demultiplexing and FASTQ file generation, followed by generation of count matrices at 2-μm spot resolution, followed by binning to 16-μm resolution. Subsequent analyses were performed in R with Seurat (v.5.1.0) using standard functions: NormalizeData, FindVariableFeatures, ScaleData, RunPCA, FindNeighbors, FindClusters (0.5-resolution), RunUMAP. To define tissue microdomains, we used the package BANKSY, implemented within Seurat, with a λ parameter of 0.8. Expression of cluster-defining markers was determined for BANKSY clusters. Marker expression visualization of tissue domains superimposed on high-resolution H&E images was performed using the Python package Napari.
Statistical analysis
Statistical analyses were performed using Prism v.9 (GraphPad Software). Individual statistical tests and significance cutoffs are indicated in each figure legend. All error bars shown are representative of the s.e.m. unless otherwise noted. All statistical tests for hypothesis testing were two-sided
Reporting summary
Further information on research design is available in the Nature Portfolio Reporting Summary linked to this article
Data availability
The newly generated scRNA-seq data are available under accession no. GSE333232
Code availability
All analyses and figures were generated using publicly available software packages. No custom code was used in this study
References
Nakayama, T. et al. Th2 cells in health and disease. Annu. Rev. Immunol.35, 53–84 (2016)
Coquet, J. M. et al. Interleukin-21-producing CD4+ T cells promote type 2 immunity to house dust mites. Immunity43, 318–330 (2015)
Chen, T. et al. PPAR-γ promotes type 2 immune responses in allergy and nematode infection. Sci. Immunol.2, eaal5196 (2017)
Tibbitt, C. A. et al. Single-cell RNA sequencing of the T helper cell response to house dust mites defines a distinct gene expression signature in airway Th2 cells. Immunity51, 169–184 (2018)
Zou, X. et al. Hypoxia-inducible factor 2α promotes pathogenic polarization of stem-like Th2 cells (2024)
Khan, M. et al. Single-cell and chromatin accessibility profiling reveals regulatory programs of pathogenic Th2 cells in allergic asthma. Nat. Commun.16, 2565 (2025)
He, K. et al. Blimp-1 is essential for allergen-induced asthma and Th2 cell development in the lung. J. Exp. Med.217, e20190742 (2020)
Sethi, G. S., Premlal, A. L. R., Chawla, A. & Croft, M. ICOSL, OX40L, and CD30L control persistence of asthmatic CD4 Trm cells. J. Allergy Clin. Immunol.155, 1993–2008 (2025)
Kobayashi, T., Iijima, K., Matsumoto, K., Lama, J. K. & Kita, H. Lung-resident CD69+ST2+ TH2 cells mediate long-term type 2 memory to inhaled antigen in mice. J. Allergy Clin. Immunol.152, 167–181 (2023)
Bošnjak, B., Kazemi, S., Altenburger, L. M., Mokrović, G. & Epstein, M. M. Th2-TRMs maintain life-long allergic memory in experimental asthma in mice. Front. Immunol.10, 840 (2019)
Ulrich, B. J. et al. Allergic airway recall responses require IL-9 from resident memory CD4+ T cells. Sci. Immunol.7, eabg9296 (2022)
Turner, D. L. et al. Biased generation and in situ activation of lung tissue–resident memory CD4 T cells in the pathogenesis of allergic asthma. J. Immunol.200, 1561–1569 (2018)
Hondowicz, B. D. et al. Interleukin-2-dependent allergen-specific tissue-resident memory cells drive asthma. Immunity44, 155–166 (2016)
Rahimi, R. A., Nepal, K., Cetinbas, M., Sadreyev, R. I. & Luster, A. D. Distinct functions of tissue-resident and circulating memory Th2 cells in allergic airway disease. J. Exp. Med.217, e20190865 (2020)
Kabat, A. M. et al. Resident TH2 cells orchestrate adipose tissue remodeling at a site adjacent to infection. Sci. Immunol.7, eadd3263 (2022)
Blank, C. U. et al. Defining ‘T cell exhaustion’. Nat. Rev. Immunol.19, 665–674 (2019)
Walker, J. A. & McKenzie, A. N. J. TH2 cell development and function. Nat. Rev. Immunol.18, 121–133 (2018)
Kratchmarov, R. et al. TCF1–LEF1 co-expression identifies a multipotent progenitor cell (TH2-MPP) across human allergic diseases. Nat. Immunol.25, 902–915 (2024)
Zhao, X., Shan, Q. & Xue, H.-H. TCF1 in T cell immunity: a broadened frontier. Nat. Rev. Immunol.22, 147–157 (2022)
Li, Y. et al. Stem-like T cells are associated with the pathogenesis of ulcerative colitis in humans. Nat. Immunol.25, 1231–1244 (2024)
Sato, Y. et al. Stem-like CD4+ T cells in perivascular tertiary lymphoid structures sustain autoimmune vasculitis. Sci. Transl. Med.15, eadh0380 (2023)
Zou, D. et al. CD4+ T cell immunity is dependent on an intrinsic stem-like program. Nat. Immunol.25, 66–76 (2024)
Karmaus, P. W. F. et al. Metabolic heterogeneity underlies reciprocal fates of TH17 cell stemness and plasticity. Nature565, 101–105 (2019)
Aljobaily, N. et al. Autoimmune CD4+ T cells fine-tune TCF1 expression to maintain function and survive persistent antigen exposure during diabetes. Immunity57, 2583–2596 (2024)
Gearty, S. V. et al. An autoimmune stem-like CD8 T cell population drives type 1 diabetes. Nature602, 156–161 (2022)
Stockis, J. et al. Cross-talk between ILC2 and Gata3high Tregs locally constrains adaptive type 2 immunity. Sci. Immunol.9, eadl1903 (2024)
Koh, B. et al. Bcl6 and Blimp1 reciprocally regulate ST2+ Treg–cell development in the context of allergic airway inflammation. J. Allergy Clin. Immunol.146, 1121–1136 (2020)
Cipolletta, D. et al. PPAR-γ is a major driver of the accumulation and phenotype of adipose tissue Treg cells. Nature486, 549–553 (2012)
Kourepini, E. et al. TIGIT enhances antigen-specific Th2 recall responses and allergic disease. J. Immunol.196, 3570–3580 (2016)
Paley, M. A. et al. Progenitor and terminal subsets of CD8+ T cells cooperate to contain chronic viral infection. Science338, 1220–1225 (2012)
Utzschneider, D. T. et al. T Cell factor 1-expressing memory-like CD8+ T cells sustain the immune response to chronic viral infections. Immunity45, 415–427 (2016)
Im, S. J. et al. Defining CD8+ T cells that provide the proliferative burst after PD-1 therapy. Nature537, 417–421 (2016)
Wu, T. et al. The TCF1–Bcl6 axis counteracts type I interferon to repress exhaustion and maintain T cell stemness. Sci. Immunol.1, eaai8593 (2016)
Yang, Q. et al. TCF-1 upregulation identifies early innate lymphoid progenitors in the bone marrow. Nat. Immunol.16, 1044–1050 (2015)
Philip, M. & Schietinger, A. CD8+ T cell differentiation and dysfunction in cancer. Nat. Rev. Immunol.22, 209–223 (2022)
Tsui, C. et al. MYB orchestrates T cell exhaustion and response to checkpoint inhibition. Nature609, 354–360 (2022)
Xia, Y. et al. BCL6-dependent TCF-1+ progenitor cells maintain effector and helper CD4+ T cell responses to persistent antigen. Immunity55, 1200–1215 (2022)
Verbeek, S. et al. An HMG-box-containing T-cell factor required for thymocyte differentiation. Nature374, 70–74 (1995)
Yu, Q. et al. T cell factor 1 initiates the T helper type 2 fate by inducing the transcription factor GATA-3 and repressing interferon-gamma. Nat. Immunol.10, 992–999 (2009)
Ferreira, D. P. et al. Central memory CD8+ T cells derive from stem-like Tcf7hieffector cells in the absence of cytotoxic differentiation. Immunity53, 985–1000 (2020)
Silva, J. G. et al. Emergence and fate of stem cell–like Tcf7+ CD8+ T cells during a primary immune response to viral infection. Sci. Immunol.8, eadh3113 (2023)
Gurram, R. K. et al. Crosstalk between ILC2s and Th2 cells varies among mouse models. Cell Rep.42, 112073 (2023)
Ualiyeva, S. et al. A nasal cell atlas reveals heterogeneity of tuft cells and their role in directing olfactory stem cell proliferation. Sci. Immunol.9, eabq4341 (2024)
Ricardo-Gonzalez, R. R. et al. Tissue signals imprint ILC2 identity with anticipatory function. Nat. Immunol.19, 1093–1099 (2018)
Loredan, D. G., Devlin, J. C., Khanna, K. M. & Loke, P. Recruitment and maintenance of CX3CR1+CD4+ T cells during helminth infection. J. Immunol.212, 632–644 (2024)
He, K. et al. Spatial microniches of IL-2 combine with IL-10 to drive lung migratory TH2 cells in response to inhaled allergen. Nat. Immunol.25, 2124–2139 (2024)
Furuta, G. T. & Katzka, D. A. Eosinophilic esophagitis. N. Engl. J. Med.373, 1640–1648 (2015)
Kaneko, T. et al. Amphiregulin-producing TH2 cells facilitate esophageal fibrosis of eosinophilic esophagitis. J. Allergy Clin. Immunol. Glob.3, 100287 (2024)
Morgan, D. M. et al. Clonally expanded, GPR15-expressing pathogenic effector TH2 cells are associated with eosinophilic esophagitis. Sci. Immunol.6, eabi5586 (2021)
Wen, T. et al. Single-cell RNA sequencing identifies inflammatory tissue T cells in eosinophilic esophagitis. J. Clin. Invest.129, 2014–2028 (2019)
Lan, X. et al. Antitumor progenitor exhausted CD8+ T cells are sustained by TCR engagement. Nat. Immunol.25, 1046–1058 (2024)
Stark, J. M. et al. Recombinant multimeric dog allergen prevents airway hyperresponsiveness in a model of asthma marked by vigorous TH2 and TH17 cell responses. Allergy77, 2987–3001 (2022)
Wallrapp, A. et al. The neuropeptide NMU amplifies ILC2-driven allergic lung inflammation. Nature549, 351–356 (2017)
Cardoso, V. et al. Neuronal regulation of type 2 innate lymphoid cells
Klose, C. S. N. et al. The neuropeptide neuromedin U stimulates innate lymphoid cells and type 2 inflammation. Nature549, 282–286 (2017)
Mashimo, H., Wu, D. C., Podolsky, D. K. & Fishman, M. C. Impaired defense of intestinal mucosa in mice lacking intestinal trefoil factor. Science274, 262–265 (1996)
Okamoto, M. et al. Tff1-expressing Tregs in lung prevent exacerbation of Bleomycin-induced pulmonary fibrosis. Front. Immunol.15, 1440918 (2024)
Morimoto, Y. et al. Amphiregulin-producing pathogenic memory T helper 2 cells instruct eosinophils to secrete osteopontin and facilitate airway fibrosis. Immunity49, 134–150 (2018)
Ciucci, T. et al. Dependence on Bcl6 and Blimp1 drive distinct differentiation of murine memory and follicular helper CD4+ T cells. J. Exp. Med.219, e20202343 (2022)
Rao, D. A. et al. Pathologically expanded peripheral T helper cell subset drives B cells in rheumatoid arthritis. Nature542, 110–114 (2017)
Alfei, F. et al. TOX reinforces the phenotype and longevity of exhausted T cells in chronic viral infection. Nature571, 265–269 (2019)
Khan, O. et al. TOX transcriptionally and epigenetically programs CD8+ T cell exhaustion. Nature571, 211–218 (2019)
Scott, A. C. et al. TOX is a critical regulator of tumour-specific T cell differentiation. Nature571, 270–274 (2019)
Karagiannis, F. et al. Lipid-droplet formation drives pathogenic group 2 innate lymphoid cells in airway inflammation. Immunity52, 620–634 (2020)
Hou, Y. et al. Neuropeptide signalling orchestrates T cell differentiation. Nature635, 444–452 (2024)
Bianchi, E., Doe, B., Goulding, D. & Wright, G. J. Juno is the egg Izumo receptor and is essential for mammalian fertilization. Nature508, 483–487 (2014)
Zarin, P. et al. Treg cells require Izumo1R to regulate γδT cell-driven inflammation in the skin. Proc. Natl Acad. Sci. USA120, e2221255120 (2023)
Iyer, S. S. et al. Identification of novel markers for mouse CD4+T follicular helper cells. Eur. J. Immunol.43, 3219–3232 (2013)
Crawford, A. et al. Molecular and transcriptional basis of CD4+ T cell dysfunction during chronic infection. Immunity40, 289–302 (2014)
Andreatta, M. et al. A CD4+ T cell reference map delineates subtype-specific adaptation during acute and chronic viral infections. eLife11, e76339 (2022)
Zander, R., Khatun, A., Kasmani, M. Y., Chen, Y. & Cui, W. Delineating the transcriptional landscape and clonal diversity of virus-specific CD4+ T cells during chronic viral infection. eLife11, e80079 (2022)
Doering, T. A. et al. Network analysis reveals centrally connected genes and pathways involved in CD8+ T cell exhaustion versus memory. Immunity37, 1130–1144 (2012)
Yu, B. et al. Epigenetic landscapes reveal transcription factors that regulate CD8+ T cell differentiation. Nat. Immunol.18, 573–582 (2017)
Guan, T. et al. ZEB1, ZEB2, and the miR-200 family form a counterregulatory network to regulate CD8+ T cell fates. J. Exp. Med.215, 1153–1168 (2018)
Roychoudhuri, R. et al. BACH2 regulates CD8+ T cell differentiation by controlling access of AP-1 factors to enhancers. Nat. Immunol.17, 851–860 (2016)
Yao, C. et al. BACH2 enforces the transcriptional and epigenetic programs of stem-like CD8+ T cells. Nat. Immunol.22, 370–380 (2021)
Liberzon, A. et al. The Molecular Signatures Database hallmark gene set collection. Cell Syst.1, 417–425 (2015)
Bengsch, B. et al. Bioenergetic insufficiencies due to metabolic alterations regulated by the inhibitory receptor PD-1 are an early driver of CD8+ T cell exhaustion. Immunity45, 358–373 (2016)
Adams, W. C. et al. Anabolism-associated mitochondrial stasis driving lymphocyte differentiation over self-renewal. Cell Rep.17, 3142–3152 (2016)
Shi, H., Doench, J. G. & Chi, H. CRISPR screens for functional interrogation of immunity. Nat. Rev. Immunol.23, 363–380 (2023)
Zhou, P. et al. Single-cell CRISPR screens in vivo map T cell fate regulomes in cancer. Nature624, 154–163 (2023)
Lee, L. N., Burke, S., Montoya, M. & Borrow, P. Multiple mechanisms contribute to impairment of type 1 interferon production during chronic lymphocytic choriomeningitis virus infection of mice. J. Immunol.182, 7178–7189 (2009)
Zuniga, E. I., Liou, L.-Y., Mack, L., Mendoza, M. & Oldstone, M. B. A. Persistent virus infection inhibits type i interferon production by plasmacytoid dendritic cells to facilitate opportunistic infections. Cell Host Microbe4, 374–386 (2008)
Opferman, J. T. et al. Development and maintenance of B and T lymphocytes requires antiapoptotic MCL-1. Nature426, 671–676 (2003)
Reshef, Y. A. et al. Co-varying neighborhood analysis identifies cell populations associated with phenotypes of interest from single-cell transcriptomics. Nat. Biotechnol.40, 355–363 (2022)
Jin, S. et al. Inference and analysis of cell-cell communication using CellChat. Nat. Commun.12, 1088 (2021)
Schumacher, T. N. & Thommen, D. S. Tertiary lymphoid structures in cancer. Science375, eabf9419 (2022)
Singhal, V. et al. BANKSY unifies cell typing and tissue domain segmentation for scalable spatial omics data analysis. Nat. Genet.56, 431–441 (2024)
Sugiyama, T., Kohara, H., Noda, M. & Nagasawa, T. Maintenance of the hematopoietic stem cell pool by CXCL12-CXCR4 chemokine signaling in bone marrow stromal cell niches. Immunity25, 977–988 (2006)
Davidson, S. et al. Fibroblasts as immune regulators in infection, inflammation and cancer. Nat. Rev. Immunol.21, 704–717 (2021)
Buchheit, K. M. et al. IL-5Rα marks nasal polyp IgG4- and IgE-expressing cells in aspirin-exacerbated respiratory disease. J. Allergy Clin. Immunol.145, 1574–1584 (2020)
Cabrita, R. et al. Tertiary lymphoid structures improve immunotherapy and survival in melanoma. Nature577, 561–565 (2020)
Helmink, B. A. et al. B cells and tertiary lymphoid structures promote immunotherapy response. Nature577, 549–555 (2020)
Peng, C. et al. Engagement of the costimulatory molecule ICOS in tissues promotes establishment of CD8+ tissue-resident memory T cells. Immunity55, 98–114 (2022)
Wu, J. E. et al. In vitro modeling of CD8+ T cell exhaustion enables CRISPR screening to reveal a role for BHLHE40. Sci. Immunol.8, eade3369 (2023)
Takao, T. et al. Maternal asthma imprints fetal lung ILC2s inflammation in murine adult offspring. Nat. Commun.16, 631 (2025)
Jarjour, N. N. et al. Collaboration between interleukin-7 and -15 enables adaptation of tissue-resident and circulating memory CD8+ T cells to cytokine deficiency. Immunity58, 616–631 (2025)
Jalkanen, S. & Salmi, M. Lymphatic endothelial cells of the lymph node. Nat. Rev. Immunol.20, 566–578 (2020)
Shinoda, K. et al. Thy1+IL-7+ lymphatic endothelial cells in iBALT provide a survival niche for memory T-helper cells in allergic airway inflammation. Proc. Natl Acad. Sci. USA113, E2842–E2851 (2016)
Wang, C. et al. Dysregulated lung stroma drives emphysema exacerbation by potentiating resident lymphocytes to suppress an epithelial stem cell reservoir. Immunity56, 576–591 (2023)
Lyons-Cohen, M. R., Shamskhou, E. A. & Gerner, M. Y. Site-specific regulation of Th2 differentiation within lymph node microenvironments. J. Exp. Med.221, e20231282 (2024)
Gogoi, M. et al. ILC2-derived LIF licences progress from tissue to systemic immunity. Nature632, 885–892 (2024)
Zaiss, D. M. W., Pearce, E. J., Artis, D., McKenzie, A. N. J. & Klose, C. S. N. Cooperation of ILC2s and TH2 cells in the expulsion of intestinal helminth parasites. Nat. Rev. Immunol.24, 294–302 (2024)
Dahlgren, M. W. et al. Adventitial stromal cells define group 2 innate lymphoid cell tissue niches. Immunity50, 707–722 (2019)
Marx, A.-F. et al. The alarmin interleukin-33 promotes the expansion and preserves the stemness of Tcf-1+ CD8+ T cells in chronic viral infection. Immunity56, 813–828 (2023)
Ebina-Shibuya, R. et al. Thymic stromal lymphopoietin limits primary and recall CD8+ T-cell anti-viral responses. eLife10, e61912 (2021)
Cautivo, K. M. et al. Interferon gamma constrains type 2 lymphocyte niche boundaries during mixed inflammation. Immunity55, 254–271 (2022)
Lin, W.-H. W. et al. Asymmetric PI3K signaling driving developmental and regenerative cell fate bifurcation. Cell Rep.13, 2203–2218 (2015)
Wang, P. H. et al. Reciprocal transmission of activating and inhibitory signals and cell fate in regenerating T cells. Cell Rep.42, 113155 (2023)
Gill, A. L. et al. PD-1 blockade increases the self-renewal of stem-like CD8 T cells to compensate for their accelerated differentiation into effectors. Sci. Immunol.8, eadg0539 (2023)
Lee, C. S. et al. Fate induction in CD8 CAR T cells through asymmetric cell division. Nature633, 670–677 (2024)
Johnston, C. J. C. et al. Cultivation of Heligmosomoides polygyrus: an immunomodulatory nematode parasite and its secreted products. J. Vis. Exp.98, 52412 (2015)
Ferrer-Font, L. et al. High-dimensional analysis of intestinal immune cells during helminth infection. eLife9, e51678 (2020)
Marsh, S. scCustomize: Custom visualizations & functions for streamlined analyses of single cell sequencing. Zenodohttps://doi.org/10.5281/zenodo.5706430
Borcherding, N., Bormann, N. L. & Kraus, G. scRepertoire: An R-based toolkit for single-cell immune receptor analysis. F1000Res.9, 47 (2020)
Acknowledgements
We thank N. A. Case and H. T. Pahima (Brigham & Women’s Hospital) for assistance with the retroorbital injections. We are grateful for input from M. ElTanbouly (Rockefeller University) for assistance with B cell cluster annotation and to J. Case and the BWH Center for Cellular Profiling Single Cell Genomics Core for assistance with single-cell transcriptomics. We thank the National Institutes of Health (NIH) Tetramer Core Facility (NIH contract no. 75N93020D00005 and Research Resource Identifier:SCR_026557) for providing the 2W1S I-AB tetramers. We also acknowledge the Microscopy Resources on the North Quad (MicRoN) core at Harvard Medical School for assistance use of the Olympus VS200 Slide Scanner.
Funding
This work was supported by NIH grant nos. U19AI095219, T32AI007306, R01AI167923, R01AI145848, R01AI170715, R01AI187143 and K08AI190123, and generous support from the Vinik and Karol Families
Author information
Author notes
These authors contributed equally: Radomir Kratchmarov, Xiaojiong Jia
Authors and Affiliations
Division of Allergy and Clinical Immunology, Department of Medicine, Brigham and Women’s Hospital, Harvard Medical School, Boston, MA, USA
Radomir Kratchmarov, Xiaojiong Jia, Jun Nagai, Alexander Perniss, Hiroaki Hayashi, Caitlin Wong, Madeline M. Hastings, Kinan Alhallak, Juying Lai, Chunli Feng, Lora Bankova, Joshua A. Boyce & Patrick J. Brennan
Division of Allergy and Clinical Immunology & Division of Genetics, Department of Medicine, Brigham and Women’s Hospital Boston, Harvard Medical School, Boston, MA, USA
Gaspar A. Pacheco, Shahab Saghaei & Duane R. Wesemann
The Broad Institute of MIT and Harvard, Cambridge, MA, USA
Gaspar A. Pacheco, Shahab Saghaei & Duane R. Wesemann
The Ragon Institute of MGH, MIT and Harvard, Cambridge, MA, USA
Gaspar A. Pacheco, Shahab Saghaei & Duane R. Wesemann
Department of Immunology, University of Washington School of Medicine, Seattle, WA, USA
Madeleine R. Bell, Ersin Gül, Thornton W. Thompson & Jakob von Moltke
Authors
- Radomir KratchmarovView author publications
Search author on:PubMed Google Scholar
- Xiaojiong JiaView author publications
Search author on:PubMed Google Scholar
- Jun NagaiView author publications
Search author on:PubMed Google Scholar
- Gaspar A. PachecoView author publications
Search author on:PubMed Google Scholar
- Alexander PernissView author publications
Search author on:PubMed Google Scholar
- Madeleine R. BellView author publications
Search author on:PubMed Google Scholar
- Ersin GülView author publications
Search author on:PubMed Google Scholar
- Thornton W. ThompsonView author publications
Search author on:PubMed Google Scholar
- Hiroaki HayashiView author publications
Search author on:PubMed Google Scholar
- Shahab SaghaeiView author publications
Search author on:PubMed Google Scholar
- Caitlin WongView author publications
Search author on:PubMed Google Scholar
- Madeline M. HastingsView author publications
Search author on:PubMed Google Scholar
- Kinan AlhallakView author publications
Search author on:PubMed Google Scholar
- Juying LaiView author publications
Search author on:PubMed Google Scholar
- Chunli FengView author publications
Search author on:PubMed Google Scholar
- Lora BankovaView author publications
Search author on:PubMed Google Scholar
- Duane R. WesemannView author publications
Search author on:PubMed Google Scholar
- Jakob von MoltkeView author publications
Search author on:PubMed Google Scholar
- Joshua A. BoyceView author publications
Search author on:PubMed Google Scholar
- Patrick J. BrennanView author publications
Search author on:PubMed Google Scholar
Contributions
R.K. and X.J. performed most of the experiments and analyzed the data. R.K. and P.J.B. designed the project, supervised the experiments and analysis, and wrote the manuscript. J.N., G.A.P., A.P., M.R.B., E.G., T.W.T., H.H., S.S., C.W., M.M.H., K.A., J.L. and C.F. performed the experiments and analyzed the data. L.B., D.R.W., J.v.M. and J.A.B. managed and contributed critical reanuscript
Ethics declarations
Competing interests
The authors declare no competing interests
Peer review
Peer review information
Nature Immunology thanks Rod Rahimi and the other anonymous reviewer(s) for their contribution to the peer review of this work. Peer reviewer reports are available. Primary Handling Editor: S. Houston in collaboration with the Nature Immunology team
Additional information
Publisher’s note Springer Nature remains neutral with regard to jurisdictional claims in published maps and institutional affiliations
Extended data
Extended Data Fig. 1 A chronic model of pulmonary allergen challenge
a) Representative flow cytometry gating sequence for identification of tissue GATA3 + Th2 cells. b) Left: Representative flow cytometry gating sequence for identification of tissue ILC2 cells. Middle: quantification of total number of ILC2s in the lung at acute and chronic allergen challenge timepoints. Right: quantification of proliferating ILC2 frequencies as a percent of total ILC2s in the lung at indicated timepoints. N = 10 Acute, N = 7 Chronic. c) Left: Representative flow cytometry gating of KLRG1 expression by Foxp3 + GATA3+ Tregs and Th2 cells. Middle: %KLRG1+ cells of GATA3+ Tregs. Right: %KLRG1+ cells of Th2 at the acute and chronic timepoints. N = 5. d) Quantification of CD62L+ cells as a percent of Th2 at the acute and chronic timepoints. N = 9 Acute, N = 8 chronic. e) Upper: Expression of PD1, Tim3, Fr4, and Tigit by Th2 cells. Quantification of %positive Th2 cells for each marker. N = 7 Acute, N = 9 Chronic. f) Left: Representative histogram of CTLA4 expression by indicated populations and quantification of CTLA4 MFI. N = 4. Right: Expression of ST2 and CTLA4 by Th2 cells and quantification of %CTLA4 + Th2 at indicated timepoints. N = 5. g) Expression of PD1, CXCR5 and BCL6 by Tconv (CD44+Foxp3-) or Th2 cells in the lung (left) or mLN (right) at the indicated timepoints. N = 5. For all plots, Ns, not significant, **p < 0.01. ****p < 0.0001. ns, not significant. Line denotes median. Two-tailed T test. Th2 cells are gated as CD4 + CD44 + CD45(IV)-Foxp3-GATA3 + .
Extended Data Fig. 2 Adoptive transfer of Th2 subsets into TCRβKO recipient mice
a) Representative gating sequence for FACS of Th2 progenitor, intermediate, and effector subsets. b) Representative histogram of Tcf7Gfp fluorescence by indicated subsets. c) Left: expression of Ki67 and ST2 by transferred cells of the indicated populations. Right: quantification of Ki67 + Th2 cells. *p < 0.05, ns, not significant. Line denotes median. One-way, two-tailed ANOVA with Holm–Šidák’s correction for multiple comparisons. N = 10. d) Schematic of strategy for allergen challenge and adoptive transfer using Tcf7Gfpreporter mice. Right: gating of CD4 + CD44+ tissue T cell subsets defined by Tcf7GFP and ST2 expression. e) Left: Post-adoptive transfer gating of CD45.2+ Tcf7Gfp reporter donor cells from the indicated populations. Right: quantification of recovered cells in lung 2 weeks after adoptive transfer. *p < 0.05. Two-tailed T test. N = 5. f) Expression of TCF1 and ST2 by Th2 cells two weeks after adoptive transfer of indicated Tcf7Gfp subsets. g) Left: Steady state deletion efficiency of CD4-CreERT2 Tcf7 fl/fl mice in lung (upper) and spleen (lower), one week after tamoxifen pulse. Right: Deletion efficiency in littermate-matched Tcf7 fl/fl and CD4-CreERT2 Tcf7 fl/fl mice. ***p < 0.001. ****p < 0.0001. Line denotes median. Two-tailed T test. N = 5 Tcf7fl/fl, N = 3 CD4-CreERT2 Tcf7 fl/fl. h) Left: quantification of Ki67 + ILC2s after adoptive transfer of the indicated Th2 subsets. Right: *p < 0.05, **p < 0.01, ns, not significant. Line denotes median. One-way, two-tailed ANOVA with Holm-Sidak’s correction for multiple comparisons. N = 5 Control, 7 Progenitor, and 3 Effector transfer recipients. i) Early adoptive transfer: Quantification of tissue eosinophils and CD4 + T cells at 5 days post-adoptive transfer of the indicated subsets. ****p < 0.0001. ns, not significant. Two-tailed T test. N = 3. For all plots, Th2 cells are gated as CD4 + CD44 + CD45(IV)-Foxp3-GATA3 + . Schematic in panel d created with BioRender.com.
Extended Data Fig. 3 Additional analysis of organ-specific models of type 2 inflammation
a) Representative gating of TCF1+ cells among Th2 cells (CD4 + CD44 + CD45(IV)-Foxp3-GATA3 + ), GATA3+ Tregs (CD4 + CD44 + CD45(IV)-Foxp3 + GATA3 + ), and other memory effector CD4 + T cells (CD4 + CD44 + GATA3-). ****p < 0.0001. ns, not significant. One-way, two-tailed ANOVA with Holm-Sidak’s correction for multiple comparisons. N = 6. For box and whisker plots, line denotes median, box range denotes 25th to 75th percentiles, whiskers show minimum and maximum values. b) UMAP of lymphocytes from the Ualiyeva et al.43 scRNAseq dataset. c) Left: FeaturePlots of key lineage defining transcripts. Right: DotPlot of key progenitor and effector markers. d) Upper: Representative flow cytometry gating of Th2 cells in the lamina propria and mesenteric lymph nodes of mice infected with H. bakeri. Lower: Expression of CD62L and IL17RB by Th2 cells in the indicated organs. e) Representative flow cytometry gating of IL17RB (upper) and Ki67 (lower) expression by Th2 at the acute and chronic timepoints in the lamina propria and mesenteric lymph node. Quantification of IL17RB+ and Ki67+ cells by each Th2 subset (TCF1 + KLRG1-, TCF1- KLRG1-, and TCF1- KLRG1 + ) in the lamina propria (left) and mesenteric lymph node (right). *p < 0.05, **p < 0.01, ****p < 0.0001. Line denotes median. One-way, two-tailed ANOVA with Holm-Sidak’s correction from multiple comparisons. N = 4. f) UMAP of lymphocytes from Kaneko et al.48 split by experimental condition. Right: DotPlot of key transcript expression by lymphocyte clusters. Th2 cluster highlighted by bracket. g) Percent Foxp3+ Tregs of all GATA3 + CD44 + CD4 + T cells the lung or nose. ****p < 0.0001. Line denotes median. Two-tailed T test. N = 9. h) Representative flow cytometry plots showing depletion of circulating T cells by FTY720 treatment. i) Left: %Ki67 cells of Th2 cells with and without FTY720 treatment. Right: TCF1 MFI among TCF1 + ST2- Th2 progenitor cells with and without FTY720 treatment. ns, not significant. Line denotes median. Two-tailed T test. N = 5.
Extended Data Fig. 4 Th2 progenitor cells are phenotypically distinct from resting and recall resident memory Th2
a) Schematic of chronic, resting memory, and recall models of pulmonary type 2 inflammation. b) Left: representative H&E staining of lungs from indicated conditions. Middle: quantification of mean inflammation score. Right: Quantification of eosinophilic lung infiltrate as %eosinophils of tissue (CD45(IV)- CD45 + ) immune cells and total numbers of eosinophils per lung. *p < 0.05. ns, not significant. c) Quantification of %TCF1 + ST2- cells among Th2 in the indicated conditions. ns, not significant. d) Representative flow cytometry of PD1lo, PD1int, and PD1hi cells in the circulation (left) and lung tissue (middle 3 panels) of indicated conditions. Right: quantification of PD1hi and PD1int cell frequencies of total Th2 cells for indicated conditions. *p < 0.05, **p < 0.01, ns, not significant. e) Representative flow cytometry of CD69 expression by tissue Th2 cells in the indicated conditions. ns, not significant. For all panels: Line denotes median. One-way ANOVA with Holm-Sidak’s correction for multiple comparisons, two-tailed significance. N = 5. Schematic in panel a created with BioRender.com.
Extended Data Fig. 5 Transcriptomic analysis of CD4 + T cells during acute and chronic Alternaria/DerP allergen challenge
a) DotPlot of key lineage defining transcripts for each cluster from Fig. 3a. b) FeaturePlots of key Treg-associated transcripts (left) and TFH-associated transcripts (right) at acute and chronic timepoints. c) Pseudobulk differential expression analysis of Acute Effector 1 cluster cells compared to Chronic Effector 1 (left) and Chronic Effector 2 (right) by DeSEQ2. Vertical dashed line denotes fold change cutoff of 0.5. Horizontal dashed line denotes significance cutoff of 0.01 by False Discovery Rate (FDR).
Extended Data Fig. 6 Pseudobulk differential expression analysis of key Th2 clusters during acute and chronic Alternaria/DerP allergen challenge
Pseudobulk differential expression analysis of acute versus chronic timepoints for a) Progenitor, b) Intermediate, and c) Proliferating clusters. Vertical dashed line denotes fold change cutoff of 0.5. Horizontal dashed line denotes significance cutoff of 0.01 by False Discovery Rate (FDR)
Extended Data Fig. 7 scTCRseq analysis identifies clonal relationships between Th2 subsets
a) Left: UMAP of all cells from acute and chronic timepoints of Alternaria/DerP allergen challenge, colored by degree of clonal expansion. Right: UMAP split by degree of clonal expansion and colored by original cluster colors from Fig. 5a. b) Chao clonal diversity index for each ab T cell cluster. c) Circos plot showing clonal overlap between ab T cell clusters. d) Quantification of clonal expansion indices with Progenitor cells as the root node. *p < 0.05, ***p < 0.0001, ns, not significant. One-sample, two-tailed T test. e) UMAP with individual TCR clones highlighted in black (all other cells light grey), showing clonal expansion between Progenitor and indicated effector cell clusters.
Extended Data Fig. 8 Integrated transcriptomic analysis of CD4 + T cell progenitors in chronic infection and chronic allergy
a) DotPlot of key memory/stemness-associated transcripts for all clusters. b) FeaturePlot of Checkpoint module expression, split by condition (chronic infection vs. chronic allergy). c) Pseudobulk differentiation expression analysis by DeSEQ2 of chronic infection versus chronic allergy for the Progenitor (left) and Progenitor/TFH (right) clusters, displayed as a volcano plot. Vertical dashed line denotes fold change cutoff of 0.5. Horizontal dashed line denotes significance cutoff of 0.01 by False Discovery Rate (FDR). d) Hallmark pathway analysis of differentially expressed transcripts from panel C progenitors with significance p < 0.01. e) Upper left: Split ViolinPlots of Core Memory module score for Progenitor, Progenitor/TFH, and TFH clusters, split by condition (chronic infection vs. chronic allergy). Right: quantification of Core Memory module score for indicated clusters. Lower left: Split ViolinPlots of Interferon module score for Progenitor, Progenitor/TFH, and TFH clusters, split by condition (chronic infection vs. chronic allergy). Lower right: quantification of Interferon module score for indicated clusters. ****p < 0.0001. ns, not significant. Line denotes median. One-way ANOVA with Holm-Sidak’s correction for multiple comparisons, two-tailed significance. N = 3 Chronic Allergy, N = 6 Clone13.
Extended Data Fig. 9 Integrated transcriptomic analysis of Th2 in chronic allergy and resting memory/recall allergy models
a) Left: Integrated UMAP of cells from chronic Alternaria/DerP allergy model (Fig. 3a) and resting memory/recall Aspergillus fumigatus model from Ulrich et al.9. Right: FeaturePlots of key transcripts associated with Th2 memory and effector cells. b) Split Violinplot of Checkpoint module for all clusters. c) Pseudobulk differentiation expression analysis by DeSEQ2 of chronic allergy versus memory/recall for the indicated clusters, displayed as a volcano plot. Vertical dashed line denotes fold change cutoff of 0.5. Horizontal dashed line denotes significance cutoff of 0.01 by False Discovery Rate (FDR). d) Split Violinplots of Core Memory module and Resting module, with associated quantification. ****p < 0.0001, ns, not significant. Line denotes median. One-way ANOVA with Holm-Sidak’s correction for multiple comparisons, two-tailed significance. N = 3 Chronic, N = 3 Recall.
Extended Data Fig. 10 Additional analyses of whole lung scRNAseq and spatial transcriptomics datasets
a) DotPlot of all statistically significant cell-cell interactions identified for each “sender” cluster with the “target” cluster set to Th2 progenitors. Dots are colored by increasing interaction probability and ordered by adjusted p value.s. b) 10X magnification images of H&E-stained lung tissue sections from acute or chronic allergen challenge with Alternaria/DerP as in Fig. 1a, with ectopic lymphoid structure highlighted at the chronic timepoint. N = 5 Acute, N = 8 Chronic. c) DotPlot of domain-defining transcripts from spatial transcriptomics analysis of acute (upper) or chronic (lower) lung tissue sections. d) ViolinPlot of Cxcr4 expression by chronic T cell clusters from Fig. 5a scRNAseq.
Supplementary information
Reporting Summary (download PDF )
Peer Review File (download PDF )
Supplementary Tables 1–14. (download ZIP )
Rights and permissions
Open Access This article is licensed under a Creative Commons Attribution-NonCommercial-NoDerivatives 4.0 International License, which permits any non-commercial use, sharing, distribution and reproduction in any medium or format, as long as you give appropriate credit to the original author(s) and the source, provide a link to the Creative Commons licence, and indicate if you modified the licensed material. You do not have permission under this licence to share adapted material derived from this article or parts of it. The images or other third party material in this article are included in the article’s Creative Commons licence, unless indicated otherwise in a credit line to the material. If material is not included in the article’s Creative Commons licence and your intended use is not permitted by statutory regulation or exceeds the permitted use, you will need to obtain permission directly from the copyright holder. To view a copy of this licence, visit http://creativecommons.org/licenses/by-nc-nd/4.0/.
About this article
Cite this article
Kratchmarov, R., Jia, X., Nagai, J. et al. Progenitor T cells drive chronic pulmonary type 2 inflammation.
Nat Immunol (2026). https://doi.org/10.1038/s41590-026-02619-y
Received:16 August 2025
Accepted:13 July 2026
Published:20 August 2026
Version of record:20 August 2026
DOI
:https://doi.org/10.1038/s41590-026-02619-y
