


Abstract
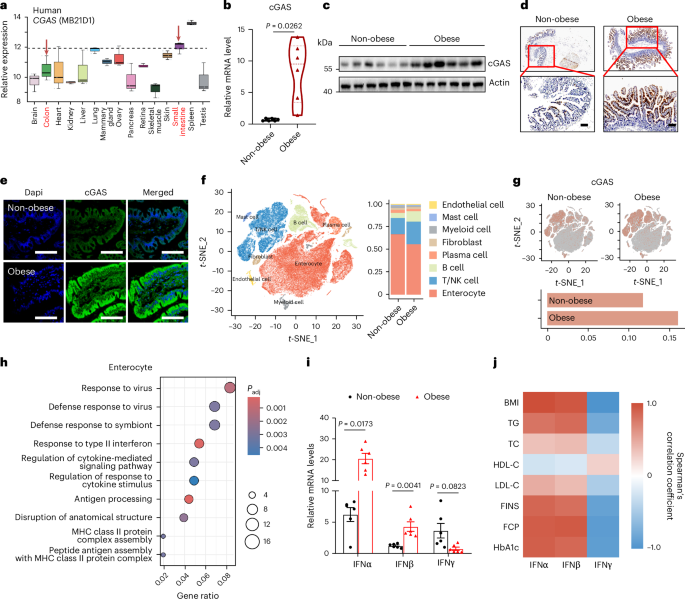
The gut constantly interacts with both pathogens and dietary signals, but how it balances immune and metabolic responses remains unclear. Here we show that intestinal cGAS, a key DNA sensor, acts as a regulator linking gut immunity to whole-body metabolism. We show that cGAS signalling is activated in the intestines of humans and male mice with obesity, leading to increased type I interferon production and heightened immune activity in intestinal cells. Strikingly, deleting cGAS specifically in intestinal epithelial cells enhances energy expenditure, protects against diet-induced obesity and improves metabolic health. These effects depend on the gut microbiota, particularly Lactobacillus murinus and its metabolite indole-3-acetic acid (IAA), which promotes adipose thermogenesis. Our findings position intestinal cGAS as a key driver of obesity through gut-to-fat signalling and suggest that targeting the intestinal cGAS–microbiota IAA axis could offer promising strategies to combat obesity and related metabolic diseases.
This is a preview of subscription content, access
Access options
Access through your institution
- Purchase on SpringerLink
- Instant access to the full article PDF.
39,95 €
Prices may be subject to local taxes which are calculated during checkout
Subjects
- Ileum
- Metabolism
- Microbiota
Data availability
Intestinal cell scRNA-seq data and a minimal dataset supporting the findings of this study are available at the NCBI Bioproject page under accession no. PRJNA1298510. The metagenomic sequencing data can also be accessed at the NCBI Bioproject page under accession no. PRJNA1303042. Data associated with this study are presented in the main text, figures, supplementary information and source data files. The online version contains supplementary material and source data available at https://doi.org/10.6084/m9.figshare.30277207.v9 (ref. 39). Owing to patient privacy regulations, individual-level clinical data cannot be shared publicly. However, de-identified aggregate data are provided. Researchers interested in accessing additional data may contact the corresponding authors for further details. Source data are provided with this paper.
Code availability
This paper does not include any custom code
References
Zhang, J. et al. A two-front nutrient supply environment fuels small intestinal physiology through differential regulation of nutrient absorption and host defense. Cell187, 6251–6271.e20 (2024)
Khan, S., Luck, H., Winer, S. & Winer, D. A. Emerging concepts in intestinal immune control of obesity-related metabolic disease. Nat. Commun.12, 2598 (2021)
Agus, A., Clement, K. & Sokol, H. Gut microbiota-derived metabolites as central regulators in metabolic disorders. Gut70, 1174–1182 (2021)
Zhang, Y. J. et al. Impacts of gut bacteria on human health and diseases. Int. J. Mol. Sci.16, 7493–7519 (2015)
Crovesy, L., Masterson, D. & Rosado, E. L. Profile of the gut microbiota of adults with obesity: a systematic review. Eur. J. Clin. Nutr.74, 1251–1262 (2020)
Li, T. & Chen, Z. J. The cGAS–cGAMP–STING pathway connects DNA damage to inflammation, senescence, and cancer. J. Exp. Med.215, 1287–1299 (2018)
Bai, J. & Liu, F. The cGAS–cGAMP–STING pathway: a molecular link between immunity and metabolism. Diabetes68, 1099–1108 (2019)
Bai, J. & Liu, F. cGAS–STING signaling and function in metabolism and kidney diseases. J. Mol. Cell. Biol.13, 728–738 (2021)
Gao, H. et al. Accumulation of microbial DNAs promotes to islet inflammation and β cell abnormalities in obesity in mice. Nat. Commun.13, 565 (2022)
Bai, J. et al. Mitochondrial stress-activated cGAS–STING pathway inhibits thermogenic program and contributes to overnutrition-induced obesity in mice. Commun. Biol.3, 257 (2020)
Erttmann, S. F. et al. The gut microbiota prime systemic antiviral immunity
Bai, J. et al. DsbA-L prevents obesity-induced inflammation and insulin resistance by suppressing the mtDNA release-activated cGAS–cGAMP–STING pathway. Proc. Natl Acad. Sci. USA114, 12196–12201 (2017)
Cai, Z. et al. cGAS suppresses β-cell proliferation by a STING-independent but CEBP β-dependent mechanism. Metabolism157, 155933 (2024)
Qiao, J. et al. A distinct role of STING in regulating glucose homeostasis through insulin sensitivity and insulin secretion. Proc. Natl Acad. Sci. USA119, 2101848119 (2021)
Xiao, H. & Kang, S. The role of the gut microbiome in energy balance with a focus on the gut–adipose tissue axis. Front. Genet.11, 297 (2020)
Gao, K., Mu, C. L., Farzi, A. & Zhu, W. Y. Tryptophan metabolism: a link between the gut microbiota and brain. Adv. Nutr.11, 709–723 (2020)
Judkins, T. C., Archer, D. L., Kramer, D. C. & Solch, R. J. Probiotics, nutrition, and the small intestine. Curr. Gastroenterol. Rep.22, 2 (2020)
Santaolalla, R., Fukata, M. & Abreu, M. T. Innate immunity in the small intestine. Curr. Opin. Gastroenterol.27, 125–131 (2011)
Luo, X. et al. Expression of STING is increased in liver tissues from patients with NAFLD and promotes macrophage-mediated hepatic inflammation and fibrosis in mice. Gastroenterology155, 1971–1984.e4 (2018)
Yu, Y. et al. STING-mediated inflammation in Kupffer cells contributes to progression of nonalcoholic steatohepatitis. J. Clin. Invest.129, 546–555 (2019)
Qiao, J. T. et al. Activation of the STING–IRF3 pathway promotes hepatocyte inflammation, apoptosis and induces metabolic disorders in nonalcoholic fatty liver disease. Metabolism81, 13–24 (2018)
Nikkanen, J. et al. An evolutionary trade-off between host immunity and metabolism drives fatty liver in male mice. Science378, 290–295 (2022)
Wang, A., Luan, H. H. & Medzhitov, R. An evolutionary perspective on immunometabolism. Science636, eaar3932 (2019)
Liu, J., Huang, Q. & Liu, F. The immuno-metabolic trade-off: a driver of metabolic disorders and aging. Sci. China Life Sci.68, 2162–2165 (2025)
Sonnenburg, J. L. & Backhed, F. Diet–microbiota interactions as moderators of human metabolism. Nature535, 56–64 (2016)
Gomes, A. C., Hoffmann, C. & Mota, J. F. The human gut microbiota: metabolism and perspective in obesity. Gut Microbes9, 308–325 (2018)
Shelton, C. D. et al. An early-life microbiota metabolite protects against obesity by regulating intestinal lipid metabolism. Cell Host Microbe31, 1604–1619.e10 (2023)
Tintelnot, J. et al. Microbiota-derived 3-IAA influences chemotherapy efficacy in pancreatic cancer. Nature615, 168–174 (2023)
Wang, Y. et al. Role of indole-3-acetic acid in NAFLD amelioration after sleeve gastrectomy. Obes. Surg.31, 3040–3052 (2021)
Ji, Y., Gao, Y., Chen, H., Yin, Y. & Zhang, W. Indole-3-acetic acid alle of hepatic lipogenesis, and oxidative and inflammatory stress. Nutrients11, 2062 (2019)
Liu, Y. et al. Gut microbiome alterations in high-fat-diet-fed mice are associated with antibiotic tolerance. Nat. Microbiol.6, 874–884 (2021)
Canesso, M. C. C. et al. The cytosolic sensor STING is required for intestinal homeostasis and control of inflammation. Mucosal Immunol.11, 820–834 (2018)
Shmuel-Galia, L. et al. Dysbiosis exacerbates colitis by promoting ubiquitination and accumulation of the innate immune adaptor STING in myeloid cells. Immunity54, 1137–1153.e8 (2021)
Martin, G. R., Blomquist, C. M., Henare, K. L. & Jirik, F. R. Stimulator of interferon genes (STING) activation exacerbates experimental colitis in mice. Sci. Rep.9, 14281 (2019)
Hu, Q. et al. STING-mediated intestinal barrier dysfunction contributes to lethal sepsis. eBioMedicine41, 497–508 (2019)
Luan, H. H. et al. GDF15 is an inflammation-induced central mediator of tissue tolerance. Cell178, 1231–1244.e11 (2019)
Martin, M. D., Sompallae, R., Winborn, C. S., Harty, J. T. & Badovinac, V. P. Diverse CD8 T cell responses to viral infection revealed by the collaborative cross. Cell Rep.31, 107508 (2020)
Gallais Serezal, I. et al. A skewed pool of resident T cells triggers psoriasis-associated tissue responses in never-lesional skin from patients with psoriasis. J. Allergy Clin. Immunol.143, 1444–1454 (2019)
Deng, J. Intestinal cGAS-STING-IFN signaling promotes obesity by downregulating microbiota-derived IAA in male mice. figsharehttps://doi.org/10.6084/m9.figshare.30277207.v9 (2025)
Acknowledgements
We thank B. Juli (Department of Cell Systems & Anatomy, University of Texas Health Science Center), W. Zheng (College of Bioscience & Biotechnology of Hunan Agricultural University), I. X. Wu and G. Yinyan (Department of Epidemiology and Health Statistics, Xiangya School of Public Health, Central South University) and L. Qing (Department of Clinical Pharmacology, Xiangya Hospital, Central South University) and express our sincere gratitude for their generous support
Funding
This work was partially supported by grant no. 82330025 from the National Nature Science Foundation of China; 2023ZD0507300 from the Noncommunicable Chronic Diseases–National Science and Technology Major Project; 82370858 from the National Nature Science Foundation of China; and 2023JJ10090, 2024JJ3039 and 2025JJ50705 from the Natural Science Foundation of Hunan Province
Author information
Author notes
These authors contributed equally: Jiangming Deng, Wen Meng
Authors and Affiliations
Furong Laboratory, Changsha, China
Jiangming Deng, Wen Meng, Yuanqin Yang, Jing Wang, Qing-xin Li, Lingxiang Xie, Jingyi Hu, Rong Song, Yibo Hu, Feng Liu & Yang Xiao
National Clinical Research Center for Endocrine and Metabolic Diseases, Changsha, China
Jiangming Deng, Wen Meng, Yuanqin Yang, Jing Wang, Qing-xin Li, Lingxiang Xie, Jingyi Hu, Rong Song, Yibo Hu, Feng Liu & Yang Xiao
The Metabolic Syndrome Research Center, The Second Xiangya Hospital of Central South University, Changsha, China
Jiangming Deng, Wen Meng, Yuanqin Yang, Ting Xiao, Zhangliu Jin, Jing Wang, Qing-xin Li, Feng Liu & Yang Xiao
Department of Metabolism and Endocrinology, The Second Xiangya Hospital of Central South University, Changsha, China
Jiangming Deng, Yuanqin Yang, Lingxiang Xie, Jingyi Hu, Rong Song, Yibo Hu & Yang Xiao
Department of Oncology, The Second Xiangya Hospital of Central South University, Changsha, China
Wen Meng
Department of Hepatology, Hunan Children’s Hospital, Changsha, China
Ting Xiao
Departments of Biliopancreatic Surgery and Bariatric Surgery, The Second Xiangya Hospital of Central South University, Changsha, China
Zhangliu Jin
Department of Gastroenterology, The Second Xiangya Hospital of Central South University, Changsha, China
Yi Chu
Department of Clinical Pharmacology, Xiangya Hospital, Central South University, Changsha, P. R. China
Qing Li
Department of Endocrinology, The Third Xiangya Hospital of Central South University, Changsha, China
Ping Jin
College of Bioscience & Biotechnology of Hunan Agricultural University, Changsha, China
Zheng Wang
Department of Epidemiology and Health Statistics, Xiangya School of Public Health, Central South University, Changsha, China
Irene XY Wu
Authors
- Jiangming DengView author publications
Search author on:PubMed Google Scholar
- Wen MengView author publications
Search author on:PubMed Google Scholar
- Yuanqin YangView author publications
Search author on:PubMed Google Scholar
- Ting XiaoView author publications
Search author on:PubMed Google Scholar
- Zhangliu JinView author publications
Search author on:PubMed Google Scholar
- Jing WangView author publications
Search author on:PubMed Google Scholar
- Qing-xin LiView author publications
Search author on:PubMed Google Scholar
- Lingxiang XieView author publications
Search author on:PubMed Google Scholar
- Jingyi HuView author publications
Search author on:PubMed Google Scholar
- Rong SongView author publications
Search author on:PubMed Google Scholar
- Yibo HuView author publications
Search author on:PubMed Google Scholar
- Yi ChuView author publications
Search author on:PubMed Google Scholar
- Qing LiView author publications
Search author on:PubMed Google Scholar
- Ping JinView author publications
Search author on:PubMed Google Scholar
- Zheng WangView author publications
Search author on:PubMed Google Scholar
- Irene XY WuView author publications
Search author on:PubMed Google Scholar
- Feng LiuView author publications
Search author on:PubMed Google Scholar
- Yang XiaoView author publications
Search author on:PubMed Google Scholar
Contributions
J.D., W.M., Y.Y., T.X., Z.J., J.W., Q.-x.L., L.X., J.H., R.S., Y.H., Y.C., Q.L., P.J. and Z.W. performed experiments, obtained data and analysed results. W.M., J.D. and F.L. participated in the writing and revision of the paper. W.M., Y.X. and F.L. contributed to conceptualization and investigation of the study. F.L. and Y.X. were in charge of the overall content as guarantors. I.XY.W. was responsible for statistical analysis
Ethics declarations
Competing interests
The authors declare no competing interests
Peer review
Peer review information
Nature Metabolism thanks Amir Zarrinpar, Elena Rampanelli and the other, anonymous, reviewer(s) for their contribution to the peer review of this work. Primary Handling Editor: Revati Dewal, in collaboration with the Nature Metabolism team
Additional information
Publisher’s note Springer Nature remains neutral with regard to jurisdictional claims in published maps and institutional affiliations
Extended data
Extended Data Fig. 1 Intestinal cGAS is activated in humans and mice with obesity
a-b, Western blot analysis of cGAS in ileum (a), colon (b) of C57BL/6 male mice fed a normal diet (ND) and HFD (1 technical replicate of 6 biological replicates per group). c-f, Intestinal samples were collected from Cohort 1, then measured and analyzed (1 technical replicate of 6 biological replicates per group). c, Bioinformatics analysis of scRNA-seq of human samples from ileal biopsies of male individuals. d, tSNE of the intestinal epithelial cell sub-groups in human samples from ileal biopsies of male individuals. e, Bioinformatics analysis of scRNA-seq of human samples from ileal biopsies of female individuals. f, tSNE of the intestinal epithelial cell sub-groups in human samples from ileal biopsies of female individuals. g, Functional enrichment analysis (GO database) of differentially expressed genes (immune related) in the intestinal epithelial cell from male ileal biopsies. h, Functional enrichment analysis (GO database) of differentially expressed genes (immune related) in the intestinal epithelial cell from female ileal biopsies. One-sided hypergeometric tests were performed, followed by Benjamini-Hochberg (BH) correction for controlling the false discovery rate (g-h).
Source data
Extended Data Fig. 2 Intestinal epithelial cell-specific cGAS deficiency does not alter metabolic phenotype under normal diet (ND) condition
a-b, Western blot analysis of cGAS expression in intestinal epithelial cell (a) (1 technical replicate of 6 biological replicates per group). and tissues (b) from 8-weeks-old cGasIKO (K) and Loxp (L) male mice (A representative image is shown from n = 3 biological replicates per group). c-k, cGasIKO and Loxp male mice were fed with ND for 12 weeks. Metabolic parameters, including body weight and blood glucose, were quantitatively analyzed at the study endpoint (20 weeks of age), corresponding to the terminal time point for HFD-fed mice (1 technical replicate of 4 biological replicates per group). c-d, Body weight (c) and food consumption (d) of cGasIKO and Loxp male mice fed with ND. e-f, Glucose tolerance tests (e) and insulin tolerance tests (f) of ND-fed cGasIKO and Loxp control male mice. g-h, Alpha diversity (Ace, Chao, Shannon index) (g) and beta-diversity (h) of fecal bacteria of cGasIKO and Loxp male mice. i, Fecal Lactobacillus_murinus abundance (centered log-ratio, CLR) of ND-fed cGasIKO and Loxp male mice. j-k, Rectal temperature (j) and energy expenditure (k) of ND-fed cGasIKO and Loxp male mice. For box plots, the midline represents the median; box represents the interquartile range (IQR) between the first and third quartiles, and whiskers represent the lowest or highest values within 1.5 times IQR from the first or third quartiles (g). Data represent mean ± SEM. Statistical analysis was performed with unpaired Student’s t test (c, g, i-k), and Two-way ANOVA followed by Sidak-adjusted multiple comparisons test (d-f), with all tests being two-sided. PERMANOVA (Adonis test) was performed to assess statistical significance between groups (h).
Source data
Extended Data Fig. 3 Intestinal epithelial cell-specific cGAS deficiency does not alter appetite, absorption and daily activity
cGasIKO and Loxp male mice were fed with a HFD for 12 weeks, and then measured (1 technical replicate of 6 biological replicates per group). a-b, Food intake (a) and Cumulative food intake (b) of cGasIKO and Loxp male mice. c-d, Fecal output (c) and energy content (d) of stool. e, Daily spontaneous physical activity. f-k, Measurement of Triglyceride (TG) (f), Non-esterified fatty acid (NEFA) (g), cholesterol (CHOL) (h), total bile acid (TBA) (i), high-density lipoproteins (HDL-CH) (j) and low-density lipoproteins (LDL-CH) (k) in serum of HFD-fed cGasIKO and Loxp male mice. Data represent mean ± SEM. Statistical analysis was performed unpaired Student’s t test (b-k), and Two-way ANOVA followed by Sidak-adjusted multiple comparisons test (a), with all tests being two-sided.
Source data
Extended Data Fig. 4 The gut microbiota mediates beneficial effects in cGasIKO mice
a-d, The antibiotic-pretreated male mice were fed HFD for 12 weeks, and then measured (1 technical replicate of 6 biological replicates per group). a-b, Body weight (a) and organ weight (b) of antibiotic-treated and HFD fed Loxp and cGasIKO male mice. c-d, GTT (c) and ITT (d) of male mice, e-g, HFD-fed mice underwent fecal microbiota transplantation (FMT) from HFD-fed cGasIKO donors or Loxp mice, and then measured (1 technical replicate of 6 biological replicates per group). e-f, β-diversity (e) of the gut microbiota and fecal composition (f) between the HFD-fed cGasIKO, Loxp group and their fecal recipient male mice. g, The abundance of lactobacillus_murinus in the feces of fecal recipient male mice. For box plots, the midline represents the median; box represents the interquartile range (IQR) between the first and third quartiles, and whiskers represent the lowest or highest values within 1.5 times IQR from the first or third quartiles(e). Data represent mean ± SEM. Statistical analysis was performed with unpaired two-sided Student’s t test(a, b, g), PERMANOVA (ADONIS test) was performed to assess statistical significance between groups(e), and Two-way ANOVA followed by two-sided Sidak-adjusted multiple comparisons test (c-e).
Source data
Extended Data Fig. 5 Intestinal epithelia cell-specific cGAS deficiency increases the Lactobacillus abundance in cecal contents
The Loxp and cGasIKO male mice were fed with a HFD for 12 weeks, and then measured (1 technical replicate of 6 biological replicates per group). a-b, Alpha-diversity (a) and β-diversity (b) of the gut microbiota in caecum between the HFD fed cGasIKO and Loxp male mice group. c, The Lactobacillus abundance in cecal contents of male mice. For box plots, the midline represents the median; box represents the interquartile range (IQR) between the first and third quartiles, and whiskers represent the lowest or highest values within 1.5 times IQR from the first or third quartiles(a). Data represent mean ± SEM. Statistical analysis was performed with unpaired two-sided Student’s t test (a, c). PERMANOVA (ADONIS test) was performed to assess statistical significance between groups (b).
Source data
Extended Data Fig. 6 The short chain fatty acid and bile acid profile in cGASIKO male mice
The Loxp and cGasIKO male mice were fed with a HFD for 12 weeks, and then measured (1 technical replicate of 6 biological replicates per group). a, Orthogonal projection to latent structure-discriminant analysis (OPLS-DA) scores of fecal metabolites of cGasIKO and Loxp male mice. b, Volcano plot of Metabonomic analysis of feces of cGasIKO and Loxp male mice. Abundances (percent reads) of the short chain fatty acid (c) and bile acid (d) in feces of Loxp and cGasIKO male mice (a-d, 1 technical replicate of 6 biological replicates per group). e-f, IAA concentration in feces (e) and serum (f) of HFD-fed FMT- cGasIKO and FMT-Loxp male. Model validity was confirmed by permutation testing (200 permutations, P < 0.05) and CV-ANOVA (a). Differential abundance analysis was conducted using two-sided Mann-Whitney U test, with Benjamini-Hochberg FDR correction(b), FDR-adjusted p < 0.05. Data represent mean ± SEM. Statistical analysis was performed with unpaired two-sided Student’s t test (c-f).
Source data
Extended Data Fig. 7 Intestinal epithelia cell-specific cGAS deficiency promotes Lactobacillus murinus/IAA-mediated adipose thermogenesis through a reduction in intestinal type I interferon levels
a, Western blot analysis of cGAS, STING and their downstream signaling proteins in colon of HFD-fed cGasIKO and Loxp male mice were determined by Western blot (1 technical replicate of 6 biological replicates per group). b, The relative mRNA levels of IFN-α and IFN-β in colon of HFD-fed cGasIKO and Loxp male mice (1 technical replicates of 6 biological replicates per group). c-g, IFN-α concentrations in the serum (c), cecal contents (d), BAT (e), sWAT (f) and Liver (g) of Loxp and cGasIKO male mice fed a HFD (3 technical replicates of 6 biological replicates per group). h, IFN-β concentrations in Liver of HFD-fed Loxp and cGasIKO male mice (3 technical replicates of 6 biological replicates per group). i-j, Scatter plot showing the correlation between Type 1 interferon (intestinal tissue) (i) and Lactobacillus (feces) (j) of human subjects (Cohort 1, 1 technical replicate of 6 biological replicates for Non-Obese group and 6 biological replicates for Obese group). k-l, IFN-α concentrations in the feces (k) and serum (l) of Loxp and cGasIKO male mice treated with IFN-α or vehicle (3 technical replicates of 3 biological replicates per group). a-h, k-l, The male mice were HFD fed for 12 weeks. Data represent mean ± SEM. Statistical analysis was performed with unpaired two-sided Student’s t test (b-h), and one-way ANOVA with Tukey’s post hoc test (k, l). Data are presented as means; error bars, SEM, two-sided Spearman’s correlation analyses were perfomed (i-j). For visualization purpose, the relative abundances of Lactobacillus were log10-transformed.
Source data
Extended Data Fig. 8 Indole-3-acetic acid (IAA) directly targets adipocytes to promote thermogenesis and combat obesity
a-c, Loxp and cGasIKO male mice were fed with a HFD for 12 weeks first, treated with intragastric administration of vehicle (Cyclodextrin) or IAA (1 mg/kg, IAA-ig) and then measured (1 technical replicate of 6 biological replicates per group). a-c, Body weight (a), organ weight (b) and food intake of Loxp and cGasIKO male mice. d-m, Loxp and cGasIKO male mice were fed with a HFD for 12 weeks first, treated with vehicle (Cyclodextrin) or IAA (100 μg/kg, IAA-I.V.) twice a week by intravenous administration for 6 weeks and then measured (1 technical replicate of 6 biological replicates per group). d, Body weight of HFD fed male mice during IAA treatment(1 technical replicate of 6 biological replicates per group). e, Representative photos of fat tissues and liver derived from vehicle or IAA-I.V. male mice. f, Weights of fat tissues and liver of vehicle or IAA-I.V. male mice. g, Representative images of HE staining of sWAT, BAT, and liver sections from vehicle or IAA-I.V. male mice (A representative image is shown from n = 3 biological replicates per group; scale bar: 100 μm). h-i, Oil Red O staining (A representative image is shown from n = 3 biological replicates per group; scale bar: 100 μm) (h) and hepatic triglyceride (TG) (i) of vehicle or IAA-I.V. male mice (1 technical replicate of 6 biological replicates per group). j-k, Glucose tolerance test (j) and insulin tolerance test (k) of vehicle (Cyclodextrin) or IAA-I.V. male mice (1 technical replicate of 6 biological replicates per group). l-m, Western blot analysis of UCP1 in sWAT (l) and BAT (m) of vehicle or IAA-I.V. male mice (1 technical replicate of 6 biological replicates per group). Data represent mean ± SEM. Statistical analysis was performed with unpaired Student’s ttest (f, i), and Two-way ANOVA followed by Sidak-adjusted multiple comparisons test (a-d, j-k), with all tests being two-sided.
Source data
Supplementary information
Supplementary Information (download PDF )
Supplementary Tables 1 and 2
Reporting Summary (download PDF )
Supplementary Data
MS chromatogram of tryptophan metabolites
Source data
Source Data Fig. 1 (download XLSX )
Statistical
Source Data Fig. 2 (download XLSX )
Statistical
Source Data Fig. 3 (download XLSX )
Statistical
Source Data Fig. 4 (download XLSX )
Statistical
Source Data Fig. 5 (download XLSX )
Statistical
Source Data Fig. 6 (download XLSX )
Statistical
Source Data Fig. 7 (download XLSX )
Statistical
Source Data Fig. 8 (download XLSX )
Statistical
Source Data Extended Data Fig. 2 (download XLSX )
Statistical
Source Data Extended Data Fig. 3 (download XLSX )
Statistical
Source Data Extended Data Fig. 4 (download XLSX )
Statistical
Source Data Extended Data Fig. 5 (download XLSX )
Statistical
Source Data Extended Data Fig. 6 (download XLSX )
Statistical
Source Data Extended Data Fig. 7 (download XLSX )
Statistical
Source Data Extended Data Fig. 8 (download XLSX )
Statistical
Fig. 1-image (download PDF )
Unprocessed western blots
Fig. 2-image (download PDF )
Unprocessed western blots
Fig. 3-image (download PDF )
Unprocessed western blots
Fig. 4-image (download PDF )
Unprocessed western blots
Fig. 7-image (download PDF )
Unprocessed western blots
Fig. 8-image (download PDF )
Unprocessed western blots
Extended Data Fig. 1-image (download PDF )
Unprocessed western blots
Extended Data Fig. 2-image (download PDF )
Unprocessed western blots
Extended Data Fig. 7-image (download PDF )
Unprocessed western blots
Extended Data Fig. 8-image (download PDF )
Unprocessed western blots
Rights and permissions
Springer Nature or its licensor (e.g. a society or other partner) holds exclusive rights to this article under a publishing agreement with the author(s) or other rightsholder(s); author self-archiving of the accepted manuscript version of this article is solely governed by the terms of such publishing agreement and applicable law
About this article
Cite this article
Deng, J., Meng, W., Yang, Y. et al. Intestinal cGAS–STING–IFN signalling promotes obesity by downregulating microbiota-derived IAA in male mice.
Nat Metab8, 1713–1729 (2026). https://doi.org/10.1038/s42255-026-01562-4
Received:18 July 2024
Accepted:05 June 2026
Published:19 August 2026
Version of record:19 August 2026
Issue date:August 2026
DOI
:https://doi.org/10.1038/s42255-026-01562-4
