


Download PDF
Abstract
The regulatory mechanism of leptin’s afferent action in the brain is contingent upon the efferent sympathetic innervation of white and brown adipose tissues. Nonetheless, the peripheral regulation governing the afferent–efferent balance remains ambiguous. Here we show the enriched expression of both leptin receptor (Lepr) and β2-adrenergic receptor (Adrb2) in perineurial cells that form a barrier around sympathetic ganglia and nerve bundles in adipose tissues, using single-cell RNA sequencing on mouse sympathetic ganglia. Lepr+ sympathetic perineurial cells (SPCs) are molecularly similar to endothelial cells. Conditional knockout of Adrb2 in Lepr+ cells, including SPCs, predisposes male mice to obesity by lowering energy expenditure and thermogenesis without affecting food intake. Notably, obesity-associated hyperleptinaemia causes apoptosis in SPCs, disrupting the perineurial barrier and concomitant adipose sympathetic neuropathy. This deleterious effect can be reversed by partial reduction of leptin or sympathomimetic β2-adrenergic receptor agonism. Clinically, we observed a male-specific synergistic effect of LEPR and ADRB2 polymorphisms on increased body mass index risk in a large European population. We propose that SPCs coordinate the afferent and efferent arms of the neuroendocrine loop of leptin action to regulate energy expenditure and body weight.
Leptin regulates body weight via a neuroendocrine negative feedback loop. The hormone leptin is the afferent signal released from white adipocytes, in proportion to fat reserves, and acts on hypothalamic neurons to suppress food intake and activate proportional descending efferent sympathetic activity that triggers lipolysis in white adipose tissue (WAT)1 and thermogenesis in brown adipose tissue (BAT)2,3,4. The efferent arm reduces mass via noradrenergic signalling, which in turn reduces leptin levels, thereby closing the loop. However, the cellular and molecular mechanisms regulating the balance between afferent leptin and efferent sympathetic outflow are unknown. Here, we identified the sympathetic perineurium as a key player in the neuroendocrine loop of leptin action, regulating the balance between the afferent and efferent arms to control body weight. Sympathetic perineurial cells (SPCs) show enriched expression of both the leptin receptor (Lepr) and beta-2 adrenoceptor (Adrb2), enabling them to sense the balance of the afferent and efferent arms in the neuroendocrine loop of leptin action. High levels of leptin drive apoptosis of SPCs, which can be prevented by sympathomimetic β2-adrenergic receptor agonism. The strength of leptin’s efferent sympathetic output is determined by the apoptosis of SPCs and the integrity of the perineurial barrier, which has been shown to have a neuroprotective role5. This working model could explain why humans with common polymorphisms of both LEPR and ADRB2 have a higher risk of developing obesity and provide a peripheral mechanistic model for the leptin-regulated energy balance beyond the central appetite regulation.
Results
scRNA-seq of sympathetic ganglia reveals a cluster of endothelial cells highly expressing the leptin receptor
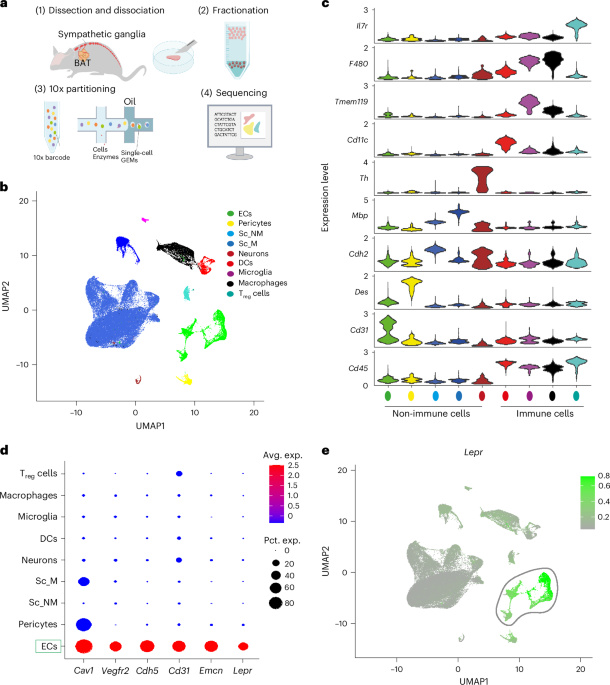
To map the heterogeneity of non-neuronal cell types resident in sympathetic ganglia and their plasticity in response to obesity, we performed single-cell RNA sequencing (scRNA-seq) on isolated superior cervical ganglia (SCG) and stellate ganglia from male C57BL/6 mice fed either a chow diet or a high-fat diet (HFD) for 12 weeks. As expected, the HFD-fed mice gained substantially more weight compared with the chow-fed mice (Extended Data Fig. 1a). For each condition, we pooled SCG or stellate ganglia from lean and obese mice before scRNA-seq, and the four datasets were integrated for analysis (Fig. 1a). After low-quality filtering of the scRNA-seq data, we considered a total of 73,042 single cells. After data integration, we performed principal component analysis and dimensionality reduction with uniform manifold approximation and projection (UMAP) in the integrated dataset6. Using unsupervised clustering, we detected nine distinct clusters of immune and non-immune cells (Fig. 1b). Each cluster contained cells from each ganglia type, feeding condition and sample batch, indicating that the transcriptional identities of these cell clusters are stable irrespective of experimental conditions (Extended Data Fig. 1b,c). An immune cell marker (Cd45) was expressed in all immune cell populations and absent in non-immune cell populations (Fig. 1c). Using expression patterns of cell-type-specific marker genes, we assigned a single identity to each cluster: endothelial cells (Cd31+), pericytes (Des+), non-myelinating Schwann cells (Cdh2+), myelinating Schwann cells (Mbp+), neurons (Th+), dendritic cells (Cd11c+), microglia (Tmem11+), macrophages (F480+) and regulatory T cells (Il17r+; Fig. 1c). Overall, 74% of the single-cell transcriptomes were assigned to glial cells, 10.6% to endothelial cells, 2.1% to pericytes, 0.6% to neurons and 12.7% to immune cell types (Extended Data Fig. 1d).
a, Schematic workflow of scRNA-seq of mouse sympathetic ganglia. b, UMAP plot of all 73,042 cells from mouse superior cervical and stellate ganglia. c, Violin plots showing the expression of cell-type-specific marker genes. The y axis indicates the log-normalized gene expression value, and the width indicates the number of cells expressing the particular gene. d, Dot plot showing the expression of endothelial markers (Cav1, Vegfr2, Cdh5, Cd31, Emcn) and leptin receptor (Lepr) in the endothelial cell population. The size of the dot corresponds to the percentage of cells expressing the gene in each cluster, and the colour represents the average gene expression level. e, Feature plot showing the expression of Lepr in the endothelial cluster. For visualization, denoised expression data were used (c and e). DC, dendritic cell; EC, endothelial cell; GEMs, gel beads in emulsion; Sc_NM, Schwann cell_non myelinating; Sc_M, Schwann cell_myelinating; Treg cell, regulatory T cell; avg., average; exp., expression; pct., percentage.
Source data
The endothelial cell cluster exhibited elevated expression of Cav1, Vegfr2, Cdh5, Emcn, Cldn5 and Egfl7 that were previously reported to be highly expressed in vascular endothelial cells7,8,9 (Fig. 1d). In contrast, we observed very low expression of lymphatic endothelial cell markers (Lyve1, Prox1) in the endothelial cell cluster8,10 (Extended Data Fig. 2a). Notably, we detected especially high expression of the leptin receptor (Lepr) gene in the endothelial cell population (average log2(fold change) (FC) = 1.96, percentage of endothelial cells expressing Lepr = 71%, percentage of all other cells expressing Lepr = 0.3%, P < 2.2 × 10⁻¹⁶; Fig. 1d,e). Quantification of Lepr+ endothelial cell population revealed that 50.6% of endothelial cells are Lepr+Cav1+ (Extended Data Fig. 2b,c), 37.8% of endothelial cells are Lepr+Vegfr2+ (Extended Data Fig. 2d,f) and 47.2% of endothelial cells are Lepr+Cdh5+ (Extended Data Fig. 2e,g). To visualize the sympathetic endothelial cells that expressed the leptin receptor, we performed immunofluorescence of SCG and sympathetic nerve bundles dissected from the subcutaneous white adipose tissue (scWAT) and BAT of LeprCre; Rosa26−Lox-Stop-Lox-ChR2-YFP reporter (LeprCre; LSL-YFP) mice. In LeprCre; LSL-YFP mice, cre expression follows an IRES sequence downstream of the long form of the leptin receptor11, and the Cre-mediated recombination results in expression of membrane-bound YFP. Double staining of CAV1, VEGFR2 or CDH5 with YFP in the SCG and sympathetic nerve bundles revealed that YFP is co-expressed with endothelial cells positive for CAV1 (Extended Data Fig. 3a–c), VEGFR2 (Extended Data Fig. 3d,e) and CDH5 (Extended Data Fig. 3f,g) forming a thin layer surrounding the tyrosine hydroxylase-positive (TH+) sympathetic neurons.
LEPR+ sympathetic endothelial cells constitute the perineurial barrier
The sheath-like structure formed by the LEPR+ endothelial cells resembles the perineurial barrier, which was once described as epithelial12. Interestingly, the scRNA-seq dataset reveals that the Lepr+ endothelial cell population also highly transcribes Glut1, Itgb4, Lypd2, Mpzl2 and Cldn1 (Fig. 2a), which have been reported as perineurial marker genes in the sciatic nerve single-cell atlas8,13. Among the perineurial markers, Glut1, which has been reported as a pan-perineurial marker14, was co-expressed predominantly in the Lepr+ endothelial cell cluster (Fig. 2c). Quantification of Lepr+Glut1+ cells among different clusters revealed around 20.2% of endothelial cells are Lepr+Glut1+ (Fig. 2b). In LeprCre; LSL-YFP reporter mice, immunolabelling for GLUT1, YFP and TH revealed the co-expression of LEPR and GLUT1 in the perineurium surrounding the TH+ sympathetic neurons of stellate ganglia (fused with T1) and T11–L2 sympathetic ganglia, which innervate BAT15 and scWAT16, respectively (Fig. 2d and Extended Data Fig. 4a–d). We also detected the co-expression of LEPR and GLUT1 in sympathetic nerve bundles innervating BAT (Fig. 2e), scWAT (Fig. 2f) and SCG (Extended Data Fig. 4e). We thus confirmed that the Lepr+ sympathetic endothelial cells constitute the perineurial barrier of the sympathetic ganglia and nerve bundles. We, therefore, refer to this endothelial cell population as SPCs.
a, Dot plot showing the expression of perineurial markers (Glut1, Itgb4, Lypd2, Mpzl2, Cldn1) and leptin receptor (Lepr) in the endothelial cell population. The size of the dot corresponds to the percentage of cells expressing the gene in each cluster, and the colour represents the average gene expression level. b, Box plot showing the percentage of cells co-expressing Lepr and Glut1 across indicated cell types from scRNA-seq data of 20 lean mice (10 per experiment). Values were estimated by bootstrap resampling of pooled cells. Boxes indicate median and interquartile range of bootstrap distributions. c, Co-expression of Lepr and Glut1 in different cell clusters observed in our scRNA-seq dataset. The position of the dotted lines is described in Methods. d–f, Immunofluorescence staining of LEPR (YFP), TH and GLUT1 protein in stellate ganglia (d) and sympathetic nerve bundles innervating the BAT (e) and scWAT (f) isolated from 12-week-old LeprCre; LSL-YFP reporter mice. Scale bars, 50 µm (stellate; left) and 10 µm (BAT and scWAT fibre; left). The white box indicates the field of view of the high-resolution images. The super-resolution images were taken at ×40 Airyscan SR mode. Scale bars, 10 µm (stellate; right) and 2 µm (nerve bundles; right).
Source data
SPCs highly co-express Lepr and Adrb2, unlike any other cell type
We next questioned whether SPCs could sense the sympathetic efferent arm in the neuroendocrine loop of leptin. To answer this question, we first checked in the scRNA-seq dataset whether SPCs express any adrenergic receptors17. Among different adrenergic receptors, Adrb2 is highly expressed in the endothelial cell cluster. In contrast, we found very low expression of alpha-adrenergic receptors and no expression of β3 adrenergic receptor in the endothelial population (Extended Data Fig. 5a). Co-expression analysis further showed that Lepr and Adrb2 are predominantly co-expressed in 20.4% of the endothelial cell population (Fig. 3a,b), and 6% of all endothelial cells are Lepr+Glut1+Adrb2+ (Extended Data Fig. 5b). To validate the scRNA-seq results, we performed fluorescence in situ hybridization (ISH) in combination with GLUT1 or CAV1 immunohistochemistry by RNAscope to detect the Lepr and Adrb2 mRNA in the SPC barrier. We observed co-expression of Lepr and Adrb2 in the GLUT1+ (Fig. 3c,d) and CAV1+ (Extended Data Fig. 5c) SPC barrier in stellate, SCG and sympathetic nerve bundles. We also confirmed the co-expression of Lepr and Adrb2 in the GLUT1+ perineurial barriers of T11–L2 ganglia, which innervate scWAT (Extended Data Fig. 5d–g).
a, scRNA-seq analysis shows co-expression of Lepr and Adrb2 across cell populations; dotted line positions are described in Methods. b, Box plot showing the percentage of cells co-expressing Lepr and Glut1 across indicated cell types from scRNA-seq data of 20 lean mice (10 per experiment). Values were estimated by bootstrap resampling of pooled cells. Boxes indicate the median and interquartile range of bootstrap distributions. c,d, High-magnification images showing dual labelling of GLUT1 protein and Lepr, Adrb2 mRNA in SCG and stellate ganglia (c) and sympathetic nerve (SN) bundles (d) dissected from WT mice. Scale bars, 50 µm (c, left), 5 µm (c, right), 5 µm (d, left) and 2 µm (d, right). e, Box plots showing the percentage of cell co-expressing Lepr and Adrb2 in the arcuate median eminence (ARC) and sympathetic ganglia. ARC data are derived from the HypoMap scRNA-seq dataset (single cells; cells are not independent biological replicates). Sympathetic nervous system (SNS) data are from our scRNA-seq analysis of sympathetic ganglia of 20 lean mice (10 per experiment); proportions were estimated per mouse using bootstrap resampling of cells. Boxes indicate the median and interquartile range of bootstrap distributions. f, High-magnification images showing dual labelling of NeuN protein and Lepr, Adrb2 mRNA in the hypothalamus of WT mice. Scale bars, 100 µm (first image) and 20 µm (second to fifth images). g, Quantification of Lepr+Adrb2+ neurons in the ARC nucleus of the hypothalamus (n = 5 per group). h, Body weight of normal chow diet (ND)-fed LeprCre; Adrb2fl/fl and Adrb2fl/fl mice. n = (Adrb2fl/fl, 15), (LeprCre: Adrb2fl/fl, 19). i, Food intake of ND-fed LeprCre; Adrb2fl/fl and Adrb2fl/fl mice. n = (Adrb2fl/fl, 15), (LeprCre: Adrb2fl/fl, 19). P values by week: 6 (0.580), 7 (0.023), 8 (0.067), 9 (0.011), 10 (0.012), 11 (0.070), 12 (0.005), 13 (0.003), 14 (<0.001), 15 (0.004), 16 (0.001). j, Body weight of LeprCre; Adrb2fl/fl and Adrb2fl/fl mice challenged with a 12-week HFD. n = (Adrb2fl/fl, 16), (LeprCre; Adrb2fl/fl, 23). P values by week: 0 (0.580629), 1 (0.031367), 2 (0.023843), 3 (0.043335), 4 (0.005867), 5 (0.003517), 6 (0.001536), 7 (0.00082), 8 (0.000255), 9 (0.000762), 10 (0.000774), 11 (0.00062), 12 (0.000333). k, Food intake of LeprCre; Adrb2fl/fl and Adrb2fl/fl mice following HFD challenge. n = (Adrb2fl/fl, 16), (LeprCre; Adrb2fl/fl, 23). l, Body composition measured in 14-week-old ND-fed LeprCre; Adrb2fl/fl and Adrb2fl/fl mice. n = (Adrb2fl/fl, 5), (LeprCre; Adrb2fl/fl, 7). P (0.0481). m, Body composition measured in LeprCre; Adrb2fl/fl and Adrb2fl/fl mice following 10-week HFD challenge. n = (Adrb2fl/fl, 4), (LeprCre; Adrb2fl/fl, 7). P < 0.0001. n, Representative infrared thermal imaging of the interscapular BAT of ND-fed LeprCre; Adrb2fl/fl and Adrb2fl/fl mice. o, Quantification of BAT temperature. Each data point represents the average BAT temperature per mouse. n = (Adrb2fl/fl, 6), (LeprCre: Adrb2fl/fl, 7). P = 0.0194. p, Representative infrared thermal imaging of BAT in HFD-fed LeprCre; Adrb2fl/fl and Adrb2fl/fl mice. q, Quantification of BAT temperature. n = (Adrb2fl/fl, 5), (LeprCre; Adrb2fl/fl, 6). P = 0.025. r, Relative expression levels of thermogenic genes in BAT (ND), with individual data points representing biological replicates. n = (Adrb2fl/fl, 6), (LeprCre: Adrb2fl/fl, 7). P values: Ucp1 (0.016), Elovl3 (0.006), Cidea (0.011), Pgc1α (0.13), Prdm16 (0.0098). s, Relative expression levels of thermogenic genes in BAT (HFD), with individual data points representing biological replicates. n = 6 per group. P values: Ucp1 (0.035), Elovl3 (0.212), Cidea (0.041), Pgc1α (0.142), Prdm16 (0.139). t, Regression plots of energy expenditure (EE) as a function of body weight measured in age-matched (14–16-week-old) ND-fed LeprCre; Adrb2fl/fl and Adrb2fl/fl mice. n = (Adrb2fl/fl, 9) (LeprCre; Adrb2fl/fl, 7). u, Regression plots of EE as a function of body weight measured in 10-week-old HFD-fed LeprCre; Adrb2fl/fl and Adrb2fl/fl mice. n = (Adrb2fl/fl, 11), (LeprCre; Adrb2fl/fl, 9). Data are the mean ± s.e.m. and were analysed using two-way analysis of variance (ANOVA) with Bonferroni post hoc test (h–k), analysis of covariance (ANCOVA; t and u) and two-tailed unpaired Student’s t-test (l, m, o and q–s). *P < 0.05, **P < 0.01, ***P < 0.001, ****P < 0.0001.
Source data
Next, we investigated whether Lepr and Adrb2 were co-expressed in any other tissues. To this end, we analysed the co-expression of Lepr and Adrb2 within individual annotated cell types for each organ represented in the Tabula Muris dataset18. No double-positive cells were detected in thymus, skin, diaphragm, colon, brain microglia, tongue, bone marrow, liver or kidney (FACS-based datasets). In pancreas (0.1%, 1/925 endothelial cells), fat (1%, 6/549 endothelial cells), brain non-microglia (0.3%, 2/639 endothelial cells), aorta (0.7%, 1/139 endothelial cells), muscle (0.7%, 3/402 endothelial cells), heart (0.1%, 1/894 endothelial cells or 1/993 fibroblasts), kidney (2%, 4/181 cells in droplet-based sequencing) and trachea (2.9%, 31/1,039), double-positive cells were exceptionally rare (Extended Data Figs. 6 and 7a–g. In bladder, droplet-based datasets detected low frequencies of double-positive cells in mesenchymal (2.4%, 28/1,186) and immune (10%, 6/57) populations, whereas FACS-based analysis identified only 2.0% (10/491) double-positive mesenchymal cells (Extended Data Fig. 7h,i). Analysis of an independent bladder-specific scRNA-seq dataset19 revealed no double-positive immune cells and only 3% (4/124) double-positive endothelial cells (Extended Data Fig. 7j). We further analysed the co-expression of this gene pair in the endothelial cell clusters extracted from mouse heart, liver, pancreas, gut and muscle18,20. We observed that in specific organs such as the heart (0.09%, 3 cells of 3,293), liver (0.44%, 3 of 675), pancreas (1.85%, 2 cells of 108), gut (0%, 0 cell out to 8,311) and muscle (1.42%, 98 cells of 6,894), double-positive cells were scarce (Extended Data Fig. 8a–e). We extended our analysis to fat tissue, using single-nucleus RNA-seq data from WAT21 (0.016%, 33 cells of 197,721) and BAT22 (0.016%, 5 cells of 30,792; Extended Data Fig. 8g,h). In both cases, double-positive cells were statistically indistinguishable from sequencing noise. To further validate our model, we performed RNAscope dual ISH staining in these tissues (heart, liver, fat, pancreas, muscle, gut, trachea, bladder and lung), confirming the negligible presence of Lepr+Adrb2+ cells in these organs (Extended Data Fig. 9). We expanded our co-expression analysis to additional large cohorts of multiple tissues: the Mouse Cell Atlas (MCA, versions 1 and 2)23,24. In the MCA v1, we found that only 8 cells co-expressed Lepr and Adrb2, representing 0.002% of the 333,778 cells, which was not distinguishable from noise. In the MCA v2, which comprises developing, adult and aged mice, we found only 34 cells co-expressing these genes, representing 0.006% of the 520,801 cells, which was not distinguishable from noise (Extended Data Fig. 8i,j). Given the potential presence of the perineurial cells in sensory/parasympathetic ganglia or the sciatic nerve, we also analysed Lepr Adrb2 co-expression in three additional single-cell datasets, including data from the dorsal root ganglia25, nodose ganglia26 and the sciatic nerve13. Co-expression of Lepr and Adrb2 was rare in the dorsal root ganglia (2/8,089; 0.02%) and nodose ganglia (1/1,825; 0.05%), and frequencies were indistinguishable from noise (Extended Data Fig. 8k,l). In the sciatic nerve, 22 of 10,554 cells (0.2%) expressed both markers, a marginal increase likely reflecting the known 25% sympathetic axon in rats (Extended Data Fig. 8m). By contrast, sympathetic ganglia co-expressed Lepr and Adrb2 in 1,761/73,042 (2.4% of all cells), representing 20.4% of endothelial cells (Extended Data Fig. 8n). Our analysis did not find substantial co-expression of Lepr and Adrb2 in any other cell type in other organs thus far.
Neurons in the arcuate nucleus of hypothalamus express leptin and adrenergic receptors, which play a major role in regulating food intake as well as sympathetic outflow to white and brown adipose tissues27,28,29,30. We, therefore, analysed the HypoMap scRNA-seq dataset to investigate the possible presence of Lepr+Adrb2+ co-expression in the arcuate neuronal populations31. Our analysis revealed a negligible percentage of neurons (0.01%) in the arcuate hypothalamus co-express Lepr and Adrb2 mRNA compared with that of sympathetic endothelial cells (20.4%; Fig. 3e and Extended Data Fig. 10a–c). This observation was further validated by dual labelling of Lepr and Adrb2 mRNA in NeuN-positive neurons in the arcuate hypothalamus by fluorescence ISH and immunohistochemistry (Fig. 3f). The quantification of Lepr+Adrb2+ neurons in arcuate hypothalamic region revealed an average of only 2.3% ± 0.3% central nervous system neurons as Lepr+Adrb2+ (Fig. 3g). We also analysed the arcuate neuronal populations within the HypoMap dataset to ascertain whether Lepr is co-expressed with other alpha-adrenergic and beta-adrenergic receptors. Our co-expression analysis excluded the presence of any notable co-expression of Lepr with any other adrenergic receptor subtypes in arcuate neurons (Extended Data Fig. 10d–k).
LeprCre:Adrb2fl/fl mice have lower energy expenditure and thermogenesis, and higher obesity risk, independently of food intake
To test whether Adrb2 in SPCs was functionally relevant to body weight homeostasis, we generated LeprCre; Adrb2fl/fl conditional knockout mice, resulting in the deletion of Adrb2 in Lepr+Adrb2+ cells, predominantly in SPCs. Immunolabelling with GLUT1 protein and Lepr, and Adrb2 mRNA of stellate ganglia confirmed the absence of Adrb2 in the Lepr+ SPCs of LeprCre; Adrb2fl/fl mice (Supplementary Fig. 1a,b). Next, we characterized the metabolic phenotype of LeprCre; Adrb2fl/fl and control Adrb2fl/fl mice under chow-fed and HFD-fed conditions. We discovered that LeprCre; Adrb2fl/fl mice kept on a chow diet displayed a consistent pattern of significant weight gain compared with Adrb2fl/fl mice, beginning at 7 weeks of age. This difference was more pronounced and highly significant from the age of 12 weeks to 16 weeks (Fig. 3h) and occurred independently of food intake (Fig. 3i). The weight gain in LeprCre; Adrb2fl/fl mice was associated with increased adiposity, in particular higher BAT and visceral adipose tissue (VAT) mass without changes in lean mass and key skeletal muscles (Fig. 3l and Supplementary Fig. 1c). Indirect calorimetry revealed that LeprCre; Adrb2fl/fl mice have lower daily energy expenditure (Fig. 3t) and a trend towards reduced O2 consumption (VO2) and CO2 production (VCO2; Supplementary Fig. 1d,e) with no changes in respiratory exchange ratio (RER) and total activity (Supplementary Fig. 1f,g and Supplementary Table 1a). Consistent with this observation, LeprCre; Adrb2fl/fl have lower BAT temperature (Fig. 3n,o) and decreased expression of thermogenic genes Ucp1, Elovl3, Cidea and Prdm16 (Fig. 3r). When fed a HFD, LeprCre; Adrb2fl/fl mice gained weight faster and were heavier than controls (Fig. 3j), despite no difference in food intake (Fig. 3k). Following the HFD challenge, LeprCre: Adrb2fl/fl developed pronounced adiposity compared with control Adrb2fl/fl mice. While some increase in lean mass was observed in LeprCre: Adrb2fl/fl mice (~13% above control levels), the increase in fat mass was substantially more significant, reaching ~85% higher than that of HFD-fed Adrb2fl/fl mice (Fig. 3m). As observed in the chow-fed state, BAT and VAT depots were significantly larger in HFD-fed LeprCre: Adrb2fl/fl mice, without any changes in skeletal muscle mass (Supplementary Fig. 1i). In addition, HFD-treated LeprCre; Adrb2fl/fl mice have lower energy expenditure (Fig. 3u), VO2 (Supplementary Fig. 1j) and VCO2 (Supplementary Fig. 1k) with no changes in RER and locomotor activity (Supplementary Fig. 1l,m and Supplementary Table 1b). Similar to the chow-fed mice, HFD-treated LeprCre; Adrb2fl/fl mice showed lower BAT activity (Fig. 3p,q) and a significant reduction in thermogenic gene expression (Ucp1, Cidea and Pgc1α; Fig. 3s).
To exclude the possibility that Cre itself may interfere with Lepr production, we also characterized the metabolic phenotype of LeprCre mice and LeprCre: Adrb2fl/fl mice in both the chow-fed state and the 12-week-HFD-challenged state. We observed that LeprCre: Adrb2fl/fl mice gained significantly more weight compared with LeprCre mice in both chow-fed (Supplementary Fig. 2a) and HFD-challenged (Supplementary Fig. 2m) states, independent of food intake (Supplementary Fig. 2b,n). Compared with LeprCre mice, LeprCre: Adrb2fl/fl mice had reduced energy expenditure, VO2 and VCO2 in both chow-fed (Supplementary Fig. 2e–g) and HFD-fed (Supplementary Fig. 2q–s) conditions, with no changes in physical activity (Supplementary Fig. 2i,u). Importantly, LeprCre: Adrb2fl/fl mice had significantly lower BAT temperature (Supplementary Fig. 2j,k,v,w) and reduced expression of thermogenic genes (Supplementary Fig. 2l,x) compared with LeprCre mice in both dietary conditions. These data suggest that the obesogenic phenotype in Leprcre: Adrb2fl/fl mice was not due to Lepr-driven Cre expression. Altogether, we demonstrate that the expression of Adrb2 in Lepr+ SPCs is essential for sustaining energy expenditure and thermogenesis and for protecting against obesity.
Diet-induced-obesity-driven hyperleptinaemia destroys the SPC barrier
We next asked whether obesity changes the integrity of the SPC barrier. Analysis of the frequency of cells in the endothelial cluster of lean and obese sympathetic ganglia revealed a decreased proportion of endothelial cells in obese mice (Fig. 4a). Comparison analysis of the Lepr+ endothelial subset between lean and obese states further depicted a 20% reduction of Lepr+ endothelial cells in the sympathetic ganglia of obese mice (Fig. 4b). To corroborate the scRNA-seq analysis, we immunolabelled the scWAT and BAT sympathetic nerve bundles of 12-week-old HFD-induced obese (DIO) and chow-fed lean LeprCre; LSL-YFP reporter mice (Fig. 4c,d and Supplementary Fig. 3). These studies revealed a significant reduction in LEPR+ SPC area in the sympathetic nerve bundles innervating scWAT and BAT of obese mice compared with aged-matched lean mice (Fig. 4e). The density of TH+ sympathetic axons was also significantly decreased in scWAT and BAT sympathetic nerve bundles of obese mice (Fig. 4f). By using electron microscopy on scWAT-derived sympathetic nerve bundles of DIO and chow-fed lean mice, we confirmed a significant loss of perineurial cell layers in obese mice compared with their lean littermates (Fig. 4g,h). We also immunolabelled the scWAT and BAT sympathetic nerve fibres of 10-week-old chow-fed LeprCre; Adrb2fl/fl and Adrb2fl/fl mice. Similar to DIO mice, we observed a significant reduction in CAV1+ SPC area in the sympathetic nerve bundles innervating scWAT and BAT of obese LeprCre; Adrb2fl/fl mice compared with age-matched lean Adrb2fl/fl mice (Fig. 4j,k). The density of TH+ sympathetic axons was also significantly lower in scWAT and BAT sympathetic nerve bundles of LeprCre; Adrb2fl/fl mice (Fig. 4j,l). Notably, we observed a significantly higher leptin level in LeprCre; Adrb2fl/fl mice (Fig. 4m), similar to DIO mice (Fig. 4i). In addition, LeprCre; Adrb2fl/fl mice had lower noradrenaline levels in scWAT and BAT in both chow-fed (Fig. 4n) and HFD-treated (Fig. 4o) conditions compared with Adrb2fl/fl mice. Together, our data suggest that DIO disrupts the SPC barrier, which is concomitant with sympathetic neuropathy32,33 and reduced sympathetic activity in adipose tissues. By examining leptin-deficient ob/ob mice, we also confirmed that the SPC barrier and the density of TH+ neurons remain unaltered between ob/ob mice and their lean wild-type (WT) littermates (Supplementary Fig. 4). This indicates that SPCs are not lost in a hypoleptinaemic state, and provides additional support for our model, which posits that perineurial cells die in response to hyperleptinaemia, and not just obesity.
a, scRNA-seq of ganglia showing the fraction of endothelial cell population in chow-fed lean and HFD-induced obese WT mice. Fractions were estimated per mouse from scRNA-seq data using bootstrap resampling of cells (lean n = 20; obese n = 10). Boxes indicate median and interquartile range of bootstrap distributions. b, Pie chart shows the percentage of Lepr+ endothelial cells in lean and obese endothelial populations within ganglia. c,d, Representative images of scWAT (c) and BAT (d) nerve bundles from chow-fed lean and HFD-fed obese (Leprcre; LSL-YFP) reporter mice showing the expression of LEPR (YFP) and TH. Scale bars, 50 µm. e, Quantification of LEPR+ SPC barrier in scWAT (P = 0.003) and BAT (P = 0.002) fibres of lean and DIO mice (n = 5 mice per group). f, Quantification of TH+ sympathetic neurons in scWAT (P = 0.001) and BAT (P = 0.002) fibres of lean and DIO mice (n = 5 mice per group). g, Electron micrograph showing the perineurial barrier in scWAT bundles of lean and obese mice with false colouring to highlight the perineurial layers (green). h, Quantification of the perineurial layer in obese and lean scWAT bundles (n = 3 mice per group); P = 3.63 × 10⁻⁷. i, Plasma leptin level in lean and DIO mice (n = 7 or 8 mice per group). (Lean n = 8; obese n = 6); P < 0.0001. j, Representative images of scWAT and BAT nerve fibres from chow-fed 10-week-old LeprCre; Adrb2fl/fl and Adrb2fl/fl mice showing the expression of CAV1 and TH. Scale bars, 50 µm. k, Quantification of CAV1+ SPC barrier in obese LeprCre; Adrb2fl/fl and lean Adrb2fl/fl scWAT (P = 0.0009) and BAT (P = 0.002) fibres (n = 5 mice per group). l, Quantification of TH+ sympathetic neurons in chow-fed LeprCre; Adrb2fl/fl and Adrb2fl/fl scWAT (P = 0.006) and BAT (P = 0.016) bundles (n = 5 mice per group). m, Plasma leptin level in 10-week-old chow-fed LeprCre; Adrb2fl/fl (n = 8) and Adrb2fl/fl (n = 7) mice; P = 0.017. n, Noradrenaline (NE) content in scWAT (n = 6 (LeprCre; Adrb2fl/fl) and n = 7 (Adrb2fl/fl); P = 0.019) and BAT (n = 5 per group; P = 0.023) fat pads isolated from 10-week-old chow-fed LeprCre; Adrb2fl/fl and Adrb2fl/fl mice (n = 5 or 6 mice per group). o, NE content in scWAT (n = 5 per mice group; P = 0.0241) and BAT (n = 6 mice per group; P = 0.021) fat pads isolated from 10-week-old HFD-challenged LeprCre; Adrb2fl/fl and Adrb2fl/fl mice. Data were analysed by two-tailed unpaired Student’s t-test and are shown as the mean ± s.e.m. *P < 0.05, **P < 0.01, ***P < 0.001, ****P < 0.0001.
Source data
Obesity and high leptin drive apoptosis of SPCs, which is prevented by sympathomimetic ADRB2 agonism
We next asked how DIO causes loss of the perineurial barrier. To answer that question, we performed functional enrichment analysis of the differentially expressed genes (DEGs; adjusted P value < 0.05) in endothelial cell clusters between obese and lean mice based on Kyoto Encyclopedia of Genes and Genomes (KEGG) pathways using ShinyGO 0.77 (with a false discovery rate cut-off of 0.05)34. The top 20 enriched pathways are represented in the dot plot (Fig. 5a). Notably, KEGG pathway analysis revealed the enrichment of apoptotic process in obese endothelial cluster compared with the lean mice (Fig. 5a). Differential gene expression analysis of endothelial cells show that the genes listed in the cellular apoptotic pathways were mostly upregulated in obese mice (Fig. 5b). Hence, we next immunolabelled the SCG and scWAT-derived sympathetic nerve bundles of 12-week-old DIO obese and lean mice for one of the apoptotic markers, Tnfrsf1a (also known as TNFR1). Consistent with the scRNA-seq analysis, we observed a higher expression of TNFR1 in the SPC barrier and the sympathetic neurons of SCG and scWAT sympathetic nerve bundles (Fig. 5c) of obese mice compared with their lean littermates. The presence of TUNEL-immunoreactive cells in the SCG of DIO mice further confirms the occurrence of apoptosis of SPCs and sympathetic neurons in obese mice (Supplementary Fig. 5a). Together, these data suggests that diet-induced hyperleptinaemic obesity drives apoptosis of the SPC barrier and sympathetic neurons, resulting in loss of the SPC barrier and sympathetic neuropathy in adipose tissue. To ascertain this observation, we performed ex vivo experiments by treating SCG explants with low (10 ng ml−1) and high leptin (100 ng ml−1) that, respectively, emulate in vitro the states of normo-leptinaemia and hyperleptinaemia32,35. We then evaluated the effect of high leptin on the CAV1+ SPC barrier and TH+ sympathetic neurons by immunofluorescence. Compared with low leptin, high leptin exposure resulted in a significant reduction in CAV1 expression in the SPC barrier and TH intensity in the sympathetic neurons of the SCG explant (Fig. 5d,e). We next checked whether activation of ADRB2 in SPCs can mitigate the effects of high leptin. Notably, co-incubation with a high leptin and a sympathomimetic β2 agonist (clenbuterol) could restore the CAV1+ SPC barrier integrity and TH+ neuron density. This protective effect was abolished by a selective ADRB2 antagonist, butoxamine, indicating that ADRB2 activation is necessary to prevent the SPC and sympathetic neurons loss in hyperleptinaemic conditions (Fig. 5d,e). In contrast, co-treatment with a high dose of leptin and either the ADRB3 agonist (mirabegron) or the ADRB1 agonist (dobutamine) failed to rescue the SPC barrier and sympathetic neuron loss, emphasizing the specificity of the ADRB2-mediated effect (Supplementary Fig. 6a,b). To investigate whether excessive adrenergic signalling alone affects SPCs, we treated the SCG explant with low leptin (10 ng ml−1) alone or in combination with high-dose clenbuterol (100 µg ml−1 or 200 µg ml−1) for 24 h. Neither the SPC barrier integrity nor the TH+ neuron density was affected by elevated doses of clenbuterol, suggesting that SPCs are not intrinsically sensitive to supraphysiological adrenergic stimulation (Supplementary Fig. 6c,d). Finally, we evaluated the expression of apoptotic marker TNFR1 in SCG explants treated in vitro with different doses of leptin. Consistent with the in situ data (Fig. 5c), high leptin significantly increased TNFR1 expression both in the SPC barrier and sympathetic neurons, which was restored by β2 agonist treatment (Supplementary Fig. 5b,c). Collectively, these data demonstrate that obesity-driven hyperleptinaemia causes apoptosis of SPCs and sympathetic neurons, and that this effect can be prevented by selective activation of β2-adrenergic receptors in SPCs.
a, The top 20 enriched KEGG pathways using the DEGs between lean and obese sympathetic endothelial cell populations. b, Volcano plot showing the DEGs between lean and obese sympathetic endothelial cell populations involved in apoptosis. The logarithms of the fold changes of individual genes (x axis) are plotted against the negative logarithm of their P value to base 10 (y axis). Positive log2(fold change) values represent upregulation (red) and negative values represent downregulation (blue) in obese mice. The red vertical lines represent more than 50% of the fold change. c, TNFR1 expression in SCG and scWAT bundles isolated from lean and diet-induced obese mice. Scale bars, 50 µm. (n = 4 mice per group); (P = 0.016). d, Representative images of SCG explant culture showing the expression of CAV1, TH and DAPI following low leptin (10 ng ml−1), high leptin (100 ng ml−1), high leptin (100 ng ml−1) + clenbuterol (10 µg ml−1), high leptin (100 ng ml−1) + clenbuterol (10 µg ml−1) + butoxamine (10 µM) treatment. Scale bars, 100 µm. e, Quantification of CAV1 and TH in SCG explants following different stimulating conditions (n = 8, low leptin; 8, high leptin; 8, high leptin + clenbuterol; 6 mice, high leptin + clenbuterol + butoxamine). CAV1_MFI, P = 0.003 (low lep versus high lep), 0.0002 (high lep versus high lep + clen), 0.001 (high lep + clen versus high lep + clen + butox). TH_MFI, P = 0.01 (low lep versus high lep), 0.003 (high lep versus high lep + clen), 0.04 (high lep + clen versus high lep + clen + butox). f, Scheme of hLep Ab or Ctrl Ab treatment in DIO mice. Body weight gain (P = 0.0006, week 3) and food intake were measured during antibody treatment (n = 7 per group). g, Representative images of scWAT and BAT bundles from obese mice treated with hLep Ab or Ctrl Ab showing the expression of CAV1 and TH. Scale bars, 50 µm. h–k, Quantification of CAV1+ SPC barrier and TH+ sympathetic neurons in scWAT (SPCs, P < 0.0001; TH, P = 0.0004) and BAT (SPCs, P = 0.0005; TH, P = 0.007) fibres from hLep Ab- and Ctrl Ab-treated mice (n = 7 mice per group). a.u., arbitrary units; butox, butoxamine; clen, clenbuterol; lep, leptin; MFI, mean fluorescence intensity. Data are the mean ± s.e.m. and were analysed using two-tailed unpaired Student’s t-test (c and h–k) and one-way ANOVA with Turkey’s multiple-comparison test (e and f). *P < 0.05, **P < 0.01, ***P < 0.001. Schematic in f created in BioRender; Sarker, G. https://biorender.com/aw7m9xh (2026).
Source data
To investigate whether hyperleptinaemia-induced SPC loss and sympathetic neuropathy can be attenuated in vivo, we treated DIO mice with a human leptin-neutralizing monoclonal antibody (hLep Ab) and an isotype control antibody (Ctrl Ab) for 3 weeks36. hLep Ab-treated mice also showed a significant reduction in weight gain compared with Ctrl Ab mice, independently of food intake (Fig. 5f). Notably, we observed a marked increase in CAV1+ SPC area and the density of TH+ sympathetic axons in the sympathetic nerve bundles isolated from scWAT (Fig. 5g–i) and BAT (Fig. 5g,j,k) of mice treated with hLep Ab compared with Ctrl Ab mice. We next tested whether the administration of ADRB2 agonist (clenbuterol), can rescue SPC loss in vivo. DIO mice were treated with either clenbuterol-containing water or regular drinking water for five consecutive days37 (Supplementary Fig. 7a). Consistent with our ex vivo findings, we observed a significant increase in CAV1+ SPC area and the density of TH+ sympathetic axons in the sympathetic nerve bundles innervating both the scWAT (Supplementary Fig. 7b,d,e) and BAT (Supplementary Fig. 7c,f,g) of the mice that consumed clenbuterol with drinking water compared with the mice that consumed regular drinking water. Collectively, these results confirm that hyperleptinaemia-induced SPC loss and sympathetic neuropathy in obesity can be rescued by the partial reduction of leptin or the administration of an ADRB2 agonist.
LEPR+ADRB2+ SPCs are present in humans, and common polymorphisms of LEPR and ADRB2 show male-specific synergistic interaction with obesity risk
To establish human relevance, we next performed single-nuclei RNA-seq of sympathetic ganglia from human donors, which revealed the distinct population of non-immune and immune cell clusters (Fig. 6a). Notably, within the human sympathetic ganglia, we observed the co-expression of LEPR and ADRB2 exclusively in the endothelial cluster (Fig. 6b). We also confirmed the co-expression of LEPR and ADRB2 mRNA in the CAV1+ perineurial barriers of human stellate ganglia, which innervate BAT (Fig. 6c). To evaluate whether this co-expression is conserved in other tissues, we analysed a publicly available scRNA-seq dataset from human subcutaneous white38 and brown39 adipose tissue. We observed that only 6 cells of 25,123 (~0.02%) co-expressed these genes in the scWAT (Fig. 6d), and a mere 2 cells of 72,594 (~0.002%) co-expressed them in the BAT (Fig. 6e), emphasizing the selective expression of these 2 genes only in human SPCs. To further strengthen the translational relevance, we performed complementary experiments in primary human umbilical vein endothelial cells (HUVECs) overexpressing human LEPR and ADRB2. Under hyperleptinaemic conditions, LEPR+ADRB2+ HUVECs exhibited increased apoptosis, which was reproducibly rescued by β2-adrenergic stimulation with clenbuterol (Supplementary Fig. 8). Importantly, WT HUVECs showed no apoptotic response under identical conditions, indicating that the effect is dependent on LEPR/ADRB2 expression rather than nonspecific leptin toxicity. Recent genetic association studies in middle-aged Brazilian and Japanese populations reported a synergic interaction between LEPR and ADRB2 variants for being associated with the risk of overweight/obesity40,41. We analysed the effect of such LEPR and ADRB2 variants on European individuals from the UK Biobank (UKB) cohort. Consistent with prior reports, we observed that a LEPR variant Gln223Arg (rs1137101) or an ADRB2 variant Gln27Glu (rs1042714) does not have, individually, any statistically significant effects on body mass index (BMI; Supplementary Table 2a). However, we found a significant synergistic effect between LEPR Gln223Arg (rs1137101) variant and ADRB2 Gln27Glu (rs1042714) variant for BMI (beta = 0.04; P value = 0.013; Supplementary Table 2a). The same interaction showed a higher effect in the BMI > 25 group (beta = 0.047, P value = 0.0056) but was not significant in the BMI < 25 group (Supplementary Table 2a). Sex-stratified analysis further revealed that a significant synergistic interaction between LEPR Gln223Arg (rs1137101) variant and ADRB2 Gln27Glu (rs1042714) variant was driven by only men for BMI (BMI > 25 group (beta = 0.057, P value = 0.04), BMI < 25 group (beta = 0.061, P value = 0.03); Supplementary Table 2b,c). No significant interaction was observed in women in both BMI groups. The interaction frequency of LEPR Gln223Arg (rs1137101) variant and ADRB2 Gln27Glu (rs1042714) variant was higher (53%) in men in the BMI > 25 group compared with all other groups (Supplementary Table 2b,c). Importantly, this sex-specific interaction aligns with the sexual dimorphism we observed in LEPR/ADRB2 co-expression within human SPCs (Fig. 6f), supporting a potential link between these cells and the observed genetic association with male obesity. Consistently, we observed no difference in body weight between female LeprCre: Adrb2fl/fl and control Adrb2fl/fl mice in both chow-fed and HFD-challenged states (Supplementary Fig. 9), which resonates with the sexual dimorphism observed in the human cohort.
a, Unsupervised clustering of 15,998 nuclei using a resolution of 0.75 and visualized via UMAP. b, Density plots showing the expression patterns of LEPR and ADRB2, and their co-expression across all nuclei. c, High-magnification image showing dual labelling of CAV1 protein and LEPR/ADRB2 mRNA in human stellate ganglia. Scale bar, 2 µm. The experiments were repeated twice with similar results. d,e, Correlograms between LEPR and ADRB2 gene expression in human white (d) and brown (e) adipose tissues. f, Dot plot showing the LEPR/ADRB2 co-expression in different clusters of male and female human SCG and stellate ganglia dataset. The relative co-expression of LEPR and ADRB2 was quantified across cell clusters by calculating the percentage of double-positive cells within each cluster, normalized to the total number of double-positive cells in the dataset. Co-expression levels are represented by the product of normalized gene expression values (LEPR × ADRB2).
Source data
To report on a potential structural interaction, we also modelled the interaction between the D1 domain as well as D1–D7 domains from LEPR (Q223R, Gln223Arg) with ADRB2 (Q27E, Gln27Glu) using AlphaFold2-multimer. The Q223R polymorphism is located at the D1 domain of LEPR. Structural predictions showed poor interaction metrics, clustering the D1 domain in the cytoplasmic side of the ADRB2, which is highly implausible because the D1 is located extracellularly (Supplementary Fig. 10a,b). This observation likely reflects the known challenges of modelling membrane protein complexes with AF2 due to inconsistencies in transmembrane segment location42,43,44. We further performed molecular dynamics simulations for both ADRB2 and LEPR polymorphisms to assess any differences in ligand binding. For ADRB2, both WT and the Q27E polymorphism maintained ~80% of native adrenaline contacts, with stable binding observed over 1,000 ns, aligning with prior reports of negligible functional change45 (Supplementary Fig. 10c). For LEPR, while the Q223R polymorphism showed increased local flexibility in the D1 domain, no significant differences were observed in leptin binding in full-length receptor simulations, with both WT and Q223R retaining ~75% of native contacts over 8,000 ns (Supplementary Fig. 10d). These results suggest that neither mutation substantially alters ligand binding stability within the simulated timescales.
Together, the genetic data point to a male-specific interaction between LEPR and ADRB2 variants in the association with obesity, which aligns with SPC biology; however, structural and simulation analyses do not support a direct physical interaction between receptors
Overall, our data support a model whereby SPCs coordinate leptin and sympathetic signalling to preserve adipose sympathetic integrity and maintain metabolic homeostasis, while obesity-associated hyperleptinaemia disrupts this regulatory circuit through SPC apoptosis (Fig. 7)
The Lepr+Adrb2+ SPCs can sense and integrate leptin and NE signalling in adipose tissue that form the afferent and efferent arms of the neuroendocrine loop of leptin action, respectively. In obesity, when leptin signalling exceeds the NE released by sympathetic nerves, SPCs undergo apoptosis, which erodes the neuroprotective perineurial barrier, exposing sympathetic neurons to pro-inflammatory cues. Altogether, this contributes to sympathetic neuropathy and disrupts adipose tissue homeostasis. SAMs, sympathetic-associated macrophages; SPCs, sympathetic perineurial cells; LEPR, leptin receptor; ADRB2, β2-adrenergic receptor. Illustration created in BioRender; Sarker, G. https://biorender.com/oby2bb7 (2026).
Discussion
Systems control theory posits that stable negative feedback requires proportional engagement of afferent and efferent arms of a loop. In the neuroendocrine loop of leptin action, adipocyte-derived leptin constitutes the afferent signal to the brain, whereas sympathetic outflow to adipose tissues represents the efferent arm. While the central components of this loop have been extensively studied, peripheral mechanisms that might influence its operating balance have remained less well defined
In searching for a cell population capable of responding to both leptin and sympathetic tone within peripheral ganglia, we identified a perineurial endothelial population in sympathetic ganglia and adipose-associated nerve bundles that shows enriched co-expression of Lepr and Adrb2. Across 16 publicly available single-cell datasets covering 24 mouse organs, analysed using a uniform pipeline, Lepr/Adrb2 double-positive cells were preferentially enriched in sympathetic ganglia relative to other tissues, where such cells were rare and typically at frequencies indistinguishable from background18,20. Independent RNAscope validation across multiple organs further supported this preferential enrichment. Together, these data position Lepr+Adrb2+ SPCs as a specialized peripheral population with the capacity to respond to both circulating leptin and local β2-adrenergic signal46.
Our functional experiments indicate that ADRB2 signalling in LEPR+ SPCs is required to sustain energy expenditure and thermogenic activity. Conditional deletion of Adrb2 in LeprCre-expressing SPCs resulted in reduced energy expenditure, lower BAT temperature, diminished thermogenic gene expression and increased adiposity, without alterations in food intake. These findings establish a causal role for β2-adrenergic signalling in this cell population in maintaining metabolic homeostasis. In particular, these results provide new insights into ADRB2’s regulation of metabolic rate and fat mass reduction, which so far focus on postsynaptic effects on thermogenic adipocytes47, whereas SPCs act presynaptically by ensheathing sympathetic ganglia and nerve bundles, preserving their normal function5.
In parallel, we observed that DIO and associated hyperleptinaemia are accompanied by apoptosis of SPCs, erosion of the perineurial barrier, and sympathetic neuropathy in adipose tissue. Importantly, partial leptin reduction in vivo or selective β2-adrenergic agonism both prevented SPC loss and restored sympathetic integrity. Ex vivo, supraphysiological leptin induced apoptotic signatures in SPCs that were specifically counteracted by β2 agonism, but not by β1 or β3 stimulation. These complementary genetic and pharmacological data support a model in which leptin excess and β2-adrenergic tone exert opposing influences on SPC viability. We note, however, that currently available Cre-based strategies do not allow selective deletion of both Lepr and Adrb2 specifically at their intersection within SPCs. Crossing endothelial Cre drivers with floxed alleles would target the union rather than the co-expression domain of these receptors. Thus, while our data support reciprocal effects of LEPR and ADRB2 in SPCs, they do not directly interrogate cell-autonomous co-requirements of both receptors within the same cell in vivo. This could represent a technical limitation and an avenue for future refinement using intersectional genetic tools.
Most conceptual models of leptin resistance have focused on hypothalamic mechanisms regulating appetite48. Our findings suggest that peripheral alterations in sympathetic ganglia and their perineurial barrier may also contribute to impaired energy expenditure during obesity. In this framework, sustained hyperleptinaemia may progressively compromise SPC integrity, weaken the neuroprotective perineurial barrier, exposing sympathetic neurons to pro-inflammatory cues49, and reduce sympathetic support of adipose tissue thermogenesis (Fig. 7). Rather than redefining a systemic ‘set point,’ these data support the existence of a peripheral modulatory node that can influence the efficiency of sympathetic output under conditions of leptin excess50.
The translational relevance of this axis is supported by the presence of LEPR+ADRB2+ SPCs in human sympathetic ganglia and by the male-specific synergistic interaction between common LEPR and ADRB2 variants associated with increased BMI in the UKB cohort, replicating observations in independent populations40,41. Although genetic association does not establish causality at the cellular level, the convergence of human single-nucleus transcriptomics, endothelial overexpression assays, and population genetics strengthens the plausibility of an LEPR–ADRB2 axis in human metabolic regulation. To assess the potential for a direct structural basis underlying this interaction, we conducted structural modelling and molecular dynamics simulations. The results suggest that neither mutation substantially alters ligand binding stability within the simulated timescales. However, limitations in sampling timescales, simulation resolution, and exclusion of membrane and additional binding partners should be considered when interpreting these findings51,52. Alternatively, the synergistic interaction between LEPR and ADRB2 polymorphisms on BMI could be explained by the cross-talk within downstream signalling pathways53. Future studies will determine how LEPR and ADRB2 variants in SPCs alter leptin–noradrenergic signalling to impact body weight gain. This will provide new insights on how to dually target LEPR and ADRB2, potentially with unimolecular polypharmacy, to bypass central leptin resistance beyond suppression of food intake in a large patient cohort.
In summary, our findings identify LEPR+ADRB2+ SPCs as a peripheral component of the neuroendocrine network engaged by leptin action, with potential implications for understanding aspects of leptin resistance beyond the regulation of food intake. By influencing perineurial barrier integrity and sympathetic support of adipose tissue, this cell population may contribute to the regulation of energy expenditure and to the progression of obesity under conditions of chronic hyperleptinaemia and sympathetic neuropathy.
Methods
Animals
C57BL/6 WT mice at 6–8 weeks old were purchased from Charles River. LeprCre mice (Leprtm2(cre)Rck; stock number 008320), Rosa26-LSL-ChR2-YFP mice (stock number 012-569) and ob/ob mice (stock number 000632) were purchased from the Jackson Laboratory, and Adrb2fl/fl mice were kindly provided by G. Karsenty, Columbia University, USA. Mice were bred in-house to produce homozygous LeprCre: Rosa26-LSL-ChR2-YFP mice and LeprCre: Adrb2fl/fl mice. Mice were housed in groups of 2–5, unless fighting or barbering was observed. The room in which animals were housed had a 12-h light–dark cycle: light during the day and dark during the night, switching at 7:00 and 19:00. Ambient room temperature (RT) was maintained at 22°C ± 2 °C and humidity at 50% ± 20%. Mice had unrestricted access to water and a regular chow diet (irradiated 2916 Teklad diet; 63% carbohydrate, 23% protein and 4% fat), unless mentioned otherwise. Both male and female mice were used in this study. All experiments were conducted in accordance with the United Kingdom Animal Scientific Procedures Act 1986 under personal and project licences granted by the United Kingdom Home Office and approved by the local Department of Physiology, Anatomy and Genetics (University of Oxford) ethical review committee.
Antibodies, reagents and drugs
Antibodies were obtained from the following vendors: rabbit anti-TH (Millipore, AB152; 1:500 dilution), chicken anti-TH (Aves Lab, TYH, TH1205; 1:500 dilution), goat anti-GFP (Abcam, ab6673; 1:1,000 dilution), chicken anti-GFP (Abcam, ab13970; 1:1,000 dilution), rabbit anti-caveolin-1 (CAV1; Cell Signaling, D46G3; 1:500 dilution), rabbit anti-glucose transporter (GLUT1; Abcam, ab150299; 1:200 dilution), rabbit anti-TNFR1 (Invitrogen, PA595585; 1:500 dilution), rabbit anti-VE-cadherin (Life Technologies, 361900; 1:100 dilution), goat F(ab) anti-mouse IgG (H + L; Abcam, ab6668; 1:500 dilution), mouse anti-VEGFR2 (Santa Cruz Biotechnology, Sc-6251; 1:500 dilution), rabbit anti-NeuN (Abcam, ab177487; 1:500 dilution), rabbit anti-Des (Abcam, ab15200; 1:500 dilution), rat anti-CD31 (BioLegend, 102501; 1:2000 dilution), goat anti-rabbit IgG (H + L) secondary antibody, Alexa Fluor 647 (Invitrogen, A11010; 1:500 dilution), goat anti-rabbit IgG (H + L) secondary antibody, Alexa Fluor 546 (Invitrogen, A11035; 1:500 dilution), goat anti-chicken IgG (H + L) secondary antibody, Alexa Fluor 594 (Invitrogen, A11042; 1:500), goat anti-chicken IgY (H + L) secondary antibody, Alexa Fluor 647 (Invitrogen, A21449; 1:500 dilution), goat anti-chicken IgY (H + L) secondary antibody, Alexa Fluor 546 (Invitrogen, A11040; 1:500 dilution), goat anti-mouse IgG (H + L) secondary antibody, Alexa Fluor 594 (Invitrogen, A11005; 1:500 dilution), goat anti-chicken IgY (H + L) secondary antibody, Alexa Fluor 488 (Invitrogen, A-11039; 1:500 dilution), goat anti-rabbit IgG (H + L), Alexa Fluor 488 (Invitrogen, A11034; 1:500 dilution), donkey anti-goat IgG (H + L) secondary antibody, Alexa Fluor 647 (Invitrogen, A21447; 1:500 dilution), donkey anti-chicken IgY (H + L) secondary antibody, Alexa Fluor 647 (Stratech, 703-605-155; 1:500 dilution), donkey anti-goat IgG (H + L) secondary antibody, Alexa Fluor 488 (Invitrogen, A11055; 1:500 dilution), donkey anti-chicken IgG (H + L) secondary antibody, Alexa Fluor 488 (Jackson ImmunoResearch, 703-545-155; 1:500), donkey anti-rabbit IgG (H + L) secondary antibody, Alexa Fluor 546 (Invitrogen, A10040) and DAPI (Invitrogen, D1306; 1:500 dilution). All primary antibodies were validated by the manufacturers (see datasheets and manufacturer websites). Additional validation was supported by previous literature1,54. Recombinant mouse leptin was obtained from Amylin Pharmaceuticals (R&D Systems, 498-OB). Clenbuterol hydrochloride (C5423), dobutamine hydrochloride (D0676), mirabegron (SML2480) and butoxamine hydrochloride (sc-234233) were purchased from Sigma-Aldrich, Merck and Santa Cruz Biotechnology, respectively.
Dietary challenge
When C57BL/6 WT mice or both LeprCre: Rosa26-LSL-ChR2-YFP mice, LeprCre: Adrb2fl/fl mice, and respective controls LeprCre and Adrb2fl/fl, reached 8 weeks of age, a regular chow diet was replaced with a HFD. The HFD was a defined, lard-based diet with 60% energy from fat, 20% energy from carbohydrate and 20% energy from protein (Research Diets, D12492). This feeding regime lasted 10–12 weeks, with the exact duration specified in the figure legends. For the normal diet challenge, the mice were kept on a regular chow diet since weaning, and the body weight and food intake were measured from the age of 6 weeks to the age of 16 weeks. Food intake was exchanged and measured weekly every Wednesday morning (at the beginning of the light cycle) from the onset of the dietary challenge. Food intake was measured by subtracting the weight of the food left in the cage from the original weight of the food added to the cage. The average daily food intake per mouse was then calculated for each week. The results represent the average daily food intake per mouse in grams. Body weight was measured at the same time as food intake was measured.
Metabolic monitoring
The Promethion Core CGF system (Sable Systems International, North Las Vegas) was used to evaluate metabolic profiles and physical activity of the mice. Mice were housed in individual cages with free access to food and water, under a 12-h light–dark cycle, at a controlled RT (21–23 °C) and humidity. After acclimatization for 48 h, levels of VO2, VCO2, energy expenditure, RER and locomotor activity were measured every 10 min for 3–4 days. The body weight and food intake were measured immediately before placement into the indirect calorimetry cage and again upon removal. Promethion data analysis software package, Macro Interpreter (version 23.4.0) by Sable System, was used to conduct primary data processing. Data for energy expenditure, VO2 and VCO2 were analysed with general linear model ANCOVA in SPSS (IBM) using body weight as a covariate, as previously suggested55,56. RER and total activity were analysed by ANOVA.
Temperature measurements
BAT temperature was measured using an E96 Advanced Thermal Imaging Camera (FLIR). The interscapular region of the mice was shaved 2 days before thermal imaging to avoid stress-induced BAT activity. The thermal images of single-housed freely moving mice were captured at 20 cm from the cage at 22 °C. All thermal imaging analysis was carried out under blinded conditions using FLIR Tools software. The average interscapular surface and tail temperature was calculated from at least five thermal images of each mouse as shown56. Rectal temperature was measured using a thermal probe (Physitemp). The core body temperature of unanaesthetized, awake mice was measured using a rectal probe (Precision) under normal housing conditions (22 ± 2 °C). The probe was lubricated with Vaseline before insertion into the anus (1.5 cm). During the measurements, mice were lightly restrained in a cotton glove for no more than 20 s.
Body composition
Total body fat mass and lean mass were assessed by quantitative nuclear magnetic resonance spectroscopy using a fully automatic EchoMRI system (Echo Medical Systems) as shown56,57. After completion of the normal diet and HFD challenges, mice were euthanized, and fat tissues, including inguinal (scWAT), epididymal (visceral WAT) and interscapular BAT, and key skeletal muscles such as quadriceps, gastrocnemius and soleus were isolated and weighed. Samples were snap-frozen and stored at −80 °C until processing.
Leptin-neutralizing antibody treatment
We followed the treatment regime documented in a previous report36. WT mice were fed with a HFD for 12 weeks to induce obesity. The mice were then divided into two groups and treated with either a human leptin-neutralizing monoclonal antibody (kindly provided by P. Scherer, The University of Texas Southwestern Medical Center) or an isotype control antibody (a human IgG1 monoclonal antibody). The antibodies were administered via intraperitoneal injection twice a week for 3 weeks, while mice were kept on a HFD during the whole period. Body weight and food intake were measured weekly. After 3 weeks of antibody treatment, mice were euthanized for the collection of sympathetic nerve fibres from subcutaneous WAT and interscapular BAT.
Clenbuterol administration
For chronic clenbuterol treatment, we followed the treatment regimen described by Meister et al.37. Mice were first challenged with a HFD for 12 weeks to become obese. HFD-induced obese mice (DIO) were then randomly assigned to two groups: (1) the control group, which received regular drinking water, and (2) the clenbuterol group, which received clenbuterol (Sigma-Aldrich, C5423; 30 mg l−1) via drinking water for 5 days. Both groups were kept on a HFD throughout the experiment. During the 5-day treatment period, no difference in water intake was observed between the clenbuterol-treated mice (3.45 ml ± 0.95 ml per mouse per day) and the control mice (3.83 ml ± 0.25 ml per mouse per day). Following the treatment period, mice were euthanized, and the sympathetic nerve fibres were isolated from subcutaneous WAT and interscapular BAT, fixed overnight and stored at 4 °C in 1× PBS until further processing.
Tissue collection and dissociation for scRNA-seq
scRNA-seq was performed as previously described58. Ten adult C57BL/6 males were euthanized at 24 weeks of age, and sympathetic ganglia (SCG and stellate ganglia) were quickly extracted under a stereomicroscope. Tissue was digested for 30 min with collagenase (2.5 mg ml−1) and DNase (5 U ml−1) in HBSS at 37 °C, washed and further digested with trypsin (0.25%) for 30 min at 37 °C with shaking. The samples were mechanically triturated, and the cell suspension was then filtered through a 40-μm cell strainer and centrifuged at 400g for 5 min. After aspiration of the supernatant, the pellet was resuspended in DMEM media with 10% FBS and one volume of 40% wt/vol iodixanol solution. The cell suspension was carefully overlaid with an Optiprep gradient composed of 3 ml 22% wt/vol iodixanol solution and 0.5 ml DMEM and centrifuged at 800g for 25 min. The viable cells were carefully collected from the top interface, and the cell suspension was concentrated to 300 µl by removing the supernatant.
Library preparation, sequencing and alignment
The cell suspension (approximately 10,000 cells per channel) was then loaded onto the single-cell 3′ chip and placed on a 10x Genomics chromium controller instrument to generate single-cell GEMs. scRNA-seq libraries were prepared using the chromium single-cell 3′ library & cell bead kit according to the manufacturer’s protocol. Libraries were sequenced with an Illumina NextSeq 500 platform to a depth of approximately 300 million reads per library with 2 × 50-bp read length. The Cell Ranger Single Cell Software Suite v.2.0.1 was used to perform sample de-multiplexing, alignment, filtering and unique molecular identifier counting.
Cell clustering and cell-type annotation
The cluster identities and filtered gene matrices generated by Cell Ranger software were used as input into the open-source R toolkit Seurat (v.4.1.2)59 to produce UMAP, feature plots, violin plots of the mean and variance of the mean and variance of gene expression density. Cell barcodes with <500 transcripts detected or >25% mitochondrial gene expression were first filtered out as low-quality cells. The gene counts for each cell were divided by the total gene counts for the cell and multiplied by a scale factor of 10,000, then log2 transformation was applied to the counts. The FindVariableFeatures function was used to select variable genes with default parameters. The ScaleData function was used to scale and centre the counts in the dataset. Principal component analysis was performed on the variable genes, and 20 principal components were used for cell clustering (resolution of 0.5) and UMAP dimensional reduction. The cluster markers were found using the FindAllMarkers function, and cell types were manually annotated based on the cluster markers in the literature. Module scores were calculated using the AddModuleScore function with default parameters and used to validate certain cell-type annotations. To calculate the sample composition based on cell type, the number of cells for each cell type from each sample was counted. The counts were then divided by the total number of cells for each sample and scaled to 100% for each cell type. In the co-expression analysis, the cells having the expression threshold for both genes more than 0.75 are considered to be positive (True) for normalized co-expression. For visualization of gene expression, count data for each run was denoised using a deep count autoencoder60, with default parameters, to be then merged before plotting.
Immunofluorescence microscopy
Mice were perfused with 1× PBS, and sympathetic ganglia and nerve bundles were extracted under the stereomicroscope and fixed in 4% paraformaldehyde (PFA) overnight at 4 °C with shaking. For images in Figs. 1d and 4c,d,f, we used frozen sections, and the fixation step was followed by cryoprotection in 30% sucrose (Alfa Aesar). Sections (15 µm) were obtained in a Leica Cryostat CM3050 S. For images in Fig. 3c,e, whole-mount tissues were used. Both frozen sections and whole-mount tissues were washed with PBS for 10 min, which was followed by incubation in a blocking and permeabilization solution (3% BSA, 2% goat or donkey serum based on the host species of secondary antibodies, 0.1% Tween and 0.1% sodium azide in 1× PBS) for 1 h at RT with (whole mounts) or without (frozen sections) shaking. The samples were then incubated with primary antibodies overnight at 4 °C with (whole mounts) or without (frozen sections) agitation. The following dilutions of primary antibodies were used: anti-GFP (1:1,000 dilution), anti-TH (1:500 dilution), anti-CAV1 (1:1,000 dilution), anti-GLUT1 (1:200 dilution), anti-TNFR1 (1:500 dilution), anti-VEGFR2 (1:500 dilution), anti-TUBB3 (1:1,000 dilution) and anti-VE-cadherin (1:100 dilution). The anti-GFP antibody was used to detect the YFP-tagged LEPR cells. After washing, secondary antibodies (1:500 dilution) were applied for 1 h at RT, with or without (in the case of frozen sections) shaking. After incubation with secondary antibodies, tissues were washed with 1× PBS and was followed by incubation with DAPI (1:1,000 dilution) for 5 min (frozen sections) or 30 min (whole mounts). After DAPI staining, tissues were washed and mounted with ProLong Gold Antifade reagent (Life Technology, P36930). The slides were dried overnight at RT and stored at 4 °C.
Images were acquired with a Zeiss LSM 780 inverted confocal microscope. Analysis and quantification of acquired images were performed using Fiji61. For representative images, linear adjustments were made to brightness and contrast, whereas for quantification, all channels were kept unchanged. Two to five randomly selected samples per mouse from three to seven independent mice from each experimental group were quantified. High-resolution images were acquired with a confocal laser scanning microscope (Zeiss LSM 980), equipped with an Airyscan detection unit. To maximize the resolution enhancement, we used high-NA oil immersion alpha Plan-Apochromat ×40/1.4-NA Oil DIC M27 objectives (Zeiss). Detector gain and pixel dwell times were adjusted for each dataset, keeping them at their lowest values to avoid saturation and bleaching effects.
RNAscope dual ISH and immunofluorescence
Mice at 8 weeks age were perfused transcardially with PBS (pH 7.4). Tissues (brain, SCG, stellate ganglia, sympathetic nerve bundles, BAT, scWAT, VAT, heart, pancreas, muscle, liver, small intestine, trachea, lung and bladder) were immediately removed from the perfused mice and fixed in 10% neutral buffered formalin (Sigma-Aldrich) overnight at RT before being transferred to 70% ethanol. The hypothalamic region was isolated from the whole fixed brain as described previously62. Samples were dehydrated and embedded in paraffin using standard procedures and then sectioned at 5 µm onto SuperFrost Plus slides (Fisher Scientific). Dual ISH and immunofluorescence was performed using the RNAscope LS Multiplex Fluorescent Reagent Kit (323275) and RNA-Protein Co-detection Ancillary Kit (323180) together with Opal 520/570/690 Fluorophore Reagent pack detection (1:1,000 dilution, FP1487001KT/FP1488001KT/FP1497001KT) on the Leica BOND RX Fully Automated Research Stainer (Leica) according to the manufacturer’s instructions. The primary antibodies used for immunofluorescence were rabbit anti-CAV1 (1:10,00 dilution), rabbit anti-GLUT1 (1:200 dilution), rabbit anti-TH (1:1,000 dilution), rabbit anti-PECAM1 (1:2,000 dilution) and rabbit anti-NeuN (1:500 dilution) combined with a BrightVision goat anti-rabbit poly-HRP detection system (Immunologic). For ISH, the following RNAscope target probes from ACD were used: Lepr (Mm-Lepr-tv1, ACD 471178) and Adrb2 (Mm-Adrb2-XRn-C2, ACD 1172758-C2), positive control probes: Th (Mm-Th-XRn-C2, ACD, 870118-C2) and Polr2a (Mm-Polr2a, ACD 312478), or negative control probe DapB (ACD, 312038). Slides were counterstained with spectral DAPI and then cover-slipped with ProLong Gold Antifade reagent (Thermo Fisher Scientific).
Fluorescence slide scans were acquired with an Olympus VS200 slide scanner (Olympus) using a ×40 (0.95-NA) air objective and a DAPI/CY3/CY5 filter set. Images were visualized and processed with Olympus OlyVIA 3.8 software. High-resolution images were captured in ×40 MPLX_4Y Airyscan or ×40 Airyscan SR mode. Image quantification was performed using Fiji61. Cell counting was performed manually. To quantify the Lepr+Adrb2+ neurons or endothelial cells in the arcuate hypothalamus, trachea, lung and bladder images were captured from 3–8 sections per mouse, and a total of three to five mice were independently analysed. The percentages of Lepr+, Adrb2+ or Lepr+Adrb2+ cells in NeuN+ neurons or PECAM1+ endothelial cells were calculated by dividing the total fluorescence Lepr+Adrb2+ or Lepr+Adrb2+ mRNA counts by the total number of NeuN+ or PECAM1+ cells, respectively. Percentage positive cell values were imported into Prism (GraphPad) for graphing and statistical analysis. As previously described63, RNAscope ISH was performed to detect ADRB2 and LEPR mRNA in post-mortem human stellate ganglia using the RNAscope Multiplex Fluorescent v2 Assay (323100, Advanced Cell Diagnostics, a Bio-Techne brand), following the manufacturer’s instructions. Fixed frozen ganglia were cryosectioned at 10 µm, mounted on Superfrost Plus slides, and hybridized with probes targeting Hs-ADRB2 (450641, detected in Cy5) and Hs-LEPR (410371-C2, detected in Cy3). After RNAscope, immunofluorescence for caveolin-1 (CAV1) was performed with rabbit anti-CAV1 (D46G3) XP monoclonal antibody (Cell Signaling Technology, 3267; 1:500 dilution). The sections were imaged using confocal microscopy (Leica TCS SP8) and a motorized scanning stage fluorescence microscope (AxioObserver Z1, Zeiss).
Electron microscopy
Sympathetic nerve bundles dissected from scWAT of lean and HFD-fed obese mice were fixed with 2% PFA and 2.5% glutaraldehyde (Electron Microscopy Services) in 0.1 M sodium cacodylate buffer. After several rinses in sodium cacodylate buffer, samples were postfixed in 1% osmium tetroxide, 1.5% potassium ferricyanide in 0.1 M sodium cacodylate buffer for 2 h on ice. Samples were dehydrated with a crescent concentration of ethanol, washed with propylene oxide, and infiltrated in a mixture of propylene oxide/epoxy resin overnight. The resin was then substituted with fresh epoxy resin, and samples were embedded in silicone moulds. Then, after being cured for 48 h at 60 °C, resin blocks were cut into ultrathin sections (70–90 nm) using an ultramicrotome (UC7, Leica microsystem, Vienna, Austria), longitudinal sections of nerve bundles were collected on copper formvar carbon-coated slot grids, stained with uranyl acetate and Sato’s lead solutions and observed in a Transmission Electron Microscope Talos L120C (FEI, Thermo Fisher Scientific) operating at 120 kV. Images were acquired with a Ceta CCD camera (FEI, Thermo Fisher Scientific). For quantification of the perineurial layers for each fibre, 20 random images were acquired along the external fibre profile and quantified manually using ImageJ software61.
Sympathetic ganglia explant cultures
Ganglia explant culture was performed as previously described49. SCG and stellate ganglia were removed from mice aged 8 weeks under a stereomicroscope and placed in DMEM (Invitrogen). Ganglia were cleaned from the surrounding tissue and transferred into eight-well chamber slides (µ-slide 8 well, ibidi, 80826) that were previously coated with poly-D-lysine (Sigma-Aldrich) in accordance with the manufacturer’s instructions. Ganglia were then covered with 5 µl of Matrigel (BD Bioscience) and incubated for 7 min at 37 °C. The culture medium (DMEM without phenol red (Invitrogen), 10% FBS (Invitrogen), 2 mM l-glutamine (Biowest), nerve growth factor (1:1,000 dilution; Sigma-Aldrich) and 1% penicillin–streptomycin) was subsequently added. Twelve ganglia explant cultures (six SCG and six stellate) were prepared for each condition. Ganglia were cultured for a minimum of 24 h before further manipulation. After 24 h, ganglia cultures were washed once with the culture media. The stimulation protocol in Supplementary Fig. 6b was performed for 24 h with the following concentrations of drugs: low leptin (10 ng ml−1), high leptin (100 ng ml−1)32, high leptin (100 ng ml−1) + a sympathomimetic Adrb2 agonist (clenbuterol hydrochloride; 10 µg ml−1)64, high leptin (100 ng ml−1) + an Adrb3 agonist (Mirabegron; 10 µM)65 and high leptin (100 ng ml−1) + an Adrb1 agonist (dobutamine; 50 µM)66. For Supplementary Fig. 6d, the explant was stimulated for 24 h with the following concentrations: low leptin (10 ng ml−1), low leptin (10 ng ml−1) + high clenbuterol (100 µg ml−1) and low leptin (10 ng ml−1) + high clenbuterol (200 µg ml−1). In Fig. 5e, the stimulation protocol was applied for 24 h using the following drug concentrations: low leptin (10 ng ml−1), high leptin (100 ng ml−1), high leptin (100 ng ml−1) + clenbuterol (10 µg ml−1) and high leptin (100 ng ml−1) + clenbuterol (10 µg ml−1) + butoxamine (10 µM). Butoxamine was added 30 min before the administration of clenbuterol67. The next day, the cultures were washed once with ice-cold 1× PBS for 5 min. The explant cultures were then fixed with 4% PFA overnight at 4 °C with agitation, cryoprotected in 30% sucrose and subsequently sectioned by cryostat for immunostaining.
Plasma isolation and protein extraction from fat tissue for biochemical assays
For terminal blood collection, mice were euthanized via intraperitoneal injection with 10 μl per gram body weight pentobarbital. Blood was collected from the left ventricle using 25-gauge needles and syringes pre-coated with 100 mM EDTA. The blood was then added into tubes containing 5 μl of 100 mM EDTA and centrifuged at 1,000g at 4 °C for 15 min to separate plasma. The supernatant was carefully transferred to a new tube. The concentration of leptin was determined using a Mouse Leptin ELISA Kit (Invitrogen, KMC2281).
Proteins were extracted from interscapular BAT and scWAT fat tissues as previously described68. Briefly, fat depots were dissected and placed into homogenizing tubes filled with 50 μl of lysis buffer per 30 mg of tissue. The lysis buffer consisted of 4 mM sodium metabisulfite (Affa Aesar, A17351), 1 mM EDTA (Invitrogen, 15575-020), 0.01 M HCL and 1× protease inhibitor (CST 5872). Samples were homogenized using a Precellys 24 homogenizer at 5,500 rpm for 60 s. Lipids were removed from the tissue homogenate by centrifugation at 17,000g at 4 °C for 15 min, and the clear phase was collected. The centrifuge step was repeated three times to remove lipids completely. The concentration of noradrenaline in the scWAT and BAT was determined using a noradrenaline ELISA kit (Ultra Sensitive, Immusmol, BA-E-5200R).
Gene expression analysis
Total RNA from BAT tissue was extracted using the TRIzol–chloroform method (Invitrogen) according to the manufacturer’s instructions and treated with DNase (Biolabs) for 30 min at 37 °C to exclude any DNA contamination. Following RNA extraction, 1 µg of total RNA was converted to cDNA using SuperScript II Reverse Transcriptase (Invitrogen, 18064-022). The RT–qPCR reactions were performed using the SYBR Green PCR master mix (LifeTech 4368706). All real-time qPCR reactions were run in duplicate on 96-well plates using the StepOnePlus Real-Time PCR System. Data were calculated using the ∆∆Ct method and normalized against the expression of Hprt. Normalized expression levels were presented relative to their appropriate control (=1). The primers are listed in Supplementary Table 3.
TUNEL assay
Freshly isolated sympathetic ganglia were fixed in 4% PFA overnight at 4 °C, embedded in OCT compound and sectioned at a thickness of 4 µm. Sections were then incubated in 0.1% Triton X-100 for 2 min, followed by the addition of Proteinase K solution for 15 min. The sections were subsequently blocked in 3% BSA in PBS for 30 min. Following pretreatments, TUNEL staining was performed using the in situ BrDU-Red DNA Fragmentation (TUNEL) assay kit from Abcam (ab66110) according to the manufacturer’s instructions. Slides were imaged using a Zeiss LSM 980 confocal microscope.
Quality control in the UKB
LEPR and ADRB2 variants were extracted from the whole-exome sequencing data from 470,000 UKB individuals. Variants were required to pass the following criteria to be selected: 10× minimum coverage, genotype quality score ≥ 20, quality score ≥ 30, 0.2 ≤ heterozygote alternative allele ratio ≤ 0.8, 0.8 ≤ homozygote alternative allele ratio ≤ 1.0, mapping quality score ≥ 40 and DPGLnexus variant status = PASS. Furthermore, for both genes, variants with minor allele frequency < 0.01 and Hardy–Weinberg equilibrium P > 1 × 10⁻¹² or variants with minor allele frequency ≥ 0.01 and Hardy–Weinberg equilibrium P > 1 × 10⁻⁶, outside the targeted CCDS boundaries (https://www.ncbi.nlm.nih.gov/projects/CCDS/CcdsBrowse.cgi/) and with a call rate < 0.9 were removed before analysis.
Interaction between LEPR and ADRB2 in the UKB
To mitigate a possible increase of variance estimates due to relatedness, we sought to remove individuals up to third-degree relatives from our analyses using KING (v2.2.3)69. We then selected a total of 346,177 European unrelated individuals with BMI measures to investigate gene–gene interaction analyses between LEPR and ADRB2 genes. Qualifying single-nucleotide polymorphisms (SNPs) were tested for their association with the continuous biomarker using a linear regression with an interaction variable and adjusted for age, sex, array and PC1–PC10 using the SNPassoc R package70. The interaction model used was: Trait ~ β0 + β1 × SNP1 + β2 × SNP2 + β3 × (SNP1 × SNP2) + βn × covariaten. The significance threshold for interaction was defined by traits using a Bonferroni correction P = 0.05/(n SNP).
Protein modelling and molecular dynamics
The sequences we fed into AF2 were retrieved from UniProt for LEPR (P48357) and ADRB2 (P07550). The sequence span for the analysed constructs was the following: LEPR D1 (124-236), LEPR D1–D7 (124–830) and ADRB2 (1–413). AF2 predictions were performed using the ColabFold implementation71 installed locally, using default parameters, and MMseqs2 (ref. 72) for creating multiple sequence alignments. The models were subsequently relaxed with AMBER using ColabFold, using default parameters. AF2 mainly reports two metrics for data analysis: the predicted local distance difference test and the predicted alignment error (PAE). A predicted local distance difference test above 90 is considered very confident. Values between 70 and 90 are considered reasonably accurate, while those below 70 are less confident. The PAE metric provides a visualization of the errors at the residue-residue level. The PAE matrix provides a granular view of where the model might be uncertain about the distances between residues. It is a value between 0 and 30 (Å), where higher values (red) in the PAE heat map indicate regions where the model is less confident and the actual distance might be farther or closer than predicted. Molecular dynamics simulations for ADRB2 WT and the Q27E polymorphism were performed on the active state structure bound to adrenaline (Protein Data Bank (PDB) 4LDO)73. Missing loops were not seen in the crystal density, and the N-terminal tail was added using MODELLER74. The molecular dynamics set-up was performed using the CHARMM-GUI molecular modelling suite75 following established protocols76. For the LEPR–Leptin dimer system, we performed coarse-grained molecular dynamics simulations and used as a starting structure the recently solved cryogenic electron microscopy structure (PDB 8DH8) by Saxton et al.77. Missing side chains were added with PyRosetta. Calculations of the fraction of native contacts and RMSF and RMSD calculations were performed using MDTraj78. Concurrence plot calculations were performed using Contact Map Explorer (https://contact-map.readthedocs.io/) with a 4.5 Å threshold. Contacts being present in more than 80% of simulation time were analysed.
Human ganglia single-nuclei RNA-seq
Nuclei were isolated from human superior cervical and stellate ganglia as previously described54,79. The raw sequencing data were processed using Cell Ranger (v6.0.1, 10x Genomics) with intronic read inclusion, aligned to the GRCh38 v39 human reference genome (Genome Reference Consortium) and further corrected for technical artefacts using CellBender (https://github.com/broadinstitute/CellBender/). Downstream analysis, including quality control, data integration, dimensionality reduction and unsupervised clustering, was performed using Seurat (v5). Nuclei were excluded if they contained <500 or >2,000 detected genes, or if >1.0% of transcripts were mitochondrial. Sex assignment was based on genetic de-multiplexing and expression of sex-specific marker genes. A total of 11,228 nuclei were uniquely assigned, with 5,013 of these assigned to nuclei from female individuals and 6,215 to nuclei from male individuals. Plots were generated using SCpubr.
Lentiviral overexpression of LEPR and ADRB2 in HUVECs and drug treatments
Primary HUVECs (PromoCell, C-12200) were maintained in endothelial growth medium with supplement mix. The lentiviral vector system was used to transduce the cells with LEPR and ADRB2. VectorBuilder was used to design viral vectors. To check the transfection efficiency, a dual-reporter gene system was used. For instance, a drug-resistant gene (for example, puromycin or blasticidin) was used to select the cells transduced with the vector. A fluorescence tag (V5 or FLAG) was used to confirm the overexpression of our proteins of interest by immunofluorescence. WT HUVECS and LEPR+ADRB2+ HUVECS were treated with the following concentrations of drugs: low leptin (10 ng ml−1), high leptin (100 ng ml−1), high leptin (100 ng ml−1) + a sympathomimetic ADRB2 agonist (clenbuterol hydrochloride; 10 µg ml−1) for 24 h. After 24 h, cells were fixed with 4% PFA in PBS and processed for combined immunostaining and the Click-iT TUNEL assay.
Statistics
Statistical analyses were performed with GraphPad (Prism 9.3.1) using an unpaired Student’s t-test (two-tailed) to compare two groups, one-way ANOVA with Turkey’s post hoc test to compare more than two groups and two-way ANOVA with Turkey’s post hoc test to compare two-factor study design. Metabolic parameters such as energy expenditure, VO2 and VCO2 were analysed with ANCOVA using body weight as a covariate. The data are shown as the mean ± s.e.m. unless stated otherwise. For all tests, P < 0.05 was considered significant. All data points represent individual biological samples. Data distribution was assumed to be normal, but this was not formally tested. All ex vivo and in situ experiments were performed at least two times. No statistical methods were used to predetermine sample size, but the sample size was similar to those generally used in the field49,80. Randomization was used whenever possible. Data collection and analysis were not performed blind to the conditions of the experiments.
Reporting summary
Further information on research design is available in the Nature Portfolio Reporting Summary linked to this article
Data availability
The raw single-cell sequencing data of sympathetic ganglia supporting the findings in this study have been deposited in the Gene Expression Omnibus (GEO) under accession code GSE233163. The raw data of the public dataset reanalysed in this study can be found in the GEO repository under the following accession codes: Tabula Muris (GSE109774 and GSE93374), mouse sympathetic ganglia (GSE231767), dorsal root ganglia (GSE175421), nodose ganglia (GSE124312), sciatic nerve (GSE137870), MCA (GSE108097), Tabula Muris Senis (GSE132042), WAT (mouse, GSE17617; human, GSE155960), BAT (mouse, GSE207707; human, E-MTAB-9199), human sympathetic ganglia (GSE241386) and Mouse Organogenesis Cell Atlas (GSE119945). The Seurat object containing the HypoMap dataset is available via https://doi.org/10.17863/CAM.87955. Source data are provided with this paper.
Code availability
No custom code or mathematical algorithm was created in this work. The code used to create figures from scRNA-seq dataset and all additional input data files can be found on GitHubObesity. Please direct any other bioinformatic inquiries to G.S
References
Zeng, W. et al. Sympathetic neuro-adipose connections mediate leptin-driven lipolysis. Cell163, 84–94 (2015)
Caron, A., Lee, S., Elmquist, J. K. & Gautron, L. Leptin and brain–adipose crosstalks. Nat. Rev. Neurosci.19, 153–165 (2018)
Zhang, Y. et al. Leptin-receptor-expressing neurons in the dorsomedial hypothalamus and median preoptic area regulate sympathetic brown adipose tissue circuits. J. Neurosci.31, 1873–1884 (2011)
Jiang, L. et al. Leptin receptor-expressing neuron Sh2b1 supports sympathetic nervous system and protects against obesity and metabolic disease. Nat. Commun.11, 1517 (2020)
Liu, Q., Wang, X. & Yi, S. Pathophysiological changes of physical barriers of peripheral nerves after injury. Front. Neurosci.12, 597 (2018)
Stuart, T. et al. Comprehensive integration of single-cell data. Cell177, 1888–1902 (2019)
Frank, P. G., Woodman, S. E., Park, D. S. & Lisanti, M. P. Caveolin, caveolae, and endothelial cell function. Arterioscler. Thromb. Vasc. Biol.23, 1161–1168 (2003)
Chen, B., Banton, M. C., Singh, L., Parkinson, D. B. & Dun, X. P. Single cell transcriptome data analysis defines the heterogeneity of peripheral nerve cells in homeostasis and regeneration. Front. Cell. Neurosci.15, 624826 (2021)
Wolbert, J. et al. Redefining the heterogeneity of peripheral nerve cells in health and autoimmunity. Proc. Natl. Acad. Sci. USA117, 9466–9476 (2020)
Fujimoto, N. et al. Single-cell mapping reveals new markers and functions of lymphatic endothelial cells in lymph nodes. PLoS Biol.18, e3000704 (2020)
DeFalco, J. et al. Virus-assisted mapping of neural inputs to a feeding center in the hypothalamus. Science291, 2608–2613 (2001)
Shanthaveerappa, T. R. & Bourne, G. H. The perineural epithelium of sympathetic nerves and ganglia and its relation to the pia arachnoid of the central nervous system and perineural epithelium of the peripheral nervous system. Z. Zellforsch. Mikrosk. Anat.61, 742–753 (1963)
Gerber, D. et al. Transcriptional profiling of mouse peripheral nerves to the single-cell level to build a sciatic nerve atlas (SNAT). eLife10, e58591 (2021)
Piña, A. R., Martínez, M. M. & de Almeida, O. P. Glut-1, best immunohistochemical marker for perineurial cells. Head Neck Pathol.9, 104–106 (2014)
François, M. et al. Sympathetic innervation of the interscapular brown adipose tissue in mouse. Ann. N. Y. Acad. Sci.1454, 3–13 (2019)
Huesing, C. et al. Sympathetic innervation of inguinal white adipose tissue in the mouse. J. Comp. Neurol.529, 1465–1485 (2021)
Lafontan, M. & Berlan, M. Fat cell adrenergic receptors and the control of white and brown fat cell function. J. Lipid Res.34, 1057–1091 (1993)
Schaum, N. et al. Single-cell transcriptomics of 20 mouse organs creates a Tabula Muris. Nature562, 367–372 (2018)
Yu, Z. et al. Single-cell transcriptomic map of the human and mouse bladders. J. Am. Soc. Nephrol.30, 2159–2176 (2019)
Almanzar, N. et al. A single cell transcriptomic atlas characterizes aging tissues in the mouse. Nature583, 590–595 (2020)
Emont, M. P. et al. A single-cell atlas of human and mouse white adipose tissue. Nature603, 926–933 (2022)
Burl, R. B., Rondini, E. A., Wei, H., Pique-Regi, R. & Granneman, J. G. Deconstructing cold-induced brown adipocyte neogenesis in mice. eLife11, e80167 (2022)
Han, X. et al. Mapping the mouse cell atlas by microwell-seq. Cell172, 1091–1107 (2018)
Fei, L. et al. Systematic identification of cell-fate regulatory programs using a single-cell atlas of mouse development. Nat. Genet.54, 1051–1061 (2022)
Mapps, A. A. et al. Diversity of satellite glia in sympathetic and sensory ganglia. Cell Rep.38, 110328 (2022)
Kupari, J., Häring, M., Agirre, E., Castelo-Branco, G. & Ernfors, P. An atlas of vagal sensory neurons and their molecular specialization. Cell Rep.27, 2508–2523 (2019)
Mercer, J. G. et al. Localization of leptin receptor mRNA and the long form splice variant (Ob-Rb) in mouse hypothalamus and adjacent brain regions by in situ hybridization. FEBS Lett.387, 113–116 (1996)
Kang, Y. M., Ouyang, W., Chen, J. Y., Qiao, J. T. & Dafny, N. Norepinephrine modulates single hypothalamic arcuate neurons
Buettner, C. et al. Leptin controls adipose tissue lipogenesis(2008)
Rahmouni, K., Sigmund, C. D., Haynes, W. G. & Mark, A. L. Hypothalamic ERK mediates the anorectic and thermogenic sympathetic effects of leptin. Diabetes58, 536–542 (2009)
Steuernagel, L. et al. HypoMap—a unified single-cell gene expression atlas of the murine hypothalamus. Nat. Metab.4, 1402–1419 (2022)
Wang, P. et al. A leptin–BDNF pathway regulating sympathetic innervation of adipose tissue. Nature583, 839–844 (2020)
Blaszkiewicz, M. et al. Neuropathy and neural plasticity in the subcutaneous white adipose depot. PLoS ONE14, e0221766 (2019)
Ge, S. X., Jung, D., Jung, D. & Yao, R. ShinyGO: a graphical gene-set enrichment tool for animals and plants. Bioinformatics36, 2628–2629 (2020)
Zhao, X. et al. Activation of the leptin pathway by high expression of the long form of the leptin receptor (Ob-Rb) accelerates chondrocyte senescence in osteoarthritis. Bone Joint Res.8, 425–436 (2019)
Zhao, S. et al. Partial leptin reduction as an insulin sensitization and weight loss strategy. Cell Metab.30, 706–719 (2019)
Meister, J. et al. Clenbuterol exerts antidiabetic activity through metabolic reprogramming of skeletal muscle cells. Nat. Commun.13, 22 (2022)
Hildreth, A. D. et al. Single-cell sequencing of human white adipose tissue identifies new cell states in health and obesity. Nat. Immunol.22, 639–653 (2021)
Sun, W. et al. snRNA-seq reveals a subpopulation of adipocytes that regulates thermogenesis. Nature587, 98–102 (2020)
Angeli, C. B. et al. Multilocus analyses of seven candidate genes suggest interacting pathways for obesity-related traits in Brazilian populations. Obesity19, 1244–1251 (2011)
Pereira, T. V., Mingroni-Netto, R. C. & Yamada, Y. ADRB2 and LEPR gene polymorphisms: synergistic effects on the risk of obesity in Japanese. Obesity19, 1523–1527 (2011)
Bertoline, L. M. F., Lima, A. N., Krieger, J. E. & Teixeira, S. K. Before and after AlphaFold2: an overview of protein structure prediction. Front. Bioinform.3, 1120370 (2023)
Hegedűs, T., Geisler, M., Lukács, G. L. & Farkas, B. Ins and outs of AlphaFold2 transmembrane protein structure predictions. Cell. Mol. Life Sci.79, 73 (2022)
Azzaz, F., Yahi, N., Chahinian, H. & Fantini, J. The epigenetic dimension of protein structure is an intrinsic weakness of the AlphaFold program. Biomolecules12, 1527 (2022)
Heydenreich, F. M. et al. Molecular determinants of ligand efficacy and potency in GPCR signaling. Science382, eadh1859 (2023)
Martinez-Sanchez, N. et al. The sympathetic nervous system in the 21st century: neuroimmune interactions in metabolic homeostasis and obesity. Neuron110, 3597–3626 (2022)
Hostrup, M. & Onslev, J. The beta2 -adrenergic receptor – a re-emerging target to combat obesity and induce leanness? J. Physiol.600, 1209–1227 (2022)
Knight, Z. A., Hannan, K. S., Greenberg, M. L. & Friedman, J. M. Hyperleptinemia is required for the development of leptin resistance. PLoS ONE5, e11376 (2010)
Pirzgalska, R. M. et al. Sympathetic neuron-associated macrophages contribute to obesity by importing and metabolizing norepinephrine. Nat. Med.23, 1309–1318 (2017)
LeDuc, C. A. & Leibel, R. L. Auto-regulation of leptin neurobiology. Cell Metab.30, 614–616 (2019)
Noid, W. G. Perspective: advances, challenges, and insight for predictive coarse-grained models. J. Phys. Chem. B127, 4174–4207 (2023)
Marrink, S. J. et al. Two decades of martini: better beads, broader scope. Wiley Interdiscip. Rev. Comput. Mol. Sci.13, e1620 (2023)
Green, S. A., Turki, J., Liggett, S. B. & Innis, M. Amino-terminal polymorphisms of the human β2-adrenergic receptor impart distinct agonist-promoted regulatory properties. Biochemistry33, 9414–9419 (1994)
Haberman, E. R. et al. Immunomodulatory leptin receptor+ sympathetic perineurial barrier cells protect against obesity by facilitating brown adipose tissue thermogenesis. Immunity57, 141–152 (2024)
Tschöp, M. H. et al. A guide to analysis of mouse energy metabolism. Nat. Methods9, 57–63 (2011)
Milbank, E. et al. Small extracellular vesicle-mediated targeting of hypothalamic AMPKα1 corrects obesity through BAT activation. Nat. Metab.3, 1415–1431 (2021)
Tinsley, F. C., Taicher, G. Z. & Heiman, M. L. Evaluation of a quantitative magnetic resonance method for mouse whole body composition analysis. Obes. Res.12, 150–160 (2004)
Furlan, A. et al. Visceral motor neuron diversity delineates a cellular basis for nipple- and pilo-erection muscle control. Nat. Neurosci.19, 1331–1340 (2016)
Satija, R., Farrell, J. A., Gennert, D., Schier, A. F. & Regev, A. Spatial reconstruction of single-cell gene expression. Nat. Biotechnol.33, 495–502 (2015)
Eraslan, G., Simon, L. M., Mircea, M., Mueller, N. S. & Theis, F. J. Single-cell RNA-seq denoising using a deep count autoencoder. Nat. Commun.10, 390 (2019)
Schindelin, J., Rueden, C. T., Hiner, M. C. & Eliceiri, K. W. The ImageJ ecosystem: an open platform for biomedical image analysis. Mol. Reprod. Dev.82, 518–529 (2015)
Salehi, M. S. A simple method for isolation of the anteroventral periventricular and arcuate nuclei of the rat hypothalamus. Int. J. Exp. Clin. Anat.7, 48–51 (2013)
Ziegler, K. A. et al. Immune-mediated denervation of the pineal gland underlies sleep disturbance in cardiac disease. Science381, 285–290 (2023)
Cardoso, F. et al. Neuro-mesenchyme units control ILC2 and obesity
Riis-Vestergaard, M. J. et al. Beta-1 and not beta-3 adrenergic receptors may be the primary regulator of human brown adipocyte metabolism. J. Clin. Endocrinol. Metab.105, e994–e1005 (2020)
Zhang, X. et al. Chronic stress promotes gastric cancer progression and metastasis: an essential role for ADRB2. Cell Death Dis.10, 788 (2019)
Mahú, I. et al. Brain-sparing sympathofacilitators mitigate obesity without adverse cardiovascular effects. Cell Metab.31, 1120–1135 (2020)
Diaz Marin, R., Crespo-Garcia, S., Wilson, A. M. & Sapieha, P. RELi protocol: optimization for protein extraction from white, brown and beige adipose tissues. MethodsX6, 918–928 (2019)
Manichaikul, A. et al. Robust relationship inference in genome-wide association studies. Bioinformatics26, 2867–2873 (2010)
González, J. R. et al. SNPassoc: an R package to perform whole genome association studies. Bioinformatics23, 644–645 (2007)
Mirdita, M. et al. ColabFold: making protein folding accessible to all. Nat. Methods19, 679–682 (2022)
Steinegger, M. & Söding, J. MMseqs2 enables sensitive protein sequence searching for the analysis of massive data sets. Nat. Biotechnol.35, 1026–1028 (2017)
Ring, A. M. et al. Adrenaline-activated structure of the β2-adrenoceptor stabilized by an engineered nanobody. Nature502, 575–579 (2013)
Šali, A. & Blundell, T. L. Comparative protein modelling by satisfaction of spatial restraints. J. Mol. Biol.234, 779–815 (1993)
Sunhwan, J. et al. CHARMM-GUI: a web-based graphical user interface for CHARMM. J. Comput. Chem.29, 1859–1865 (2008)
Xu, X. et al. Binding pathway determines norepinephrine selectivity for the human β1AR over β2AR. Cell Res.31, 569–579 (2020)
Saxton, R. A. et al. Structural insights into the mechanism of leptin receptor activation. Nat. Commun.14, 1797 (2023)
McGibbon, R. T. et al. MDTraj: a modern open library for the analysis of molecular dynamics trajectories. Biophys. J.109, 1528–1532 (2015)
Ziegler, K. A. et al. Ganglionic inflammation in a patient with Takotsubo syndrome. Circulation151, 890–892 (2025)
Zhu, Y. et al. Sympathetic neuropeptide Y protects from obesity by sustaining thermogenic fat. Nature634, 243–250 (2024)
Acknowledgements
We thank J. Bannebjerg Johansen (Novo Nordisk) for technical assistance with RNAscope, N. Irani from the Micron Bioimaging Facility for guidance with confocal and super-resolution microscopy, C. Wagener (Department of Biology, University of Oxford) for induction to the Sable system, and the members of the Lab of A.D. and NNRCO for discussions and advice on the project. We thank the ALEMBIC facility at San Raffaele Scientific Institute, Milan, Italy for support in electron microscopy analysis. G.S. is funded by a Novo Nordisk Postdoctoral Fellowship run in partnership with the University of Oxford. This work has also been supported by a Wellcome Trust–Howard Hughes Medical Institute International Research Scholar Award (208576/Z/17/Z), an ERC consolidator award (ERC-2017 COG 771431), a 2022 Pfizer ASPIRE Obesity award (70591281) and a BBSRC award (BB/Y006488/1). M.L. received funding from the Ministerio de Ciencia e Innovación co-funded by the FEDER Program of the European Union (PID2021-128145NB-I00).
Author information
Authors and Affiliations
Department of Physiology, Anatomy and Genetics, University of Oxford, Oxford, UK
Gitalee Sarker, Emma Haberman, David S. Oliveira, Karishma Parekh, Emilia Schmid, Samson W. Cheung, Yitao Zhu & Ana Domingos
Research and Development, Novo Nordisk Research Centre Oxford, Oxford, UK
Anandhakumar Chandran, Thomas Monfeuga, Cyrielle Maroteau, Michal Shaked & Enrique M. Toledo
Department of Pathology and Imaging, Global Drug Discovery, Novo Nordisk, Måløv, Denmark
Sofia Lundh
Experimental Imaging Centre, IRCCS San Raffaele Scientific Institute, Milan, Italy
Andrea Raimondi
Institute of Pharmacology and Toxicology, Technical University Munich (TUM), Munich, Germany
Karin Ziegler, Alina Griebel & Stefan Hanns Engelhardt
DZHK (German Centre for Cardiovascular Research), Partner Site Munich Heart Alliance, Munich, Germany
Karin Ziegler
Instituto de Tecnologia Química e Biológica António Xavier, ITQB NOVA, Lisbon, Portugal
Tiago Gomes & Tiago N. Cordeiro
Neurobesity Group, Department of Physiology, Center for Research in Molecular Medicine and Chronic Diseases (CiMUS), Universidade de Santiago de Compostela, Santiago, Spain
Paola Fernández-Sanmartín & Miguel López
Oxford Centre for Diabetes, Endocrinology and Metabolism, Oxford, UK
Noelia Martinez-Sanchez
Helmholtz-Zentrum Dresden-Rossendorf (HZDR), Dresden, Germany
Bernardo A. Arús
Medizinische Fakultät and University Hospital Carl Gustav Carus, Technische Universität Dresden, Dresden, Germany
Bernardo A. Arús
Department of Functional Imaging in Surgical Oncology, National Center for Tumor Diseases (NCT/UCC), Dresden, Germany
Bernardo A. Arús
German Cancer Research Center (DKFZ), Heidelberg, Germany
Bernardo A. Arús
Department of Biology, University of Oxford, Oxford, UK
Sarah C. L. Knowles
Vita-Salute San Raffaele University, Milan, Italy
Matteo Iannacone
Division of Immunology, Transplantation and Infectious Diseases, IRCCS San Raffaele Scientific Institute, Milan, Italy
Matteo Iannacone
Touchstone Diabetes Center, The University of Texas Southwestern Medical Center, Dallas, TX, USA
Philipp E. Scherer
Authors
- Gitalee SarkerView author publications
Search author on:PubMed Google Scholar
- Emma HabermanView author publications
Search author on:PubMed Google Scholar
- Anandhakumar ChandranView author publications
Search author on:PubMed Google Scholar
- Thomas MonfeugaView author publications
Search author on:PubMed Google Scholar
- Cyrielle MaroteauView author publications
Search author on:PubMed Google Scholar
- Sofia LundhView author publications
Search author on:PubMed Google Scholar
- David S. OliveiraView author publications
Search author on:PubMed Google Scholar
- Andrea RaimondiView author publications
Search author on:PubMed Google Scholar
- Karin ZieglerView author publications
Search author on:PubMed Google Scholar
- Tiago GomesView author publications
Search author on:PubMed Google Scholar
- Tiago N. CordeiroView author publications
Search author on:PubMed Google Scholar
- Karishma ParekhView author publications
Search author on:PubMed Google Scholar
- Emilia SchmidView author publications
Search author on:PubMed Google Scholar
- Paola Fernández-SanmartínView author publications
Search author on:PubMed Google Scholar
- Alina GriebelView author publications
Search author on:PubMed Google Scholar
- Noelia Martinez-SanchezView author publications
Search author on:PubMed Google Scholar
- Bernardo A. ArúsView author publications
Search author on:PubMed Google Scholar
- Samson W. CheungView author publications
Search author on:PubMed Google Scholar
- Yitao ZhuView author publications
Search author on:PubMed Google Scholar
- Michal ShakedView author publications
Search author on:PubMed Google Scholar
- Sarah C. L. KnowlesView author publications
Search author on:PubMed Google Scholar
- Stefan Hanns EngelhardtView author publications
Search author on:PubMed Google Scholar
- Matteo IannaconeView author publications
Search author on:PubMed Google Scholar
- Philipp E. SchererView author publications
Search author on:PubMed Google Scholar
- Miguel LópezView author publications
Search author on:PubMed Google Scholar
- Enrique M. ToledoView author publications
Search author on:PubMed Google Scholar
- Ana DomingosView author publications
Search author on:PubMed Google Scholar
Contributions
G.S. and A.I.D. conceived the study. G.S., A.K. and T.M. performed scRNA-seq. E.M.T. and G.S. analysed scRNA-seq data. G.S. and D.S.O. performed the public scRNA dataset analysis. S.L. and G.S. designed and conducted the dual immunohistochemistry and RNAscope. G.S. designed and performed in vivo drug and antibody experiments, immunohistochemistry, explant culture, confocal and Airyscan super-resolution microscopy, and ELISA. G.S., E.H. and P.F.-S. conducted weight acquisition and food intake measurements of LeprCreAdrb2fl/fl mice. G.S. and P.F.-S. performed indirect calorimetry and body composition experiments. K.P. and G.S. performed the BAT activity and qPCR. E.S. performed the immunohistochemistry of ob/ob mice. T.G. and T.N.C. performed the AlphaFold and molecular dynamics assays. K.Z., A.G. and S.H.E. provided human sympathetic scRNA-seq data and RNAscope imaging of human stellate ganglia. S.W.C. helped with muscle dissection. C.M. performed genetic analyses on UKB data. A.R. and M.I. performed electron microscopy on samples prepared by N.M.-S. and B.A.A. M.S. helped G.S. with HUVEC overexpression experiments. Y.Z. generated data supporting the reviewer response. M.L. and S.C.L.K. provided the indirect calorimetry facility. P.E.S. generously provided the leptin-neutralizing antibody. G.S. and A.I.D. wrote and revised the paper with input from all authors.
Ethics declarations
Competing interests
A.C., T.M., C.M., S.L. and E.M.T. work for Novo Nordisk. E.M.T., T.M. and S.L. are minor stock owners as part of an employee-offering programme. G.S. received project funding from a Novo Nordisk Postdoctoral fellowship. M.L. serves as scientific director of Gazella Biotech (https://gazellabiotech.com/). The other authors declare no competing interests
Peer review
Peer review information
Nature Metabolism thanks the anonymous reviewer(s) for their contribution to the peer review of this work. Primary Handling Editor: Revati Dewal, in collaboration with the Nature Metabolism team
Additional information
Publisher’s note Springer Nature remains neutral with regard to jurisdictional claims in published maps and institutional affiliations
Extended data
Extended Data Fig. 1 Single-cell transcriptomic data of sympathetic ganglia from lean and obese mice
a, The weekly body weight gain of WT male mice treated with normal chow diet (lean) and a high-fat diet (obese) for 11 weeks (n = 12 per group). p values by week: 0 (3.6 × 10⁻⁵), 1 (2.3 × 10⁻⁵), 2 (7.69 × 10⁻⁴), 3 (0.36618), 4 (0.012173), 5 (2.6 × 10⁻⁵), 6 (4.0 × 10⁻⁶), 7 ( < 1 × 10⁻⁶), 8 ( < 1 × 10⁻⁶), 9 ( < 1 × 10⁻⁶), 10 ( < 1 × 10⁻⁶), 11 ( < 1 × 10⁻⁶). b, Uniform manifold approximation and projection (UMAP) plot indicating sample classification as lean and obese. c, Uniform manifold approximation and projection (UMAP) plot indicating sample classification as superior cervical ganglia (SCG) and stellate. d, Bar graph showing the percentage of different cell populations. ECs = Endothelial cells, Sc_NM = Schwann cell_non myelinating, Sc_M = Schwann cell_myelinating, DCs = dendritic cells, Tregs = regulatory T cells. Data were mean ± s.e.m and were analyzed using two-way ANOVA with Turkey’s post-hoc test. **p < 0.01, ***p < 0.001.
Source data
Extended Data Fig. 2 Identification of Lepr+ vascular endothelial cell population in sympathetic ganglia
a, Violin plot to show Lyve1 and Prox1 expression in sympathetic endothelial cell population. For visualization, denoised expression data was used. b, Correlogram to show the co-expression of Lepr and Cav1 in different cell populations. c, Box plot showing the percentage of cells co-expressing Lepr and Cav1 in the endothelial cluster from scRNA-seq data of 20 lean mice (10 per experiment). Values were estimated by bootstrap resampling of pooled cells. Boxes indicate median and interquartile range of bootstrap distributions. d, Correlogram to show the co-expression of Lepr and Vegfr2 in different cell populations. e, Correlogram to show the co-expression of Lepr and Cdh5 in different cell populations. f, Box plot showing the percentage of Lepr+Vegfr2+ in the endothelial cell population from scRNA-seq data of 20 lean mice (10 per experiment). Values were estimated by bootstrap resampling of pooled cells. Boxes indicate median and interquartile range of bootstrap distributions. g, Box plot shows the percentage of cells co-expressing Lepr and Cdh5 in the endothelial cluster from scRNA-seq data of 20 lean mice (10 per experiment). Values were estimated by bootstrap resampling of pooled cells. Boxes indicate median and interquartile range of bootstrap distributions. The position of the dotted lines is described in the Methods. ECs = endothelial cells, Sc_NM = Schwann cell_non myelinating, Sc_M = Schwann cell_myelinating, DCs = dendritic cells, Tregs = regulatory T cells.
Source data
Extended Data Fig. 3 Lepr+ sympathetic endothelial cells constitute a thin layer surrounding SCG and sympathetic nerve bundles of scWAT and BAT isolated from 12-week-old LeprCre; LSL-YFP mice
a-c, Co-expression of LEPR (YFP) & CAV1 in the perineurium surrounding the TH+ sympathetic neurons. d, e Co-expression of LEPR (YFP) & VEGFR2 in the perineurium surrounding the TH+ sympathetic neurons. f, g Co-expression of LEPR (YFP) & CDH5 in the perineurium surrounding the TH+ sympathetic neurons. Samples were imaged at 40x MPLX_4Y Airyscan mode (a-g, left panel). Scale bar = SCG (50 µm), nerve bundles (10 µm). The white box indicates the field of view of the high-resolution images. The Super-resolution images were taken at 40x Airyscan SR mode (a-g, right three panels). Scale bar = SCG (10 µm), nerve bundles (2 µm). The experiments were repeated three times with similar results.
Extended Data Fig. 4 Immunofluorescence staining of LEPR (YFP), TH, and GLUT1 protein in T11 to L1-L2, SCG isolated from 12-week-old LeprCre; LSL-YFP reporter mice
a-d, The LEPR+ GLUT1+ perineurial barrier surrounding TH+ sympathetic neurons in T11 to L2 sympathetic ganglia that innervate WAT. Scale bar = 50 µm. e, LEPR (YFP) and GLUT1 expression in the perineurium of superior cervical ganglia (SCG). The white box indicates the field of view of the higher-resolution images. Scale bar = top panel (50 µm), lower panels (10 µm). The experiments were repeated three times with similar results
Extended Data Fig. 5 Lepr+ SPCs express β2 adrenergic (Adrb2) receptor in sympathetic ganglia innervating white and brown adipose tissue
a, Dot plot showing the expression of adrenergic receptors (Adrb1, Adrb2, Adra2a, Adra2b, Adra2c, Adra1a, and Adra1b in our scRNA sympathetic ganglia dataset. The size of the dot corresponds to the percentage of cells expressing the gene in each cluster, and the color represents the average gene expression level. b, Box plot shows the percentage of endothelial cells co-expressing Lepr, Glut1, and Adrb2from scRNA-seq data of 20 lean mice (10 per experiment). Values were estimated by bootstrap resampling of pooled cells. Boxes indicate median and interquartile range of bootstrap distributions. c, High magnification images showing the expression of CAV1 protein and Lepr, Adrb2 mRNA in superior cervical ganglia (SCG) and sympathetic nerve (SN) bundles dissected from WT adult mice. d-g, The dual labelling of GLUT1 protein with IHC and Lepr, Adrb2 mRNA with ISH in the T11 (d), T12 (e), T13 (f) and L1/L2 (g) of wild type mice. The yellow boxes in the left panel (40x) indicate the field of view of the higher resolution (120x) images in the right panel. Scale bar = left panel (50 µm), right panel (5 µm). ECs = endothelial cells, Sc_NM = Schwann cell_non myelinated, Sc_M = Schwann cell_myelinated, DCs = dendritic cells, Tregs = regulatory T cells. (c-g) The experiments were repeated twice with similar results.
Source data
Extended Data Fig. 6 Detailed analysis of Tabula Muris Consortium showing no notable co-expression of Lepr and Adrb2 across different cell types in thymus, skin, pancreas, fat, diaphragm, colon, brain, aorta, tongue, and muscle, whereas only endothelial cells in our sympathetic ganglia dataset exhibit substantial co-expression
a, Dot plot showing the percentage of Lepr+Adrb2+ cells in our sympathetic ganglia dataset. b-l, Dot plot showing the percentage of Lepr+Adrb2+ cells in different mouse organs documented in Tabula Muris Consortium. M = Microfluidic droplet method. F = FACS-based method. Cells with normalized expression values > 0.75 for both genes were considered positive for co-expression
Source data
Extended Data Fig. 7 Detailed analysis of Tabula Muris Consortium showing no notable co-expression of Lepr and Adrb2 across different cell types in marrow, heart, liver, kidney, trachea, and bladder
a-i, Dot plot showing the percentage of Lepr+Adrb2+ cells in different mouse organs documented in Tabula Muris Consortium. j, Dot plot of the percentage of Lepr+Adrb2+ cells across different cell types in mouse bladder (Yu et al., JASN 2019; PMID: 31462402). M = Microfluidic droplet method. F = FACS-based method. Cells with normalized expression values > 0.75 for both genes were considered positive for co-expression
Source data
Extended Data Fig. 8 Lepr+ SPCs express β2 adrenergic (Adrb2) receptor, and other cells in other organs show little or no Lepr and Adrb2 co-expression
a-m, Correlogram showing the expression of Lepr and Adrb2 across different scRNA datasets and tissues. The position of the dotted lines is described in the Methods. n, Bar plot representing the percentage of double-positive Lepr+Adrb2+ endothelial cells across tissues and datasets. ECs = endothelial cells, MCA = Mouse Cell Atlas, versions v1 and v2, TMS = Tabula Muris Senis, TM = Tabula Muris, WAT = white adipose tissue, BAT = brown adipose tissue, DRG = dorsal root ganglia
Source data
Extended Data Fig. 9 Peripheral organs show low or no co-expression of Lepr and Adrb2
High magnification images showing the expression of Lepr (red) and Adrb2 (green) mRNA in (a) brown adipose tissue (BAT), (b) subcutaneous white adipose tissue (scWAT), (c) visceral adipose tissue (VAT), (d) heart, (e) pancreas, (f) skeletal muscle, (g) liver and (h) small gut of adult wild type mice. Background autofluorescence (Auto_F) was brightened to visualize the tissue architecture (cyan). The boxed areas in the left panels (60x) are shown at higher magnification (120x) on the right. (i-k) High magnification image showing the expression of Lepr mRNA (red) and Adrb2 mRNA (green) in PECAM1+ (white) endothelial cells in trachea (i), bladder (j), and lung (k). Cell nuclei were labelled with DAPI (blue). The boxed areas in the left panels (4x) are shown at higher magnification (40x) at right. Scale bar = left panel (100 µm), right panel (20 µm). The experiments were repeated twice with similar results.
Extended Data Fig. 10 Leptin receptor and different adrenergic receptors co-expression analysis in arcuate hypothalamic scRNA dataset extracted from HypoMap
a, UMAP plot to show the major cell populations in the arcuate hypothalamus. b, UMAP plot to show the expression of Lepr and Adrb2 in different cell clusters of the arcuate hypothalamus. c, Correlogram shows the co-expression of Lepr and Adrb2 in the neuronal population of the arcuate hypothalamus. d-e, UMAP plot to show the expression of other adrenergic receptors (Adra1a, Adra1b, Adra2a, Adra2c, Adrb1, and Adrb3) in different cell clusters of the arcuate hypothalamus. f-k, Correlogram to show the co-expression of Lepr and other adrenergic receptors in the neuronal population of the arcuate hypothalamus. The position of the dotted lines is described in the Methods.
Source data
Supplementary information
Supplementary Information (download PDF )
Supplementary Methods, Figs. 1–10 and legends, and Table legends 1–3
Reporting Summary (download PDF )
Supplementary Table 1 (download XLSX )
Statistical analysis of indirect calorimetry data. a, Statistical analysis of metabolic cage data from chow-fed Adrb2fl/fl and LeprCre: Adrb2fl/fl mice. b, Statistical analysis of metabolic cage data from HFD-challenged Adrb2fl/fl and LeprCre: Adrb2fl/fl mice. Data were analysed by two-way ANOVA with Bonferroni post hoc test (RER and total activity) and ANCOVA (O2 consumption, CO2 production and energy expenditure)
Supplementary Table 2 (download XLSX )
The effects of LEPR and ADRB2 variants in the regulation of BMI. a, LEPR variant Gln223Arg (rs1137101) and ADRB2 variant Gln27Glu (rs1042714) effects on BMI in the UKB population. b, The independent effect of LEPR variant Gln223Arg or ADRB2 variant Gln27Glu on BMI in men and women. c, The synergistic interaction between LEPR variant Gln223Arg and ADRB2 variant Gln27Glu on BMI in men and women. EA, effect allele; EAF, effect allele frequency; AA, amino acid, Beta, effect size; SE, standard error; IAF, interaction allele frequency; P = P value. Data were analysed using linear regression with an interaction variable corrected for age, sex and the first ten principal components with Bonferroni correction for multiple testing. *P value < 0.05.
Supplementary Table 3 (download XLSX )
The list of primers used for RT–qPCR
Supplementary Data 1 (download ZIP )
Source data for Supplementary Figs. 1, 2 and 4–9.
Source data
Source Data Fig. 1 (download XLSX )
Statistical
Source Data Fig. 2 (download XLSX )
Statistical
Source Data Fig. 3 (download XLSX )
Statistical
Source Data Fig. 4 (download XLSX )
Statistical
Source Data Fig. 5 (download XLSX )
Statistical
Source Data Fig. 6 (download XLSX )
Statistical
Source Data Extended Data Fig./Table 1 (download XLSX )
Statistical
Source Data Extended Data Fig./Table 2 (download XLSX )
Statistical
Source Data Extended Data Fig./Table 5 (download XLSX )
Statistical
Source Data Extended Data Fig./Table 6 (download XLSX )
Statistical
Source Data Extended Data Fig./Table 7 (download XLSX )
Statistical
Source Data Extended Data Fig./Table 8 (download XLSX )
Statistical
Source Data Extended Data Fig./Table 10 (download XLSX )
Statistical
Rights and permissions
Open Access This article is licensed under a Creative Commons Attribution 4.0 International License, which permits use, sharing, adaptation, distribution and reproduction in any medium or format, as long as you give appropriate credit to the original author(s) and the source, provide a link to the Creative Commons licence, and indicate if changes were made. The images or other third party material in this article are included in the article’s Creative Commons licence, unless indicated otherwise in a credit line to the material. If material is not included in the article’s Creative Commons licence and your intended use is not permitted by statutory regulation or exceeds the permitted use, you will need to obtain permission directly from the copyright holder. To view a copy of this licence, visit http://creativecommons.org/licenses/by/4.0/.
About this article
Cite this article
Sarker, G., Haberman, E., Chandran, A. et al. The perineurium integrates leptin with its sympathetic outflow to protect against obesity.
Nat Metab (2026). https://doi.org/10.1038/s42255-026-01555-3
Received:20 February 2026
Accepted:02 June 2026
Published:13 July 2026
Version of record:13 July 2026
DOI
:https://doi.org/10.1038/s42255-026-01555-3
